Difference between revisions of "Turbidity sensors"
(→Light Scattering Properties) |
Dronkers J (talk | contribs) |
||
| (76 intermediate revisions by 2 users not shown) | |||
| Line 1: | Line 1: | ||
==Introduction== | ==Introduction== | ||
===Definition=== | ===Definition=== | ||
| − | Turbidity is defined as the reduction of transparency of a liquid caused by the presence of undissolved suspended matter.<ref>ISO 7027, Water Quality, International Standard,1999</ref> The origin of the particles found in seawater can be mineral (such as clay and silts) or organic (such as particulate organic matter or living organisms like plankton). Turbidity is not, however, a direct measure of suspended particles in water, but a measure of the scattering effect such particles have on light. | + | Turbidity is defined as the reduction of transparency of a liquid caused by the presence of undissolved suspended matter.<ref name=ISO>ISO 7027, Water Quality, International Standard,1999</ref> The origin of the particles found in seawater can be mineral (such as clay and silts) or organic (such as particulate organic matter or living organisms like plankton). Turbidity is not, however, a direct measure of suspended particles in water, but a measure of the scattering effect such particles have on light. |
| + | ===Light Scattering different from Particle Concentration=== | ||
| + | [[Image: scatter.PNG| thumb| 375px| right|'''Figure 1<ref name=ISO/>''']] | ||
| + | A water sample colored by dissolved substances is an homogeneous system that only attenuates the radiation that goes through it. A water sample that contains undissolved particles attenuates the incident light and, in addition, the particles scatter the light unequally in all directions. The scattering of the radiation towards the front generated by the particles, changes the attenuation in such way that the relative spectral attenuation coefficient <math> \mu (\lambda)</math> is the sum of the spectral diffusion coefficients <math> s (\lambda)</math> and the spectral absorption coefficient | ||
| + | <math> \alpha (\lambda)</math>. | ||
| − | = | + | <div><math> \mu (\lambda)\ = s (\lambda) + \alpha (\lambda)</math></div> |
| − | + | ||
| + | To obtain the spectral diffusion coefficient <math> s (\lambda)</math> alone, the spectral absorption coefficient <math> \alpha (\lambda)</math> must be known. To determine the spectral absorption coefficient of the dissolved substances, in some cases the undissolved particles may be filtered, although this my cause interference. Thus, it necessary to compare the results of the turbidity measurements with a standard scale. | ||
| + | The intensity of the scattered radiation depends on the wavelength of the incident radiation, the measuring angle, and on the shape, optical characteristics and size distribution of the suspended particles. In measurements of the attenuation of the transmitted radiation, the measured values depend on the aperture angle <math> \Omega_\theta </math>. The angle <math> \theta </math> is formed by the direction of the incident radiation and the direction of the measured scattered radiation, as shown in '''figure 1'''. | ||
| + | <ref name=ISO/> | ||
| + | |||
| + | ===Light Scattering and Particle Size=== | ||
| + | [[Image: Light Scattering.PNG|thumb|left |350px|Angular patterns of scattered intensity from particles of three sizes. (A) small particles, (B) large particles, (C) larger particles <ref>Brumberger, et al, “Light Scattering”, Science and Technology, November, 1968, page 38.</ref>]] | ||
| + | <br> | ||
| − | |||
| − | In | + | Particles interact with incident light absorbing it and scattering it in all directions. The spatial distribution of scattered light depends on the ratio of particle size to wavelength of incident light. Particles much smaller than the wavelength of incident light exhibit a fairly symmetrical scattering distribution with approximately equal amounts of light scattered both forward and backward (Figure A). As particle sizes increase in relation to wavelength, light scattered from different points of the sample particle create interference patterns that are additive in the forward direction. This constructive interference results in forward-scattered light of a higher intensity than light scattered in other directions (Figures B and C). In addition, smaller particles scatter shorter (blue) wavelengths more intensely while having little effect on longer (red) wavelengths. Conversely, larger particles scatter long wavelengths more readily than they scatter short wavelengths of light. Particle shape and refractive index also affect scatter distribution and intensity. Spherical particles exhibit a larger forward-to-back scatter ratio than coiled or rodshaped particles. The refractive index of a particle is a measure of how it redirects light passing through it from another medium such as the suspending fluid. The particle’s refractive index must be different than the refractive index of the sample fluid in order for scattering to occur. As the difference between the refractive indices of suspended particle and suspending fluid increases, scattering becomes more intense. The color of suspended solids and sample fluid are significant in scattered-light detection. A colored substance absorbs light energy in certain bands of the visible spectrum, changing the character of both transmitted light and scattered light and preventing a certain portion of the scattered light from reaching the detection system. |
| + | Light scattering intensifies as particle concentration increases. But as scattered light strikes more and more particles, multiple scattering occurs and absorption of light increases. When particulate concentration exceeds a certain point, detectable levels of both scattered and transmitted light drop rapidly, marking the upper limit of measurable turbidity. Decreasing the path length of light through the sample reduces the number of particles between the light source and the light detector and extends the upper limit of turbidity measurement. | ||
| + | [[Image: secchi.jpg|right|300pix| thumb| The Secchi disk is submerged into the water, when the disk is no longer vsisble the length of the cable is measured. The disk is then hauled slowly until it's visible again and the cable length is measured. Secchi depth is determined by calculating the average of the measurements of the cable.]] | ||
| − | + | ==Measurements of Turbidity== | |
| + | ===Secchi Disk=== | ||
| + | The first record of turbidity being approached in a scientific way, is attributed to the head of the Papal Navy in 1865, Commander Cialdi. Commander Cialdi was interested in the transparency of the sea and the visibility of its floor (for navigational purposes) and during his research he had read that a captain had reported seeing a plate in a net at a depth of 40 m. Commander Cialdi commenced his investigation on the sea visibility and immediately tried several different disk sizes and colors. Later, he hired the services of Professor Pietro Angelo Secchi, an Italian scholar and priest. Together they published ''Sur la Transparence de la Mer.''(On the transparency of the Sea) where they described the development of a white disk (later modified by George Whipple) connected to a pole or a cable to measure the transparency of the sea. Secchi made further observations on the influence of the boat's shadow, the surface reflection of the light, the clearness of the sky, and the height at which the observer stands<ref>Tyler, John E. , 1968, THE SECCHI DISC, LIMNOLOGY AND OCEANOGRAPHY, vol.8, no. 1 </ref>. While his method has been used ever since and it is still used today as a qualitative measure of the oceans' turbidity, it has never been standardized so its accuracy is very limited. | ||
| − | == | + | ===Jackson candle turbidimeter=== |
| − | + | [[image: Jackson Turbidimeter2.PNG |left|200px|thumb| The arrow indicates the point at which scattered light is as intense as transmitted light, i.e., the image of the flame disappears]] | |
| − | + | The first attempt to measure turbidity in a standardized fashion was made by Whipple and Jackson in 1900. Whipple and Jackson developed a standard suspension fluid using 1,000 parts per million (ppm) of diatomaceous earth in distilled water to use as a scale and a turbidimeter (Jackson candle turbidimeter). The method consists in placing a lit candle under a flat-bottomed tube in which the water in poured until the image of the candles fades unto a glare when observed from above. Visual image extinction occurred when the intensity of the scattered light equaled that of transmitted light. The height of the water would be read against the ppm-silica scale and units were given in Jackson turbidity units (JTU). Needless to say that this method is prone to errors too, as the diatomaceous earth varies in its composition and the reading is subjected to the observer. | |
| + | In addition to the problems mentioned above, the wavelength of the candle light is not as effectively back-scattered by small size particles while the dark particles absorb so much more light than they scatter, that it is impossible to obtain a reading.[[Image: Nephelometer.PNG | right|250px|thumb|In nephelometric measurement, turbidity is determined by the light scattered at an angle of 90° from the incident beam.<ref>TURBIDITY SCIENCE, Technical Information Series—Booklet No. 11, Michael J. Sadar</ref>]] | ||
| + | Other methods were developed following the principle of the Jackson candle turbidimeter with improved light sources, but the bias induced by the observer was still a limitation. The development of the photoelectric detector brought much better precision under certain conditions. The photoelectric detector measured the attenuation of transmitted light through a fixed-volume sample and it was sensible to very small changes in light intensity. Still, the photoelectric detector could not read changes in high or extremely low turbidity.<ref>EPA Guidance Manual, Turbidity Provisions, April, 1999</ref> | ||
| − | + | ===Nephelometers and other Optical Sensors=== | |
| + | [[Image: ratio_turbidimeter.JPG|thumb |right|350px|font-size=80% A large transmitted-light detector measures the light that passes through the sample. A neutral density filter attenuates the light incident on this detector and the combination is canted at 45 degrees to the incident light, so that reflections from the surface of the filter and detector do not enter the sample cell area. A forward-scatter detector measures the light scattered at 30 degrees from the transmitted direction. A detector at 90 degrees nominal to the forward direction measures light scattered from the sample normal to the incident beam. This detector is mounted out of the plane formed by the light beam and the other detectors. The angle and baffling for this out-of-plane mounting blocks light scattered directly from the sides of the sample cell while collecting light scattered from the light beam. The signals from each of these detectors are then mathematically combined to calculate the turbidity of a sample. The 2100AN contains a fourth, back-scatter detector that measures the light scattered at 138 degrees nominal from the transmitted direction. This detector “sees” light scattered by very turbid samples when the other detectors no longer produce a linear signal.]] | ||
| + | The solution for this problem finally came in the 1970's when the nephelometric turbidimeter, or nephelometer, was developed. The name comes from [[nepheloid layer]] which in turn comes from the Greek word ''nephos'' meaning cloud. This instrument determines turbidity by measuring the light scattered at an angle of 90° from the incident beam. A 90° detection angle is considered to be the least sensitive to variations in particle size. Nephelometers are the standard instrument to measure turbidity according to ISO, EN, and [http://www.epa.gov/ EPA]. the single difference between these norms is that ISO and EN nephelometers use 860nm Infrared emmiting diode as a light source, while EPA uses tungsten-filament lamp operated at a color temperature between 2200 and 3000 degree K. The latter has limitations concerning colored samples as these will attenuate the light beam leading to errors in the turbidity measurement. | ||
| + | Ratio™ Turbidimeters use several scatter detectors and are able to compensate the light attenuation that occurs in a colored sample. | ||
| + | Transmissometer | ||
| − | + | ==Calibration standards== | |
| − | + | ||
| − | + | ===Formazin=== | |
| + | |||
| + | In 1926, Kingsbury and Clark discovered Formazin, a suspension that is created by the polymerization of hexamethylenetetramine and hydrazine sulfate in water. This new solution improved greatly the consistency in standards formulation. Measuring units were renamed to formazin turbidity units (FTU). The downside of Formazin is that once synthesized, the solution is stable for only four weeks, and while reproducible and accurate results are relatively easy to achieve in high concentrations, at low concentrations the same results are very difficult to obtain. In addition, Formazin produces a trace amount of formaldehyde, which is a carcinogen, so it must be handled appropriately<ref>http://www.labchem.net/msds/75606.pdf</ref>.[[Image: formazinFTU.jpg| thumb|500px| center|Typical series of Formazin turbidity standards shown in NTU/FTU.<ref>https://www.optek.com/en/products.asp Optek turbidity meters</ref>]] | ||
| + | |||
| + | ===[https://amcoclear.com/ Amco Clear<sup>®</sup>]=== | ||
| + | Amco Clear is a turbidity standard developed by GFS Chemicals and consists of Styrene Divinyl Benzene Copolymer Beads in water. It is an EPA approved primary standard for calibration of turbidity sensors that is safe, non-toxic and disposable. It is easy-to-use with no dilution or resuspension, and it is available in a wide range of values. It is NIST traceable to particle size/distribution and optical density, and its inherent stability means it does not settle from suspension | ||
| + | |||
| + | ===[https://www.hach.com/stablcal-turbidity-standard-0-1-ntu-100ml/product?id=7640202629 StablCal<sup>®</sup>]=== | ||
| + | StablCal stabilized Formazin Turbidity Standards are true Formazin dilutions developed for use in any turbidimeter. NTU Value: < 0.1. | ||
==Causes and Impacts of turbidity in Marine Ecosystems== | ==Causes and Impacts of turbidity in Marine Ecosystems== | ||
| Line 31: | Line 59: | ||
* definition of [[turbidity]]. | * definition of [[turbidity]]. | ||
* [[Instruments and sensors to measure environmental parameters]] | * [[Instruments and sensors to measure environmental parameters]] | ||
| + | * [[Light fields and optics in coastal waters]] | ||
| + | * [[General principles of optical and acoustical instruments]] | ||
| + | * [[Optical backscatter point sensor (OBS)]] | ||
| + | * [[Instruments and sensors to measure environmental parameters]] | ||
| + | |||
==References== | ==References== | ||
<references/> | <references/> | ||
| − | |||
| − | |||
| − | |||
| − | |||
| − | |||
| Line 47: | Line 75: | ||
|AuthorFullName=Souza Dias, Francisco | |AuthorFullName=Souza Dias, Francisco | ||
|AuthorName=Francisco Souza Dias}} | |AuthorName=Francisco Souza Dias}} | ||
| + | |||
| + | [[Category:Coastal and marine observation and monitoring]] | ||
| + | [[Category:Observation of physical parameters]] | ||
| + | [[Category:Sediment]] | ||
Latest revision as of 14:04, 22 August 2020
Contents
Introduction
Definition
Turbidity is defined as the reduction of transparency of a liquid caused by the presence of undissolved suspended matter.[1] The origin of the particles found in seawater can be mineral (such as clay and silts) or organic (such as particulate organic matter or living organisms like plankton). Turbidity is not, however, a direct measure of suspended particles in water, but a measure of the scattering effect such particles have on light.
Light Scattering different from Particle Concentration
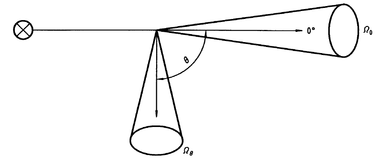
A water sample colored by dissolved substances is an homogeneous system that only attenuates the radiation that goes through it. A water sample that contains undissolved particles attenuates the incident light and, in addition, the particles scatter the light unequally in all directions. The scattering of the radiation towards the front generated by the particles, changes the attenuation in such way that the relative spectral attenuation coefficient [math] \mu (\lambda)[/math] is the sum of the spectral diffusion coefficients [math] s (\lambda)[/math] and the spectral absorption coefficient [math] \alpha (\lambda)[/math].
To obtain the spectral diffusion coefficient [math] s (\lambda)[/math] alone, the spectral absorption coefficient [math] \alpha (\lambda)[/math] must be known. To determine the spectral absorption coefficient of the dissolved substances, in some cases the undissolved particles may be filtered, although this my cause interference. Thus, it necessary to compare the results of the turbidity measurements with a standard scale. The intensity of the scattered radiation depends on the wavelength of the incident radiation, the measuring angle, and on the shape, optical characteristics and size distribution of the suspended particles. In measurements of the attenuation of the transmitted radiation, the measured values depend on the aperture angle [math] \Omega_\theta [/math]. The angle [math] \theta [/math] is formed by the direction of the incident radiation and the direction of the measured scattered radiation, as shown in figure 1. [1]
Light Scattering and Particle Size
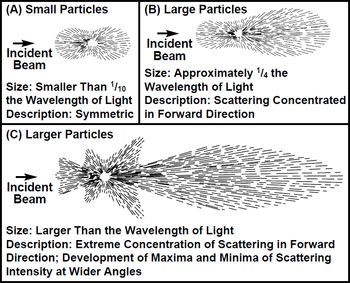
Particles interact with incident light absorbing it and scattering it in all directions. The spatial distribution of scattered light depends on the ratio of particle size to wavelength of incident light. Particles much smaller than the wavelength of incident light exhibit a fairly symmetrical scattering distribution with approximately equal amounts of light scattered both forward and backward (Figure A). As particle sizes increase in relation to wavelength, light scattered from different points of the sample particle create interference patterns that are additive in the forward direction. This constructive interference results in forward-scattered light of a higher intensity than light scattered in other directions (Figures B and C). In addition, smaller particles scatter shorter (blue) wavelengths more intensely while having little effect on longer (red) wavelengths. Conversely, larger particles scatter long wavelengths more readily than they scatter short wavelengths of light. Particle shape and refractive index also affect scatter distribution and intensity. Spherical particles exhibit a larger forward-to-back scatter ratio than coiled or rodshaped particles. The refractive index of a particle is a measure of how it redirects light passing through it from another medium such as the suspending fluid. The particle’s refractive index must be different than the refractive index of the sample fluid in order for scattering to occur. As the difference between the refractive indices of suspended particle and suspending fluid increases, scattering becomes more intense. The color of suspended solids and sample fluid are significant in scattered-light detection. A colored substance absorbs light energy in certain bands of the visible spectrum, changing the character of both transmitted light and scattered light and preventing a certain portion of the scattered light from reaching the detection system.
Light scattering intensifies as particle concentration increases. But as scattered light strikes more and more particles, multiple scattering occurs and absorption of light increases. When particulate concentration exceeds a certain point, detectable levels of both scattered and transmitted light drop rapidly, marking the upper limit of measurable turbidity. Decreasing the path length of light through the sample reduces the number of particles between the light source and the light detector and extends the upper limit of turbidity measurement.
Measurements of Turbidity
Secchi Disk
The first record of turbidity being approached in a scientific way, is attributed to the head of the Papal Navy in 1865, Commander Cialdi. Commander Cialdi was interested in the transparency of the sea and the visibility of its floor (for navigational purposes) and during his research he had read that a captain had reported seeing a plate in a net at a depth of 40 m. Commander Cialdi commenced his investigation on the sea visibility and immediately tried several different disk sizes and colors. Later, he hired the services of Professor Pietro Angelo Secchi, an Italian scholar and priest. Together they published Sur la Transparence de la Mer.(On the transparency of the Sea) where they described the development of a white disk (later modified by George Whipple) connected to a pole or a cable to measure the transparency of the sea. Secchi made further observations on the influence of the boat's shadow, the surface reflection of the light, the clearness of the sky, and the height at which the observer stands[3]. While his method has been used ever since and it is still used today as a qualitative measure of the oceans' turbidity, it has never been standardized so its accuracy is very limited.
Jackson candle turbidimeter
The first attempt to measure turbidity in a standardized fashion was made by Whipple and Jackson in 1900. Whipple and Jackson developed a standard suspension fluid using 1,000 parts per million (ppm) of diatomaceous earth in distilled water to use as a scale and a turbidimeter (Jackson candle turbidimeter). The method consists in placing a lit candle under a flat-bottomed tube in which the water in poured until the image of the candles fades unto a glare when observed from above. Visual image extinction occurred when the intensity of the scattered light equaled that of transmitted light. The height of the water would be read against the ppm-silica scale and units were given in Jackson turbidity units (JTU). Needless to say that this method is prone to errors too, as the diatomaceous earth varies in its composition and the reading is subjected to the observer.
In addition to the problems mentioned above, the wavelength of the candle light is not as effectively back-scattered by small size particles while the dark particles absorb so much more light than they scatter, that it is impossible to obtain a reading.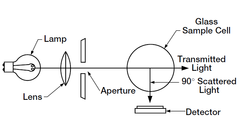
Other methods were developed following the principle of the Jackson candle turbidimeter with improved light sources, but the bias induced by the observer was still a limitation. The development of the photoelectric detector brought much better precision under certain conditions. The photoelectric detector measured the attenuation of transmitted light through a fixed-volume sample and it was sensible to very small changes in light intensity. Still, the photoelectric detector could not read changes in high or extremely low turbidity.[5]
Nephelometers and other Optical Sensors
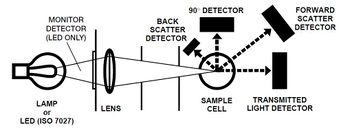
The solution for this problem finally came in the 1970's when the nephelometric turbidimeter, or nephelometer, was developed. The name comes from nepheloid layer which in turn comes from the Greek word nephos meaning cloud. This instrument determines turbidity by measuring the light scattered at an angle of 90° from the incident beam. A 90° detection angle is considered to be the least sensitive to variations in particle size. Nephelometers are the standard instrument to measure turbidity according to ISO, EN, and EPA. the single difference between these norms is that ISO and EN nephelometers use 860nm Infrared emmiting diode as a light source, while EPA uses tungsten-filament lamp operated at a color temperature between 2200 and 3000 degree K. The latter has limitations concerning colored samples as these will attenuate the light beam leading to errors in the turbidity measurement. Ratio™ Turbidimeters use several scatter detectors and are able to compensate the light attenuation that occurs in a colored sample. Transmissometer
Calibration standards
Formazin
In 1926, Kingsbury and Clark discovered Formazin, a suspension that is created by the polymerization of hexamethylenetetramine and hydrazine sulfate in water. This new solution improved greatly the consistency in standards formulation. Measuring units were renamed to formazin turbidity units (FTU). The downside of Formazin is that once synthesized, the solution is stable for only four weeks, and while reproducible and accurate results are relatively easy to achieve in high concentrations, at low concentrations the same results are very difficult to obtain. In addition, Formazin produces a trace amount of formaldehyde, which is a carcinogen, so it must be handled appropriately[6].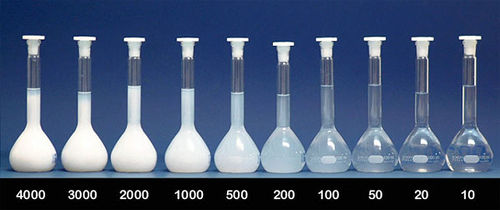
Amco Clear®
Amco Clear is a turbidity standard developed by GFS Chemicals and consists of Styrene Divinyl Benzene Copolymer Beads in water. It is an EPA approved primary standard for calibration of turbidity sensors that is safe, non-toxic and disposable. It is easy-to-use with no dilution or resuspension, and it is available in a wide range of values. It is NIST traceable to particle size/distribution and optical density, and its inherent stability means it does not settle from suspension
StablCal®
StablCal stabilized Formazin Turbidity Standards are true Formazin dilutions developed for use in any turbidimeter. NTU Value: < 0.1.
Causes and Impacts of turbidity in Marine Ecosystems
High turbidity has a number of detrimental effects on aquatic ecosystems: decrease in light penetration (limiting plant growth), fish movements and the ability of predatory fish and birds to see their prey. High turbidity means high concentration of suspended solids, which can harm fish and other aquatic fauna. These suspended solids in the process of settling down to the ocean bottom have a choking effect on bottom dwelling organisms and aquatic habitats.[8]
See also
- definition of turbidity.
- Instruments and sensors to measure environmental parameters
- Light fields and optics in coastal waters
- General principles of optical and acoustical instruments
- Optical backscatter point sensor (OBS)
- Instruments and sensors to measure environmental parameters
References
- ↑ 1.0 1.1 1.2 ISO 7027, Water Quality, International Standard,1999
- ↑ Brumberger, et al, “Light Scattering”, Science and Technology, November, 1968, page 38.
- ↑ Tyler, John E. , 1968, THE SECCHI DISC, LIMNOLOGY AND OCEANOGRAPHY, vol.8, no. 1
- ↑ TURBIDITY SCIENCE, Technical Information Series—Booklet No. 11, Michael J. Sadar
- ↑ EPA Guidance Manual, Turbidity Provisions, April, 1999
- ↑ http://www.labchem.net/msds/75606.pdf
- ↑ https://www.optek.com/en/products.asp Optek turbidity meters
- ↑ Saba Mylvaganam, Torgeir Jakobsen, 1998, TURBIDITY SENSOR FOR UNDERWATER APPLICATIONS Sensor Design and System Performance with Calibration Results, OCEANS '98 Conference Proceedings, Vol.1, 158-161
Please note that others may also have edited the contents of this article.
|

