Difference between revisions of "Oil spill monitoring"
R.archetti (talk | contribs) |
R.archetti (talk | contribs) |
||
| Line 25: | Line 25: | ||
There are certain times when visual techniques and optical satellite image are unsuitable for mapping of oil spill; it is in these cases where radar remote sensing is required. These situations include spills covering vast areas of the marine environment, and when the oil cannot be seen or discriminated against the background. The discrimination of oil in these circumstances presents several unique problems. The remotely sensed data collected in these situations often provide complex signatures, which must be deciphered in order to locate the spilled oil. | There are certain times when visual techniques and optical satellite image are unsuitable for mapping of oil spill; it is in these cases where radar remote sensing is required. These situations include spills covering vast areas of the marine environment, and when the oil cannot be seen or discriminated against the background. The discrimination of oil in these circumstances presents several unique problems. The remotely sensed data collected in these situations often provide complex signatures, which must be deciphered in order to locate the spilled oil. | ||
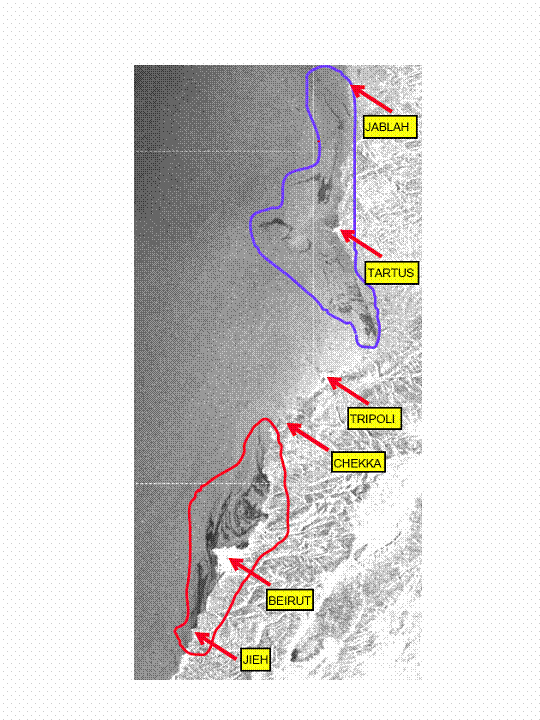
| − | SAR (Synthetic Aperture Radar) seems to be one of the most suitable instruments to the detection of slicks since slicks damp strongly short waves measured by SAR and oil spills appear as a dark patch on the SAR image. SAR observations do not depend on weather (clouds) and sunshine, which allows showing illegal discharges that most frequently appear during night. SAR can also survey storms areas, where accident risks are increased. An example of image is shown in figure 1 (Courtesy by ESA, JRC and INGV). The image | + | SAR (Synthetic Aperture Radar) seems to be one of the most suitable instruments to the detection of slicks since slicks damp strongly short waves measured by SAR and oil spills appear as a dark patch on the SAR image. SAR observations do not depend on weather (clouds) and sunshine, which allows showing illegal discharges that most frequently appear during night. SAR can also survey storms areas, where accident risks are increased. An example of image is shown in figure 1 (Courtesy by ESA, JRC and INGV). The image refers to the Lebanese oil spill accident of July 2006. [[image:uno.gif|thumb|800px|centre|Figure 1. ASAR image at 7:51 GMT 6 Aug 2006. Courtesy of ESA, INGV and JRC.]] |
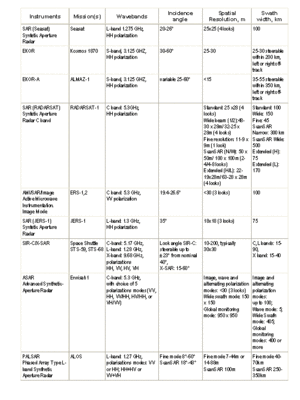
The most suitable SAR radar configuration for oil pollution study is C-band radar frequency with VV polarization, with a 20 to 45° incident angle. This is the case for [http://it.wikipedia.org/wiki/ERS ERS] , [http://en.wikipedia.org/wiki/RADARSAT-1 RADARSAT] and [http://en.wikipedia.org/wiki/Envisat Envisat] http://envisat.esa.int/satellites. ERS SAR imagery are additionally useful for oil spill monitoring due to ability to recover the surface wind characteristics which are very important for oil weathering. Wind direction can be retrieval from an orientation of the organized structures in the atmospheric boundary layer (convective rolls) that clearly manifest themselves in the SAR images, as well as can be estimated from backscatter variation near the islands and capes. | The most suitable SAR radar configuration for oil pollution study is C-band radar frequency with VV polarization, with a 20 to 45° incident angle. This is the case for [http://it.wikipedia.org/wiki/ERS ERS] , [http://en.wikipedia.org/wiki/RADARSAT-1 RADARSAT] and [http://en.wikipedia.org/wiki/Envisat Envisat] http://envisat.esa.int/satellites. ERS SAR imagery are additionally useful for oil spill monitoring due to ability to recover the surface wind characteristics which are very important for oil weathering. Wind direction can be retrieval from an orientation of the organized structures in the atmospheric boundary layer (convective rolls) that clearly manifest themselves in the SAR images, as well as can be estimated from backscatter variation near the islands and capes. | ||
Revision as of 12:44, 13 June 2007
The ability to remotely detect and monitor oil spills at sea is becoming increasingly important due to the threat that such pollution poses to marine wildlife and the ecosystem. As the demand for oil based products increases, shipping routes will consequently become much busier, the likelihood of slicks occurring is increasing. If applied correctly, remote sensing can act as an important monitoring tool. It can provide early detection of slicks, provide size estimates, and help predict the movement of the slick and possibly the nature of the oil. This information will be invaluable in aiding clean up operations, and consequently help save wildlife and the balance of the local ecosystem, provide damage assessment and help to identify the polluters.
Remote sensing allows to detect and monitor oil spills. Typical platforms are satellites and aircrafts. In respect to the type of energy resources it must be differentiated between two techniques - passive and - active systems.
The passive systems make use of sensors that detect the reflected or emitted electro-magnetic radiation from natural sources (Visible spectrum, reflective Infrared and Thermal Infrared). The active systems detect reflected responses from objects that are irradiated from artificially-generated sources, such as radar or laser systems
Due to the nature of an oil slick a satellite remote sensing platform is required to have the following:
- High temporal resolution, due to the changing nature of the oil and its immediate threat to ecosystem,
- The ability to image a given area regardless of cloud cover and prevailing weather conditions (even time of day),
- High spatial resolution, to identify individual small oil patches (windrows),
- Wide spectral resolution, as the position and width of the spectral band is important in distinguishing the oil from the adjacent water.
At the present, no existing remote sensing platform, in space or airborne, can meet all of the above requirements. Techniques are described in http://cearac.poi.dvo.ru/en/background/techniques/
There are certain times when visual techniques and optical satellite image are unsuitable for mapping of oil spill; it is in these cases where radar remote sensing is required. These situations include spills covering vast areas of the marine environment, and when the oil cannot be seen or discriminated against the background. The discrimination of oil in these circumstances presents several unique problems. The remotely sensed data collected in these situations often provide complex signatures, which must be deciphered in order to locate the spilled oil.
SAR (Synthetic Aperture Radar) seems to be one of the most suitable instruments to the detection of slicks since slicks damp strongly short waves measured by SAR and oil spills appear as a dark patch on the SAR image. SAR observations do not depend on weather (clouds) and sunshine, which allows showing illegal discharges that most frequently appear during night. SAR can also survey storms areas, where accident risks are increased. An example of image is shown in figure 1 (Courtesy by ESA, JRC and INGV). The image refers to the Lebanese oil spill accident of July 2006.The most suitable SAR radar configuration for oil pollution study is C-band radar frequency with VV polarization, with a 20 to 45° incident angle. This is the case for ERS , RADARSAT and Envisat http://envisat.esa.int/satellites. ERS SAR imagery are additionally useful for oil spill monitoring due to ability to recover the surface wind characteristics which are very important for oil weathering. Wind direction can be retrieval from an orientation of the organized structures in the atmospheric boundary layer (convective rolls) that clearly manifest themselves in the SAR images, as well as can be estimated from backscatter variation near the islands and capes.
.The spatial coverage of the SAR imagery is adapted to pollution survey (100 x 100 km for ERS-1 and ERS-2; 300 x 300 km for RADARSAT, and from 100x 100 km to 405 x 405 km (wide swath) for ASAR Envisat). A problem is the satellite coverage frequency (35 days for ERS), but now RADARSAT SAR and Envisat ASAR allow covering every 2-3 days for accident cases.
Satellite
Remote-Sensing Satellites are characterised by their altitude, orbit and sensor. They cover vast areas and have a specific repetition time (usually several days up to 16 days). A list of earth observation satellite is given in http://en.wikipedia.org/wiki/List_of_Earth_observation_satellites.
.Airborne oil spill monitoring
Airborne oil spill monitoring has become a global concern during the last three decades. Currently there are a multitude of specialized airborne remote sensing systems all over the world, which are operated for this purpose, especially for the deterrence of potential polluters and the support of oil spill clean-up activities. In the 1970s and 1980s the main effort has been directed towards developing sensors with enhanced spill monitoring capabilities which explains the large number of existing well-established oil spill remote sensors like infrared/ultraviolet line scanners, microwave radiometers, laser fluorosensors, and X-band radar systems. Recently, more attention has been paid to the automated processing of remotely sensed oil spill data acquired by airborne multi-sensor platforms in terms of data analysis and fusion. Using satellite platforms to monitor oil slicks is more cost effective than applying airborne monitoring techniques but airborne monitoring can be complementary to satellite. Existing users are positive to a combined satellite and airborne monitoring service.
External links
http://earth1.esrin.esa.it/ew/ http://esapub.esa.int/eoq/eoq44/lichten.htm http://www.nrsc.no/COASTMON/Products/oilspill.html http://seawifs.gsfc.nasa.gov/OCEAN_PLANET/HTML/peril_oil_pollution.html http://ramses.esrin.esa.it/ http://www.itopf.com/stats.html http://response.restoration.noaa.gov/spotlight/spotlight.html http://www.swan.ac.uk/empress/index.htm http://www.swan.ac.uk/empress/oil/oil.htm http://www.nrsc.no/COASTMON/Products/oilspill.html http://www.nersc.no/HABILE/ http://www-cenerg.cma.fr/eng/tele/cseas/welcome.html http://desima.jrc.it/ http://www.nersc.no/Projects/dismar/ http://intelligence.jrc.cec.eu.int/ http://www.iceonline.net/home/garryl/oils/esoilspl.html http://www.geog.ucl.ac.uk/~salmond/essay.html http://oils.gpa.unep.org/ http://www.memac-rsa.org/ http://www.satobsys.co.uk/CSeas/ http://www.unep-wcmc.org/latenews/emergency/ http://marsais.ucc.ie/ http://oceanides.jrc.cec.eu.int/ http://response.restoration.noaa.gov/ http://www.ropme.net/default.asp http://www.eia.doe.gov/emeu/cabs/pgulf.html http://www.gisdevelopment.net/application/miscellaneous/misc027.htm
Please note that others may also have edited the contents of this article.
|
[[Category:Articles by {{{AuthorFullName}}}]]


