Difference between revisions of "Coastal observation systems"
(→Stationary in situ Observations: Wadden Sea Poles) |
(→Stationary in situ Observations: Wadden Sea Poles) |
||
| Line 78: | Line 78: | ||
=== Stationary in situ Observations: Wadden Sea Poles === | === Stationary in situ Observations: Wadden Sea Poles === | ||
<p> | <p> | ||
| − | {| style ="margin-left: | + | {| style ="margin-left: 5px" align="right" style="text-align:center; font-size:85%" |
|[[Image:A Wadden Sea Pole.jpg|450px]] | |[[Image:A Wadden Sea Pole.jpg|450px]] | ||
|- | |- | ||
Revision as of 11:20, 30 August 2012
Contents
The need for observations
There are a series of objectives why we need to have observational data: to control the outcome of (governmental) monitoring programmes, the obtain data for modelling exercises and to enable scientific analyses of field data to improve our understanding of the marine environment, e.g. to enable assessments of the environmental quality and long term changes.
To observe our marine environment several options are nowadays available: FerryBoxes, Poles in shallow waters like the Wadden Sea, Gliders, regular ship cruises for vertical resolution of parameters, wave rider buoys, shore based radar like HF and XF, and remote sensing from satellites. A combination of different approaches enables coverage on different time and spatial scales. Several of these observational techniques will be presented through examples of actual measurements. Examples are taken from the COSYNA integrated observation system developed by HZG together with other German research institutes during the last years.
FerryBox
Transectional and stationary in situ observations
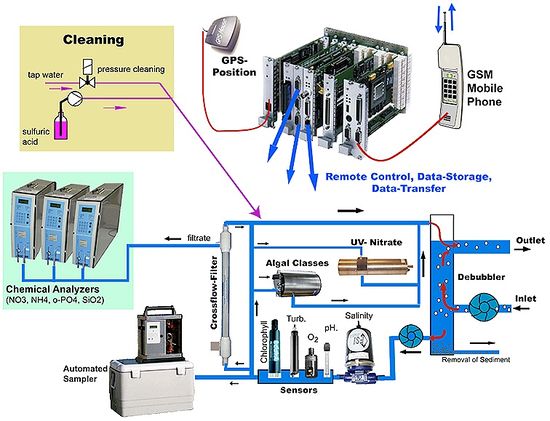
The FerryBox is an automated measuring system used for the measurement of physical and biogeochemical parameters in surface waters. It is mounted on ‘ships of opportunity’, such as ferries or container ships, on their regular routes across the North Sea or on shore-based installations (Helgoland Island, Cuxhaven, and FINO3). Water is pumped from a subsurface inlet into the measuring circuit of multiple sensors (see Diagram)). An important feature is the regular automated cleaning and antifouling procedure of the box. All processes can be controlled remotely via the telemetry line from land. Data are transmitted and made available after each transect via the Internet. Due to the automated biogeochemical instrumentation of the FerryBoxes the regular transects give detailed insights into the processes and are a main source for data assimilation into models.
| Schematic design of the FerryBox flow-through and data system with special features for unattended operation (automatic cleaning system). |
Parameters measured are a.o. water temperature, conductivity, turbidity, oxygen, pH, and chlorophyll-a-fluorescence. Water samples for further lab analysis are taken. On some routes measured additionally are: Algal classes and nutrients (ammonia, nitrite/nitrate, o-phosphate, silicate). In the near future sensors for pCO2, alkalinity, a flow-cytometer and an instrument to measure geneprobes to detect specific species can be installed in some FerryBoxes.
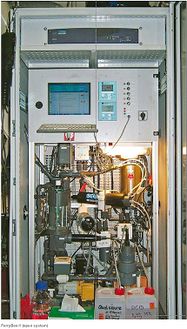
|
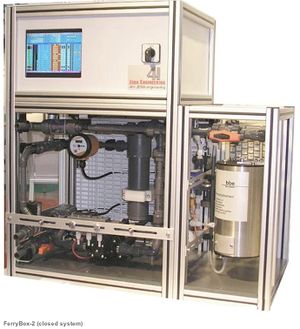
|
| Ferry Box (open system) | Ferry Box (closed system) |
| Pictures of commercial available FerryBoxes | |
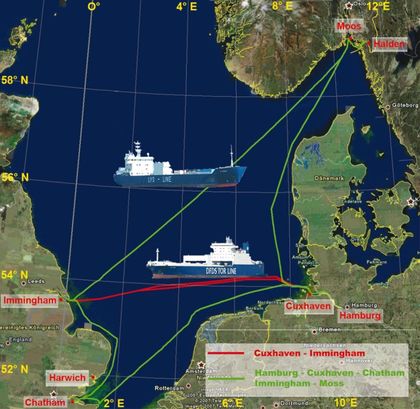
Water quality data of surface waters on 3 ship routes in a high frequency (daily, 2-daily, weekly - depending on route). Due to some long-distance routes to England and Norway these data are the link between the German Bight and the North Sea.
| Current FerryBox transects in the southern North Sea operated by HZG: Route Cuxhaven - Immingham: RoRo-ship TorDania, Route Gemany - England - Norway: cargo ship LysBris. |
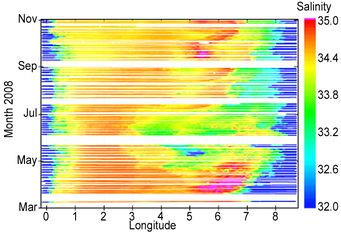
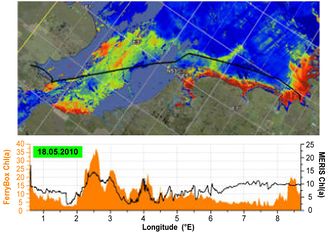
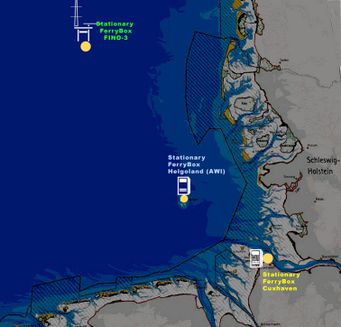
The FerryBox technology developed by HZG works so well - especially due to the integrated anti-fouling system - that it is used not only on ships but as well at any station that has enough power to run the necessary pumps. Therefore, these 'stationary FerryBox systems' have been installed in the stations 'Cuxhaven' and 'Fino-3'. Our partner AWI installed one FerryBox on their shore station at Helgoland. The design and the parameters are the same as on the ship-borne FerryBox systems. The pictures bellow show salinity data from a transect in the southern North Sea between Germany (Cuxhaven) and the UK (Immingham) during the period from March till November 2008 and a graph showing a single transect and the concomitant remote sensing picture of the southern North Sea for the parameter chlorophyll-a.
| Salinity data from a transect in the southern North Sea between Germany (Cuxhaven) and the UK (Immingham) from March till November 2008. |
Single transect and the concomitant remote sensing picture of chlorophyll-a in the southern North Sea. |
Apart from FerryBoxes on board ships of opportunity the possibility exists to install FerryBoxes stationery at selected locations. Currently installations at three locations along the river Elbe (Cuxhaven), on the island of Helgoland and on a research platform (FINO-3) are in operation (see map).
| Map indicationg the locations where FerryBoxes are installed with yellow dots. |
Stationary in situ Observations: Wadden Sea Poles
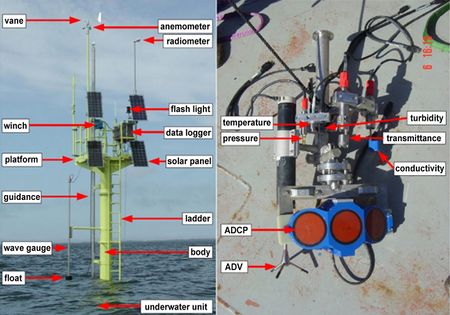
|
| A picture of a Wadden Sea Pole the different censors are indicated. |
High-frequent water quality data are a prerequisite for an assessment of the substance exchange between North Sea and Wadden Sea.
Parameters measured are pressure (depth), water temperature, conductivity, current velocity/direction, turbidity, chlorophyll-a-fluorescence, photosynthetic active radiation, pH-value, oxygen, and meteorology (pressure, temperature, wind speed, humidity, irradiation and precipitation). An example of such as complete pole is shown in the diagram.
