Eutrophication in coastal environments
Contents
Introduction
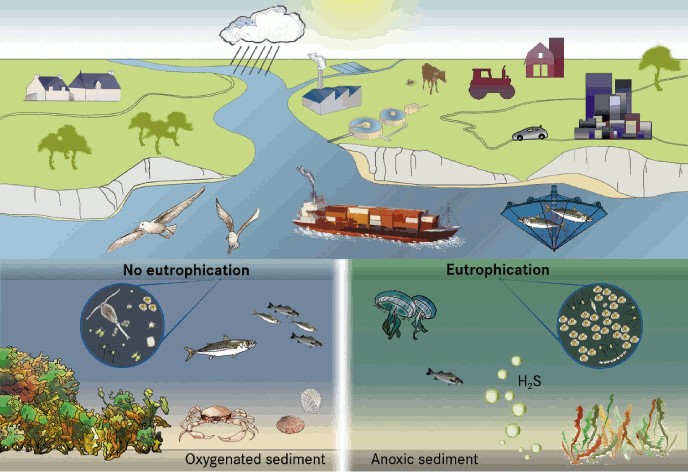
Eutrophication is the excessive loading of water with nutrients, dissolved substances containing the elements P, N and Si needed by organisms for growth. Nutrient loading of coastal waters is caused by increased inputs of nutrients from activities in the upstream catchment, atmospheric deposition and local effluents. The negative effects of eutrophication on marine ecosystems include: algal blooms (Fig.1), increased growth of macroalgae, increased sedimentation and oxygen consumption, oxygen depletion in lower water layers and, sometimes, mortality of benthic animals and fish. Mitigation of the negative effects of eutrophication requires reduction of nutrient inputs and an ecosystem-based management strategy. The bio-geochemical cycles of nutrients are discussed in the article Continental Nutrient Sources and Nutrient Transformation.
Eutrophication as a global-scale issue
Biomass production in coastal waters - the conversion of light and carbon dioxide into living organic matter – is mainly limited by availability of nitrogen and/or phosphorus (light is a limiting factor in turbid zones). Eutrophication leads to increased biomass production that disturbs the natural ecological balance in the coastal zone, with serious detrimental consequences for biodiversity, ecosystem resilience, recreational activities and fisheries. The anthropogenic alteration of the nitrogen and phosphorus cycles takes place at a global scale and is considered as one of the biggest threats to marine ecosystem health for decades[1] [2] [3]. Coastal regions throughout the world, including Europe, are affected by eutrophication. It is usually treated in science and management as a local or regional phenomenon, but eutrophication is actually, like climate change, a global issue.
The meaning of eutrophication
- Eutrophication
- “eu” = “well” or “good”
- “trope” = “nourishment”
But is “eutrophication” good?
- In general: NO … it is actually ”bad” …
- Too many nutrients in the wrong places may cause problems and result in changes in structure, function and stability of the marine ecosystems.
- Eutrophication is ”too much of a good thing”
Effects of Eutrophication
The different processes and possible effects of coastal eutrophication on the marine ecosystem are well documented[4] [5] [6] (Fig.2):
- toxic algal blooms
- reduced depth distribution of submerged aquatic vegetation
- increased growth of nuisance macroalgae
- increased sedimentation
- increased oxygen consumption
- oxygen depletion in lower water layers
- sometimes dead benthic animals and fish.

Eutrophication causes structural changes throughout the marine ecosystem and reduces ecosystem resilience.
Eutrophication issues are often divided into three groups [8]:
- Causative factors: inputs, elevated nutrient concentrations, Redfield ratio changes
- Direct effects on primary producers - phytoplankton and submerged aquatic vegetation
- Indirect effects (secondary effects) related to zooplankton, fish and ínvertebrate benthic fauna (animals living on and in the seabed).
The following responses to increased nutrient inputs are observed in the Baltic Sea [8]:
- Increased phytoplankton primary production, which increases biomass, which decreases light penetration through the water column. Reduced light penetration reduces the depth at which macroalgae and seagrasses can grow.
- Increased nutrient inputs generally entail a change in ratio between dissolved nitrogen and phosphorus in the water, the DIN:DIP ratio. Optimal is 16:1 – called the Redfield ratio. A significantly lower ratio can cause nitrogen limitation, whereas a higher ratio can lead to phosphorus limitation of phytoplankton primary production. Species that are less sensitive for their growth to the optimal DIN:DIP ratio outcompete more sensitive species.
- A gradual change of (pelagic ecosystems) towards[8]:
- Increased planktonic primary production compared to benthic production
- Dominance of microbial food webs over linear planktonic food chains
- Dominance of non-siliceous phytoplankton species over diatom species
- Dominance of gelatinous zooplankton (jellyfish) over crustacean zooplankton
Some effects are discussed more in detail below.
Phytoplankton
Phytoplankton is at the base of pelagic food webs in aquatic systems. As the turnover time is less that a few days, it respond rapidly to nutrient concentration changes. Changes are observed in:
- Primary production
- Biomass (chlorophyll-a concentration, or carbon biomass)
- Bloom frequency
Submerged aquatic vegetation
Submerged aquatic vegetation is affected by eutrophication through[8]:
- Reduced light penetration and shadowing effects from phytoplankton, which modifies the depth distribution, biomass, composition and species diversity and leads to a decline of seagrass meadows and perennial macroalgae, which are important nursery areas for coastal fish populations;
- Increased growth of filamentous and short lived nuisance macroalgae at the cost of long lived species, which leads to a change in structure of macroalgae communities with reduced diversity.
Oxygen depletion
Oxygen depletion, or hypoxia, is a commonly observed phenomenon low in the water column [8]. This effect can be episodic, occuring persistently, seasonally (most common in summer/autumn), or episodically in the coastal zone.
- Lethality of low oxygen concentrations depends on the species. Fish and crustaceans have higher oxygen requirements; other species have lower requirements.
- Hypoxic and anoxic (no oxygen) conditions may results in formation and release of hydrogen sulphide (H2S), which is lethal to many organisms.
- Anoxic periods cause the release of phophorus from sediments. Dissolved inorganic phosphorus (DIP) and ammonium are released under hypoxic conditions. DIP and ammonium enhance algal blooms.
Invertebrate benthic fauna
Invertebrate benthic fauna can cope with oxygen depletion to varying degrees (days – month) [8]. If O2 drops to zero and H2S is released all organisms are killed immediately. Mobile benthic invertebrates in sediment move to the surface when O2 decreases - catches of fish and crustaceans are increased under such conditions. It is difficult to predict when animals will return after anoxic episodes. The size of the affected area plays a role: small areas are recolonised more quickly than larger areas.
Climate change
Global warming is predicted to increase hypoxia conditions. A 4 degree temperature increase is projected to result in a doubling of hypoxia in some parts of North Sea. For example, eelgrass is very sensitive to low oxygen concentrations, and dies off under these conditions (often in combination with high temperatures).
By burying carbon (and nutrients) in sediments, the marine environment contributes to mitigating climate change. In ocean regions where primary production is nutrient-limited, eutrophication will enhance carbon storage in marine sediments. Carbon is also stored in the oceans by dissolution of CO2 as carbonic acide. However, the resulting ocean acidification is a threat for many marine organisms.
Eutrophication monitoring
For this topic the reader is referred to the following articles:
- Monitoring the water quality of coastal waters with automatic equipment
- Real-time algae monitoring
- Optical measurements in coastal waters
- Differentiation of major algal groups by optical absorption signatures
- Sampling tools for the marine environment
- FerryBox - Continuous and automatic water quality observations along transects
Eutrophication modelling
Information on eutrophication modelling can be found in the articles Coupled hydrodynamic - water quality - ecological modelling and Modelling marine and coastal eutrophication.
European Regional Seas
Within Europe, regional seas such as the Baltic Sea, the Wadden Sea, the Black Sea and the Mediterranean Sea suffer currently strong adverse impacts of eutrophication, which will be further exacerbated by climate change. The main source of nitrogen to European coastal waters are agricultural effluents discharged into the sea via rivers. Another important source is atmospheric deposition of nitrogen that results from ammonia evaporation in animal husbandry and from fossil fuel combustion in traffic, industry and households[9]. For phosphorus, the major sources are treated and untreated discharges to the sea from households and industry as well as soil erosion[9].
Baltic Sea
Causes of eutrophication
Anthropogenic nutrient enrichment[8][10] in the Baltic Sea is caused by input of nutrients from:
- Point sources such as effluents of sewage treatment plants and industries
- Atmospheric deposition in the sea
- Rivers contaminated by activities in the catchment area such as point sources, agricultural effluents, atmospheric deposition on land, in addition to background releases from natural erosion and leakage of nutrients from areas without much human activities.
Waterborne inputs are from agriculture forestry, scattered dwellings, municipalities, industries, natural background losses.
Airborne nitrogen inputs are from:
- Emission of nitrogen oxides from road transport, energy combustion, shipping
- Ammonia emissions, mostly from agriculture
- Distant sources
The main source of nitrogen inputs in the Baltic Sea is from agricultural effluents via rivers caused by:
- Soil cultivation
- Fertiliser use
- Production of of manure
- Intensive and uncontrolled agriculture
Impact of eutrophication
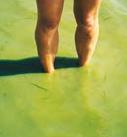
Excessive phytoplankton blooms are a major problem – especially of blue-green algae. Summertime algal blooms occur commonly in most parts of the Gulf of Finland, the Gulf of Riga, the Baltic Proper and south-western parts of the Baltic Sea. Particular problems are:
- bathing people can hardly see their feet (Fig.3)
- blue-green algae potentially toxic to humans and animals
- decaying large mats of drifting algae stranded along the shores
Solutions
The following steps have been suggested[8]
- Establish overall goals and target values
- Implement relevant measures directly linked to fulfillment of these overall goals and targets
- Carry out monitoring
- Conduct assessments
- Evaluate whether the goals and targets have been fulfilled or not
Main drivers
- EU directives [11]
- Decisions and recommendations adopted by HELCOM [12][13][14]
- National action plans
Wadden Sea
In contrast to the enclosed nature of the Baltic, the Wadden Sea is a very open system. Strong tides exchange water and particulate matter between the Wadden Sea and the North Sea.
Causes
Human eutrophication drivers in the Wadden Sea are to a large extent similar as in the Baltic including direct inputs, atmospheric deposition and riverine inputs. But some notable differences exist:
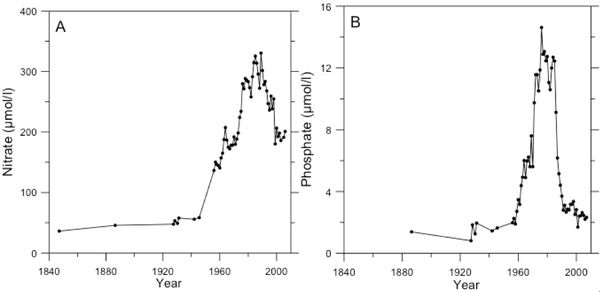
- Riverine input (Fig.4): both local and distant riverine sources drive the Wadden Sea eutrophication. Residual currents in the North Sea transport nutrients from large rivers outside of the Wadden Sea like the river Rhine and Maas into the Wadden Sea
- Direct input: This used to be a large local problem in the 1970’s but solved in the 1980’s
- Input from the North Sea: This source of organic matter and nutrients used to be one of the drivers of the high fertility of the Wadden Sea but amplified eutrophication problems since the 1970’s due to increased North Sea nutrient concentrations.
Agriculture is the main driver of surplus nitrogen and phosphorus [15].

Impact of eutrophication
Eutrophication problems were recognized in the 1970’s and reached a maximum in the 1980’s and 1990’s. Political decisions in the 1970`s and 1980’s lead to a marked decrease in nutrient input and eutrophication problems [17][18][19]. The following problems were encountered
- Excessive phytoplankton blooms.
- Shifts in phytoplankton composition towards the dominance of the non-silicified phytoplankter Phaeocystis pouchetii and foam formation on beaches [20]
- Decrease in seagrass
- Increase in green macroalgae
- Black spots: large anoxic areas on tidal flats
Solutions
A first step to solve the Wadden Sea/North Sea eutrophication problem was the decision in 1990 at the International Conference on the Protection of the North Sea in London to reduce the nutrient loads to 50% of the 1985-1987 levels [21]. Especially the reduction of N loads appeared to be problematic but about 30 years later, riverine loads into the Wadden Sea indeed are indeed about 50% lower (Fig.4). This led to a reduction in phytoplankton biomass, a reduction in green macroalgae coverage and in the northern Wadden Sea to a recovery of seagrass [22][23].
Main Drivers
- European Directives
- Decisions and recommendations adopted by OSPAR [24]
- Trilateral Wadden Sea Plan [25]
- EC Urban Waster Water Treatment Directive
- EC Nitrates Directive
- EU Water Framework Directive
- Marine Strategy Directive
Related articles
Related articles are listed in Eutrophication.
External link
Wikipedia Eutrophication article
Further Reading
The Biology and Ecology of Seagrasses (ed. Brant W. Touchette), 2007. Journal of Experimental Marine Biology and Ecology, Volume 350, Issues 1-2, Pages 1-260 (9 November 2007), . http://www.sciencedirect.com/science/journal/00220981
References
- ↑ Ryther and Dunstan, 1971
- ↑ Nixon, S. W. (1995) Coastal marine eutrophication: a definition, social causes, and future concerns. Ophelia, 41, 199–219.[ISI]
- ↑ Bachmann, R. W., Cloern, J. E., Heckey, R. E. et al. (eds) (2006) Eutrophication of freshwater and marine ecosystems. Limnol. Oceanogr., 51 (1, part 2), 351–800.
- ↑ Cloern, J. (2001) Our evolving conceptual model of the coastal eutrophication problem. Mar. Ecol. Prog. Ser., 210, 223–253.[ISI]
- ↑ Conley, D. J., Markager, S., Andersen, J. et al. (2002) Coastal eutrophication and the Danish National Aquatic Monitoring and Assessment Program. Estuaries, 25, 706–719.[Medline]
- ↑ Rönnberg, C. and Bonsdorff, E. (2004) Baltic Sea eutrophication: area-specific ecological consequences. Hydrobiologia, 514, 227–241.[CrossRef][ISI]
- ↑ OSPAR 2010. Quality Status Report.
- ↑ 8.0 8.1 8.2 8.3 8.4 8.5 8.6 8.7 HELCOM (2006) Andersen, J (DHI) and Pawlak, J (MEC), Nutrients and Eutrophication in the Baltic Sea – Effects, Causes, Solutions. Baltic Sea Parliamentary Conference.[1]
- ↑ 9.0 9.1 Ærtebjerg, G. et al., Eutrophication in Europe’s Coastal Waters. Topic Report No 7/2001. European Environment Agency. [2]
- ↑ http://www2.dmu.dk/1_Viden/2_Miljoe-tilstand/3_vand/4_eutrophication/definition.htm Nutrients and Eutrophication in Danish Marine Waters
- ↑ http://www.EEA.europa.eu European Environment Agency
- ↑ http://www.HELCOM.fi HELCOM
- ↑ http://www.BSPC.net Baltic Sea Parlimentary Conference
- ↑ http://www.BONUSportal.org BONUS] for the future of the Baltic Sea
- ↑ https://www.umweltbundesamt.de/sites/default/files/medien/378/publikationen/reaktiver_stickstoff_in_deutschland_0.pdf
- ↑ van Bennekom AJ, Wetsteijn FJ (1990) The winter distribution of nutrients in the southern bight of the North Sea (1961-1978) and in the estuaries of the Scheldt and the Rhine/Meuse. Neth J Sea Res 25:75- 87
- ↑ Van Beusekom JEE, Fock H, de Jong F, Diel-Christiansen S, Christiansen B (2001) Wadden Sea specific eutrophication criteria. Wadden Sea Ecosystem 14:1-115
- ↑ De Jong F (2007) Marine eutrophication in perspective: on the relevance of ecology for environmental policy. Springer Science & Business Media
- ↑ http://qsr.waddensea-worldheritage.org/reports/introduction
- ↑ http://www.vliz.be/projects/iseca/images/dels/Phaeocystis%20and%20foam%20on%20the%20beach.pdf
- ↑ https://www.ospar.org/site/assets/files/1239/declarations_compilation_1995.pdf
- ↑ http://qsr.waddensea-worldheritage.org/reports/eutrophication
- ↑ http://qsr.waddensea-worldheritage.org/reports/seagrass
- ↑ http:// OSPAR.ORG
- ↑ http://www.waddensea-secretariat.org/management/wadden-sea-plan-2010
Please note that others may also have edited the contents of this article.
|

