File list
This special page shows all uploaded files.
| Date | Name | Thumbnail | Size | Description | Versions |
|---|---|---|---|---|---|
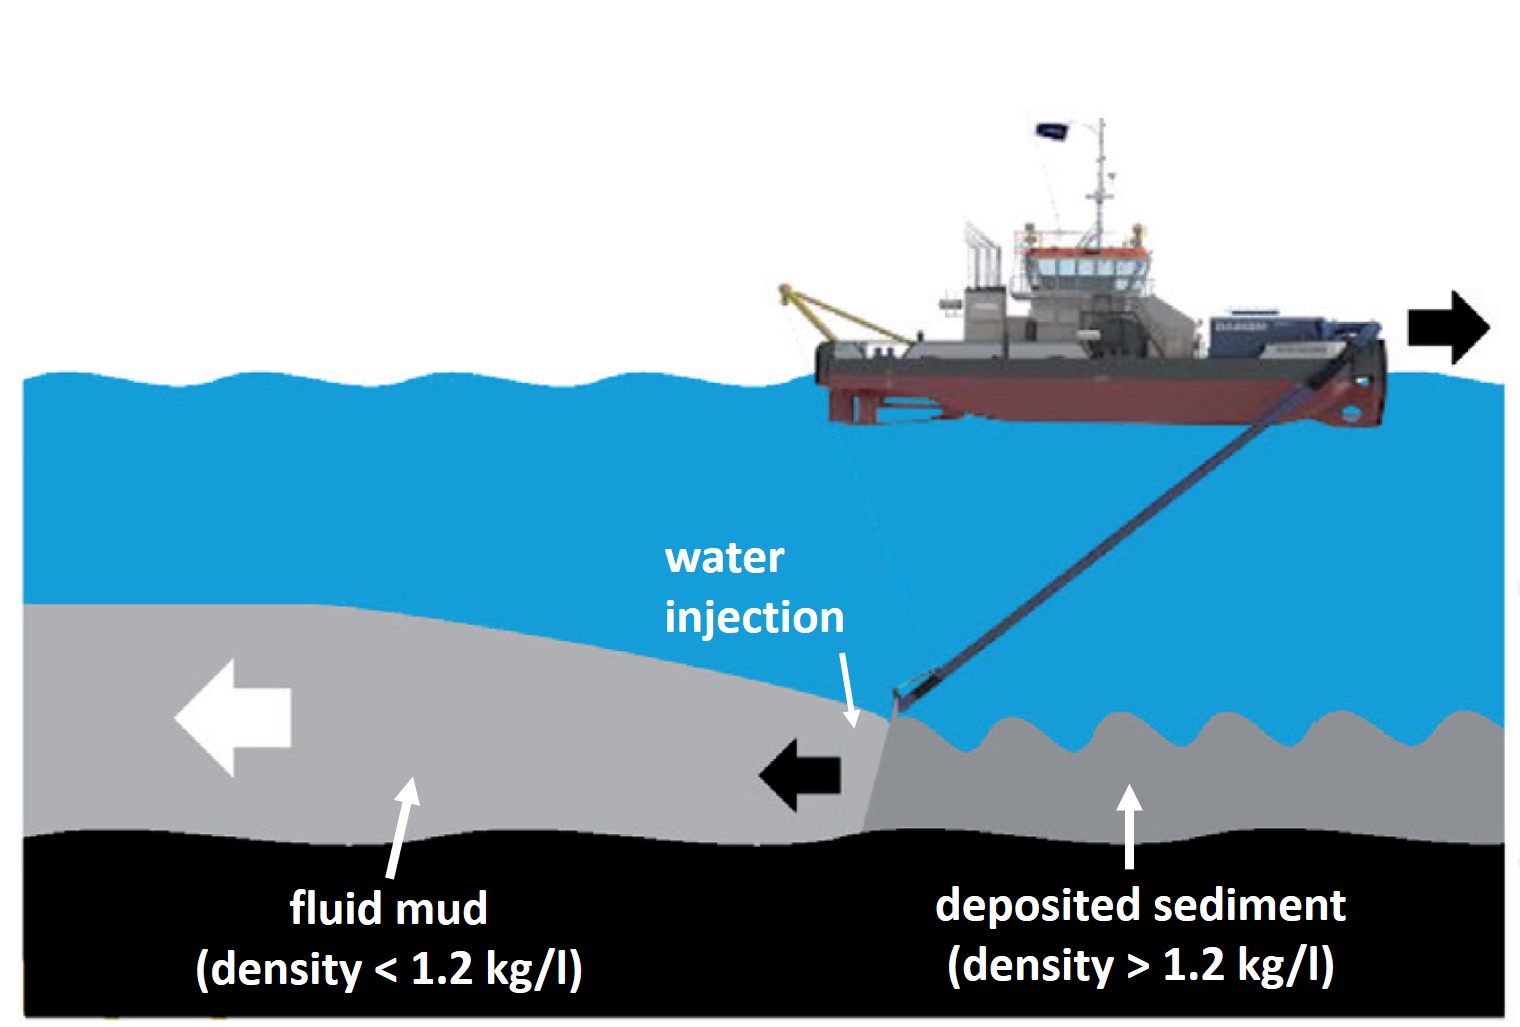
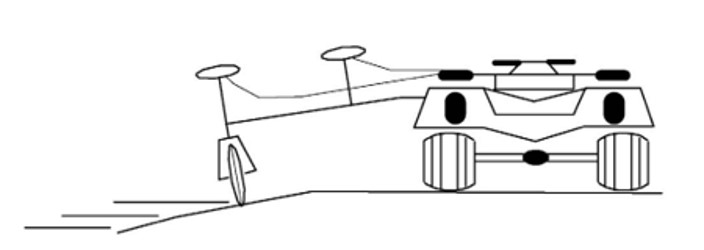
| 12:19, 19 February 2022 | WaterInjectionDredging.jpg (file) |  |
116 KB | Cartoon of water injection dredging. | 1 |
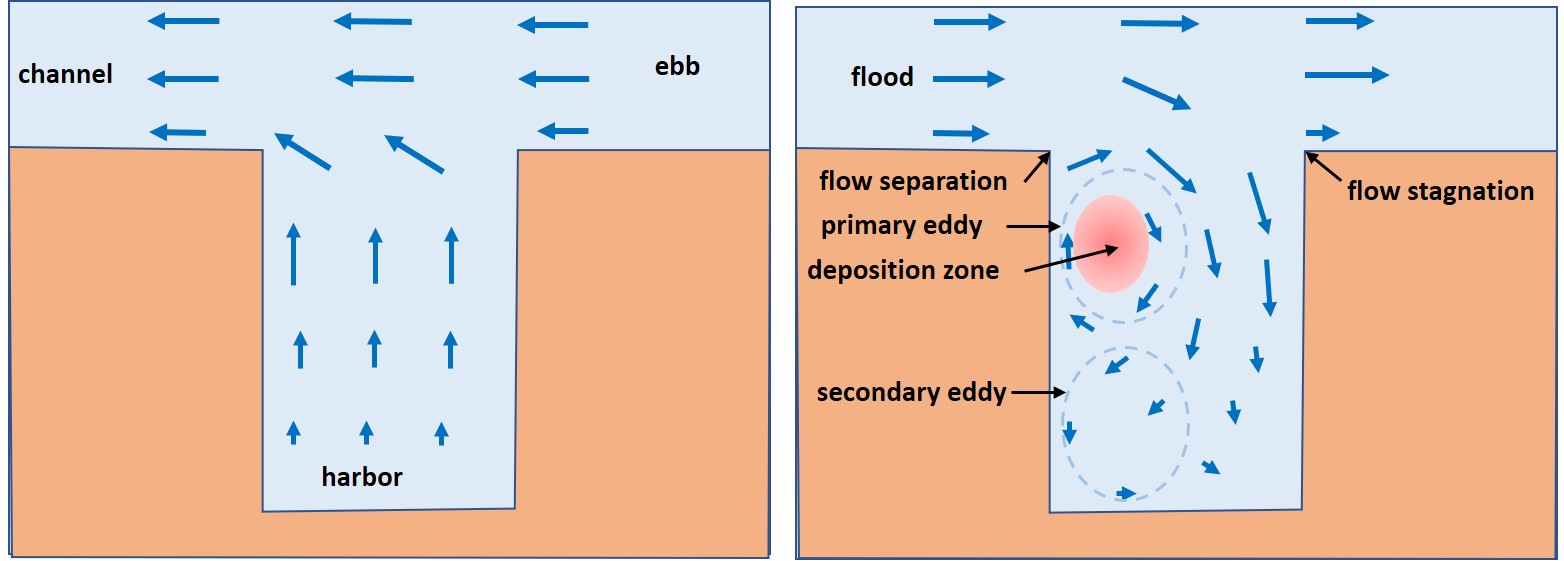
| 18:06, 18 February 2022 | HarborEddy.jpg (file) |  |
91 KB | Horizontal flow pattern at the entrance of a tidal harbor in the absence of flow adaptation constructions. Left panel: Ebb. Right panel: Flood. | 1 |
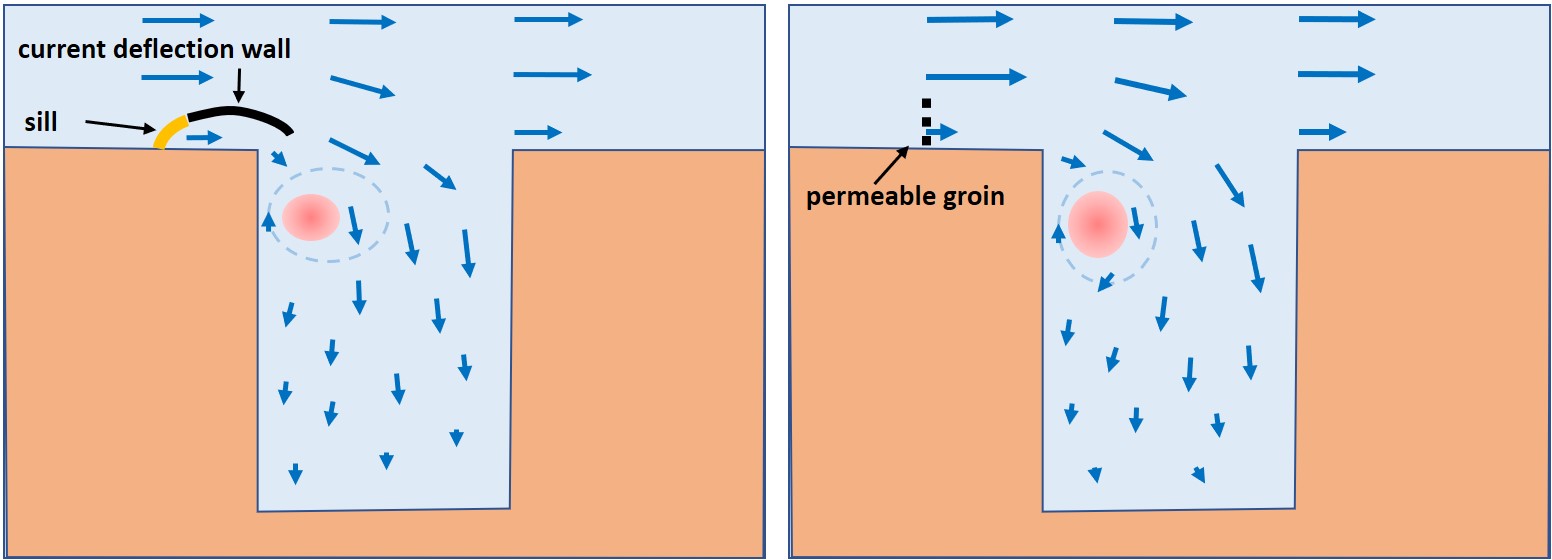
| 17:58, 18 February 2022 | HarborEddyWeakening.jpg (file) |  |
81 KB | Schematic pictures of flow adaptation constructions for counteracting the formation of horizontal exchange flows at the harbor entrance during flood. Left panel: Sill and current deflection wall. Right panel: Upstream permeable groin. | 1 |
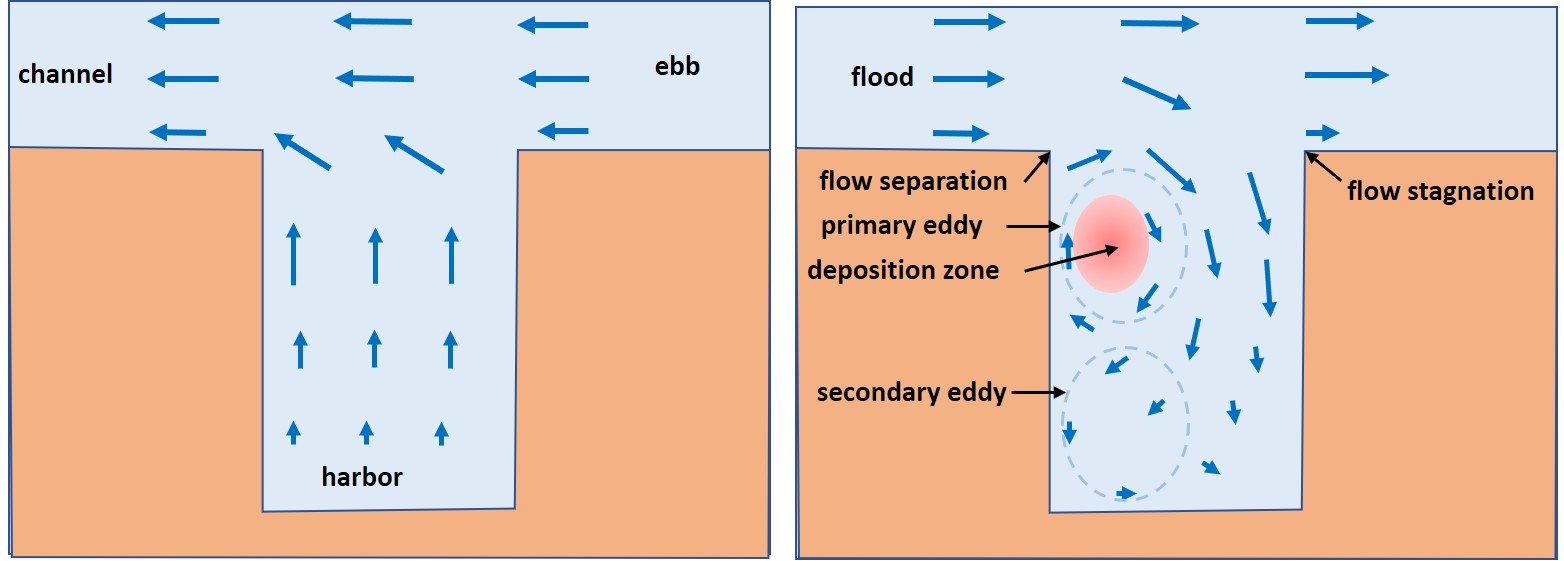
| 17:57, 18 February 2022 | HarborEddy.jpg .jpg (file) |  |
91 KB | Horizontal flow pattern at the entrance of a tidal harbor in the absence of flow adaptation constructions. Left panel: Ebb. Right panel: Flood. | 1 |
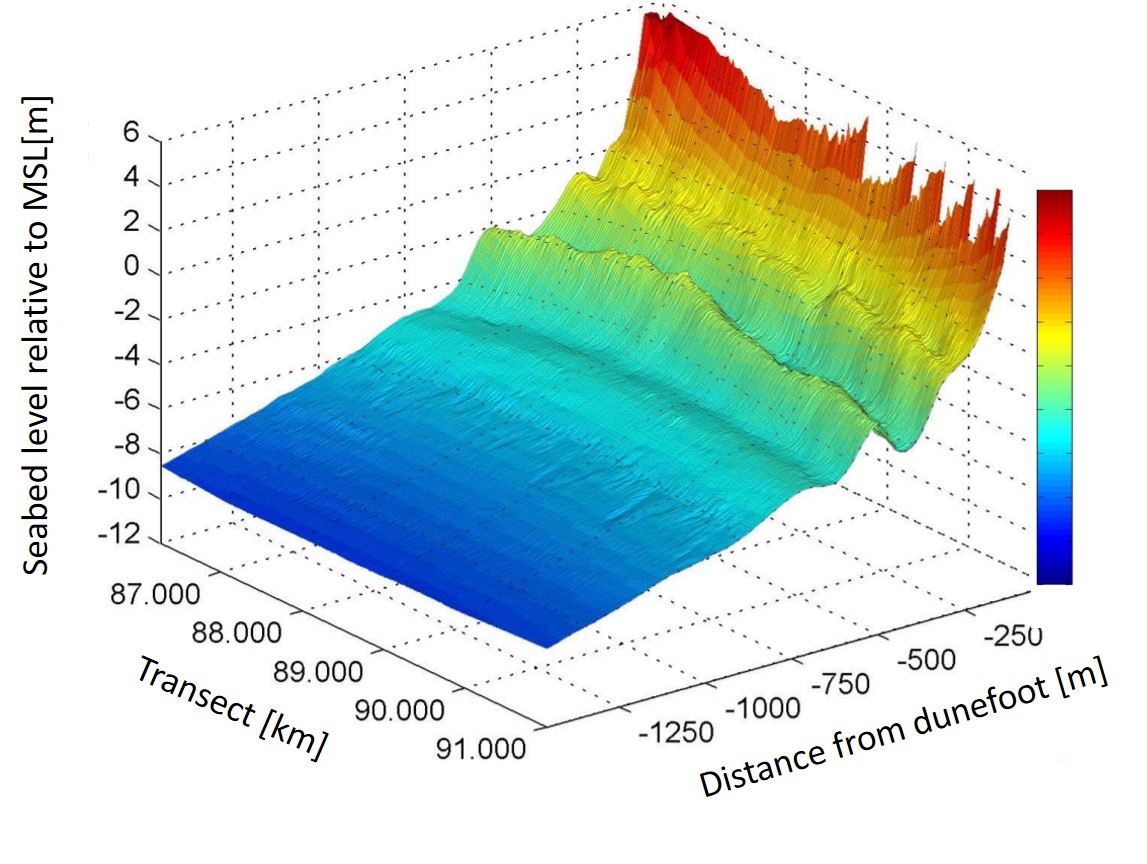
| 18:25, 6 February 2022 | ShorefaceBathymetryKatwijk.jpg (file) |  |
185 KB | Bathymetry of the shoreface at the Dutch coast (Katwijk, 11 August 1998) displaying 3 nearshore sandbars. Image credit E.J. Biegel. | 1 |
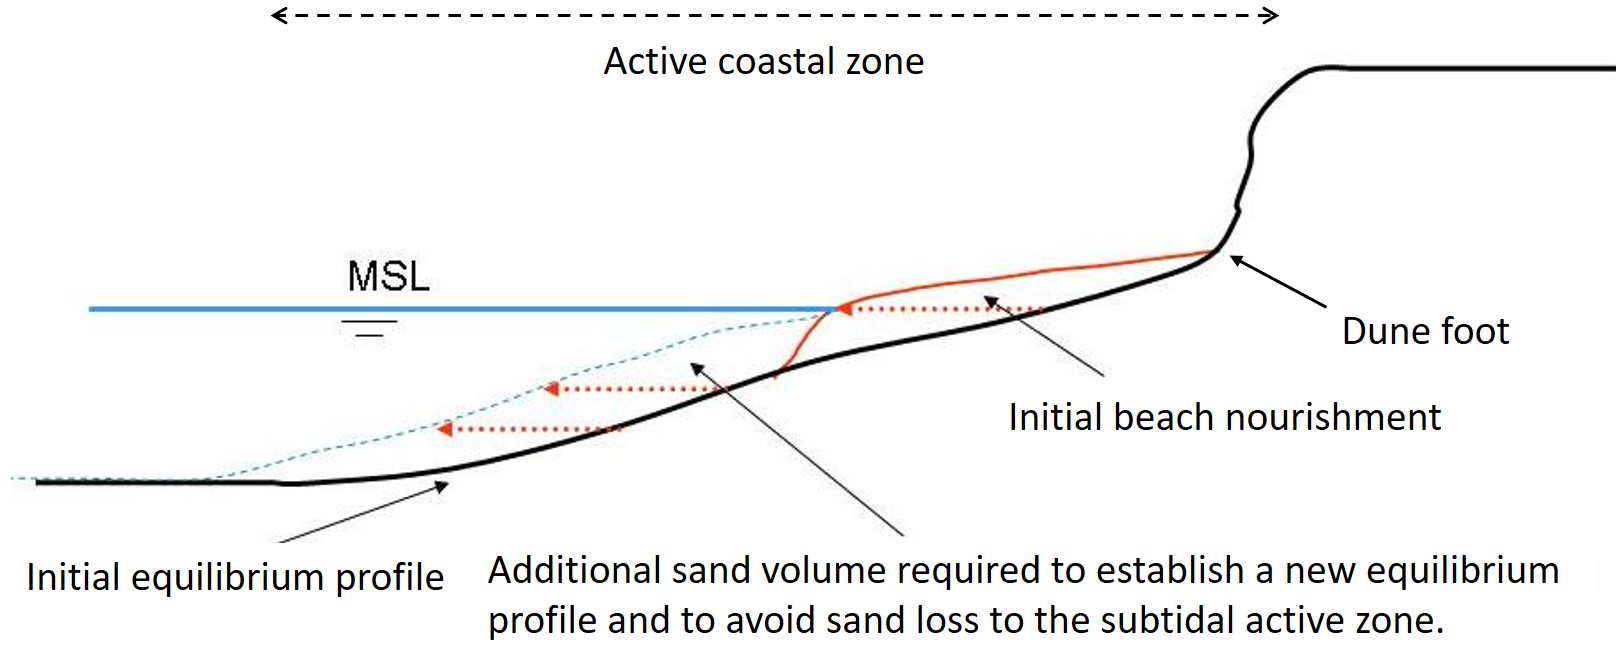
| 17:02, 18 January 2022 | EquilibriumNourishment.jpg (file) |  |
123 KB | Morphological response to beach broadening, assuming initial equilibrium. | 1 |
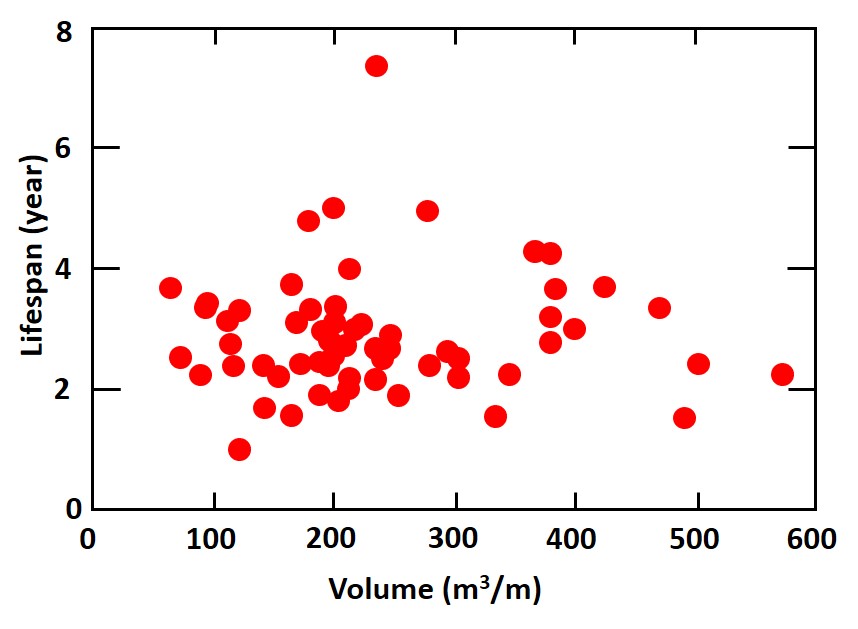
| 13:29, 18 January 2022 | NourishmentLife.jpg (file) |  |
57 KB | Lifespan of beach nourishments compared to the nourishment volume (Brand et al. 2022) | 1 |
| 23:31, 17 January 2022 | OuterBarNourishment.jpg (file) |  |
57 KB | Nourishment at the seaside of the outer sand bar. | 1 |
| 23:30, 17 January 2022 | BeachNourishment.jpg (file) |  |
56 KB | Beach nourishment. | 1 |
| 23:30, 17 January 2022 | BackshoreNourishment.jpg (file) |  |
56 KB | Backshore nourishment. | 1 |
| 23:29, 17 January 2022 | DuneNourishment.jpg (file) |  |
56 KB | Inner dune nourishment. | 1 |
| 23:28, 17 January 2022 | ChannelWallNourishment.jpg (file) |  |
57 KB | Channel wall nourishment. | 1 |
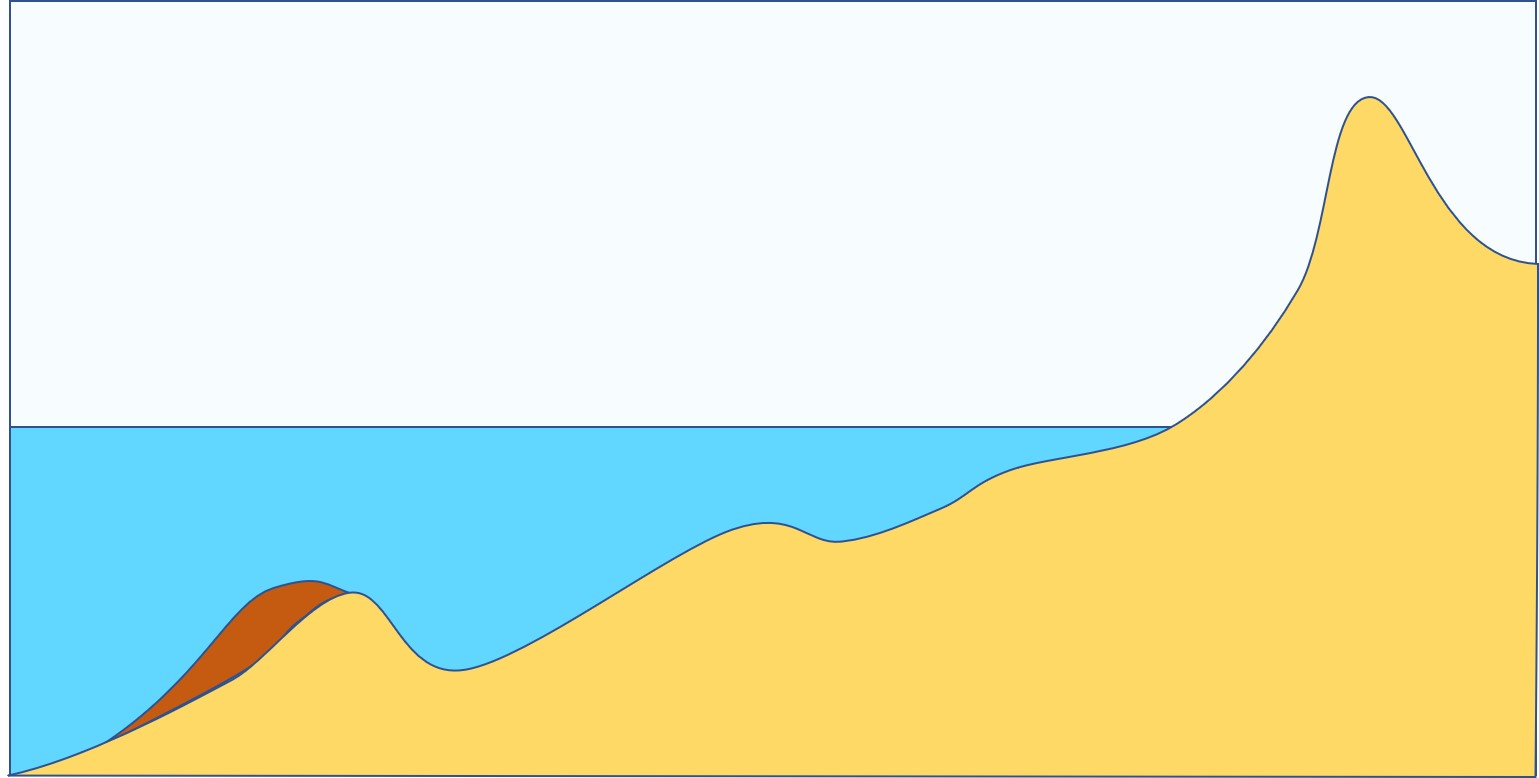
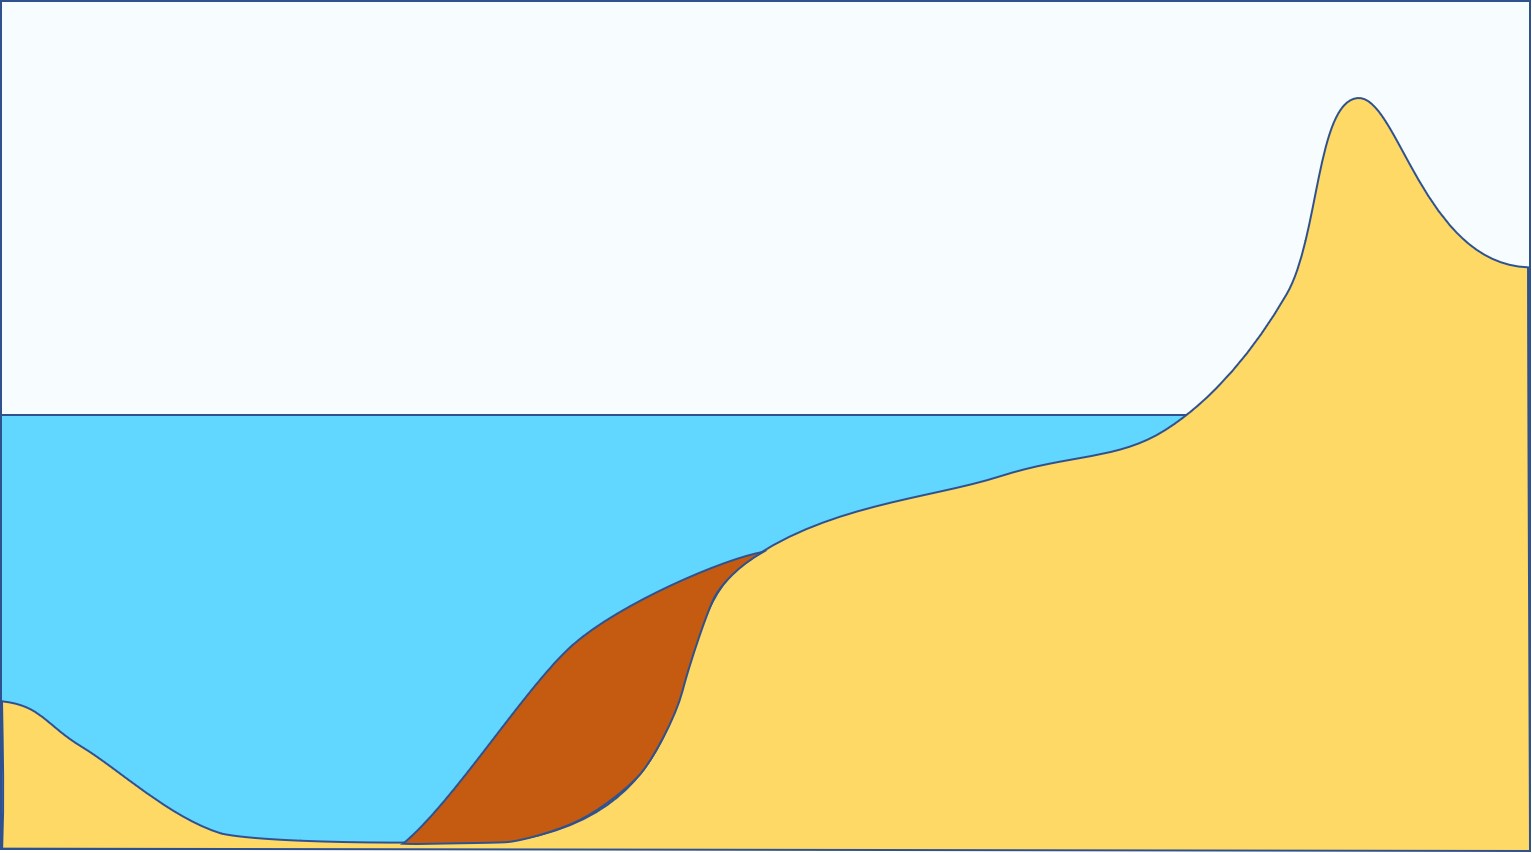
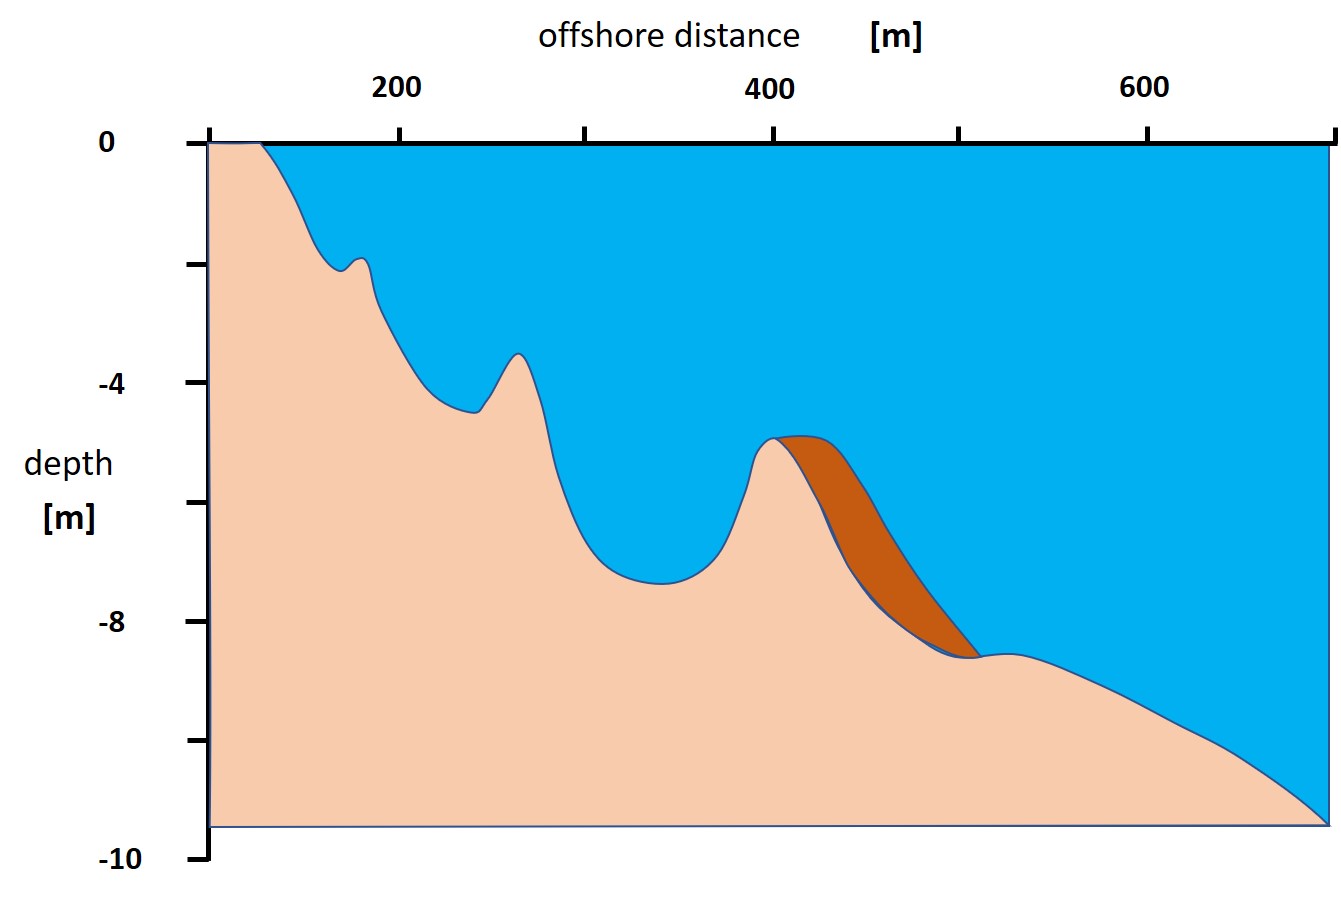
| 16:30, 17 January 2022 | ShorefaceNourishment.jpg (file) |  |
67 KB | Coastal profile near Egmond (North-Holland) with sand nourishment at the seaside of the outer sandbar. | 1 |
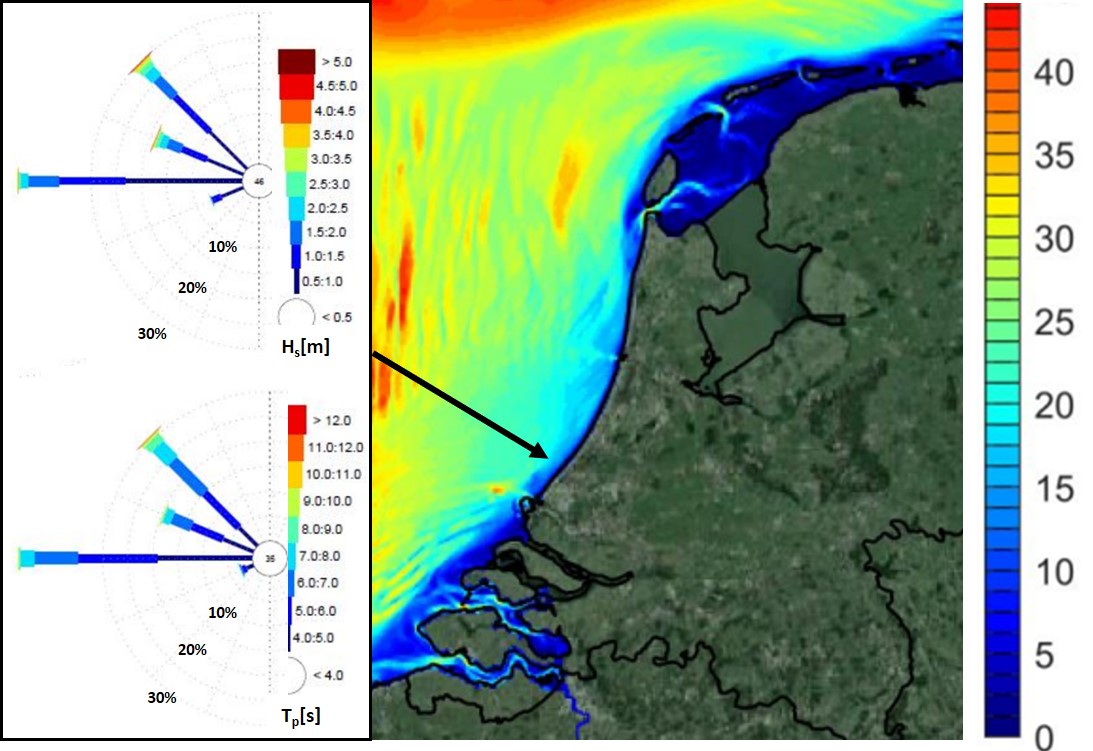
| 16:29, 17 January 2022 | DutchCoastalZone.jpg (file) |  |
150 KB | Characteristics of the Dutch coast. The figure shows a bathymetric map [m] of the coastal zone and wind roses (significant wave height and peak period) at the location indicated by the arrow. | 1 |
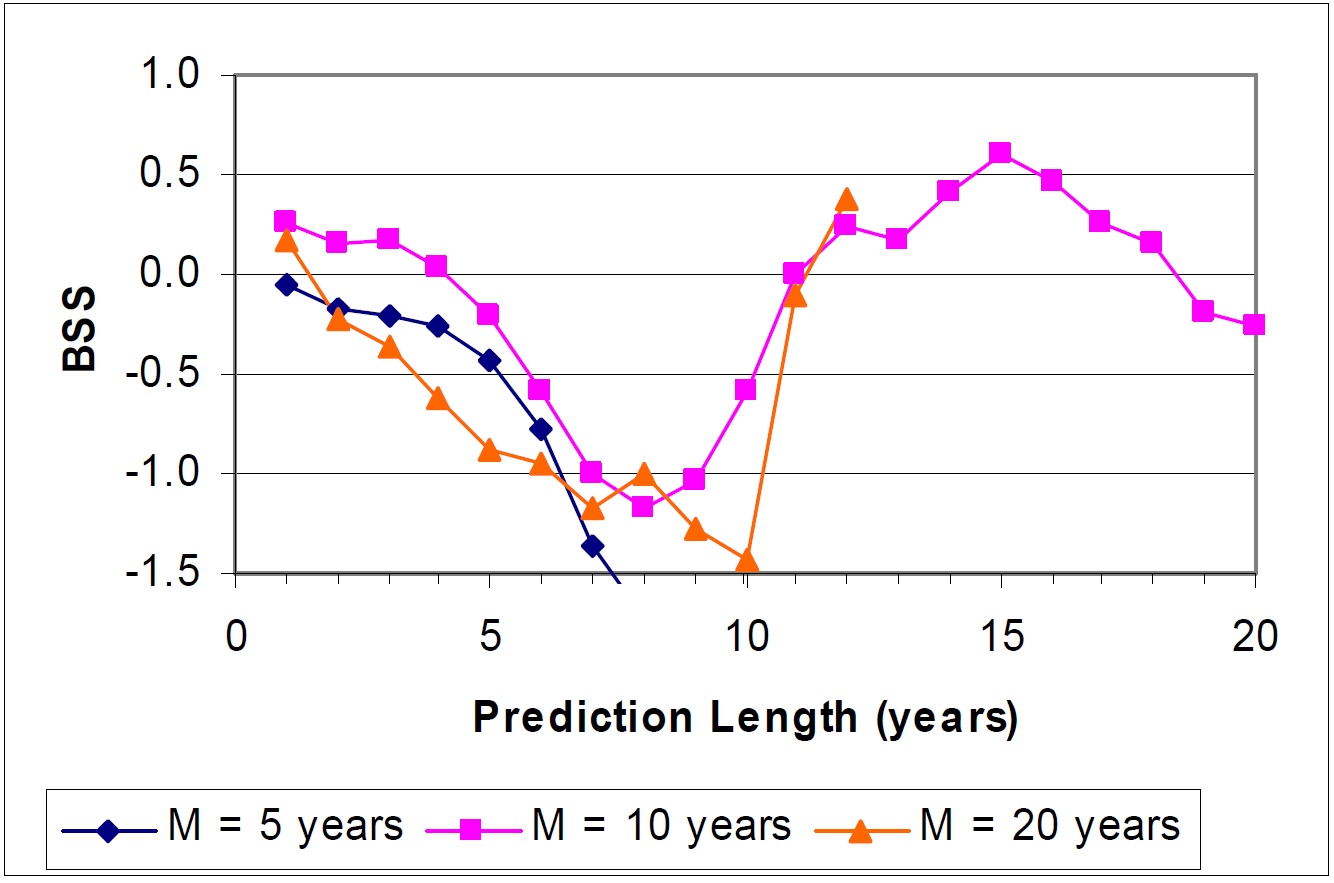
| 17:12, 20 November 2021 | BriarSkillMablethorpeBeach.jpg (file) |  |
160 KB | Briar skill score of beach level trend prediction versus time for Mablethorpe beach based on linear trends fitted to 5, 10 and 20 years’ data. From Sutherland et al. 2007. | 1 |
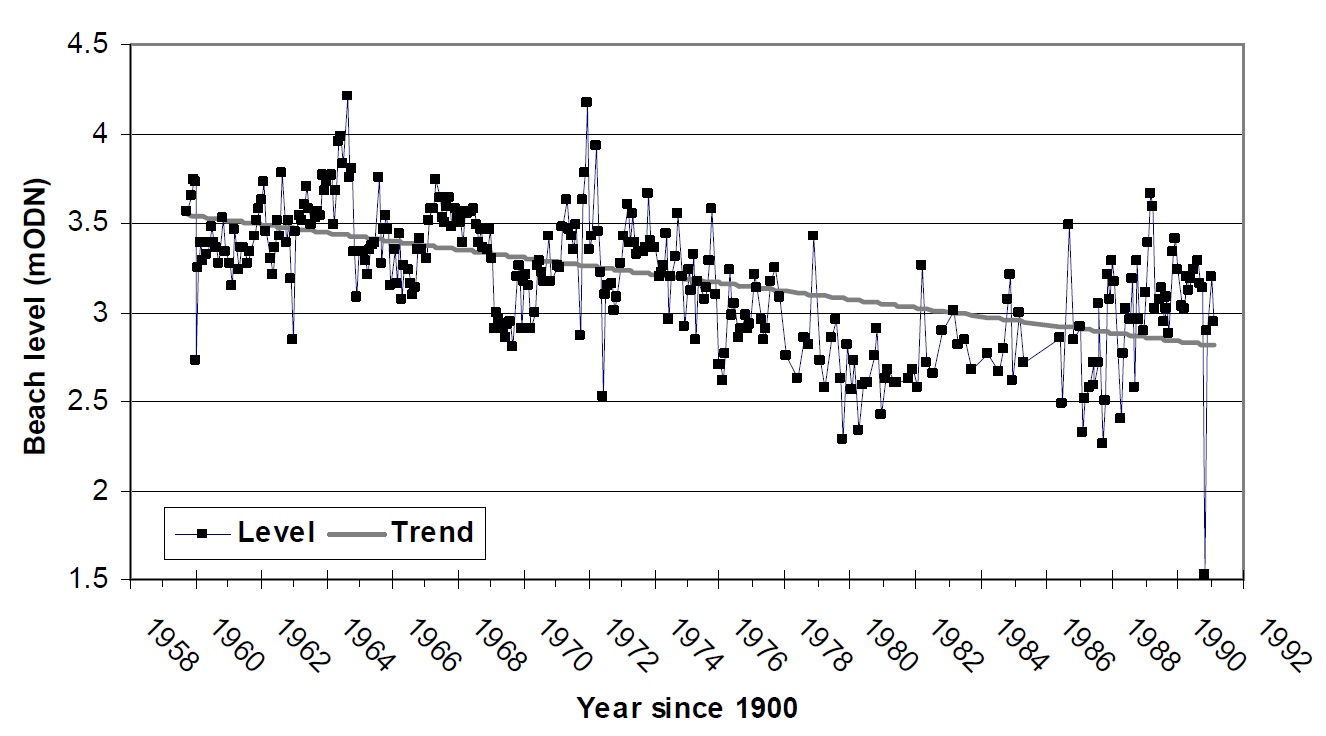
| 18:35, 18 November 2021 | Beach levels at a Mablethorpe seawall.jpg (file) |  |
183 KB | Time series of beach elevation at a set point in front of Mablethorpe seawall. | 1 |
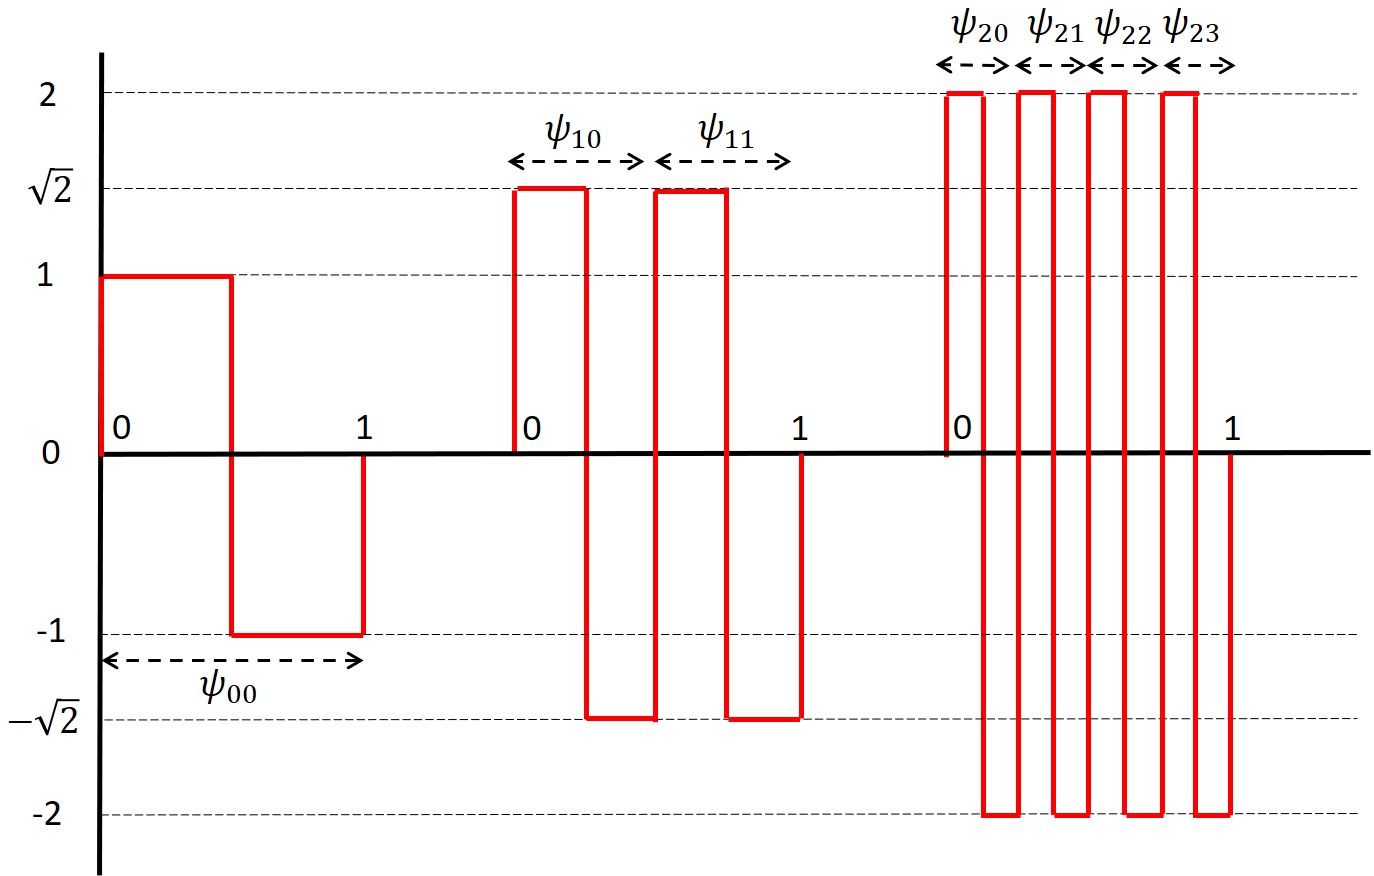
| 12:47, 18 November 2021 | Haar.jpg (file) |  |
125 KB | Haar wavelets. | 1 |
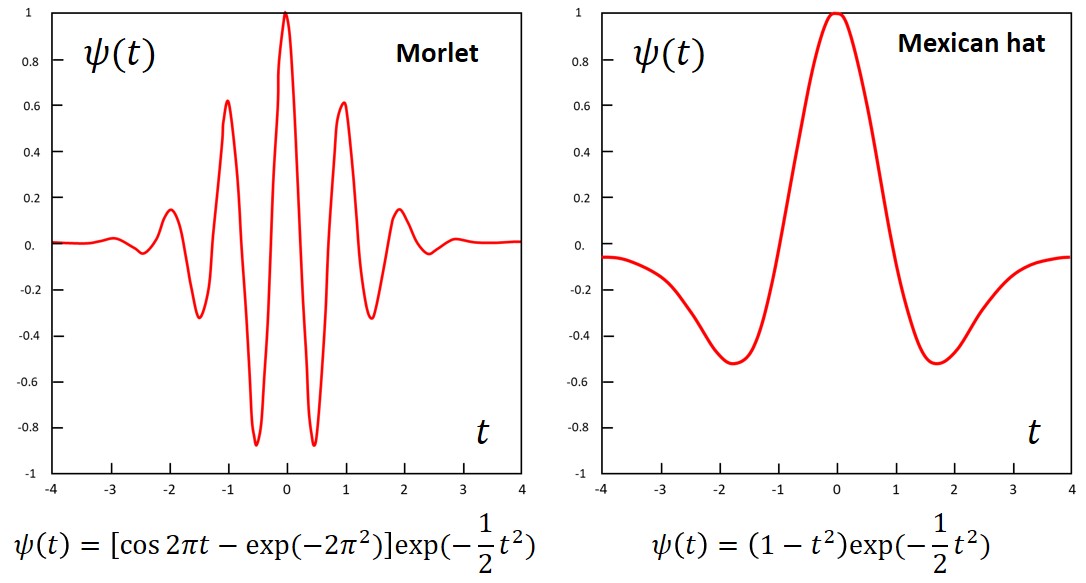
| 12:29, 18 November 2021 | ContinuousWavelets.jpg (file) |  |
78 KB | The mother wavelet functions of Morlet and Ricker (also called 'Mexican hat'). | 1 |
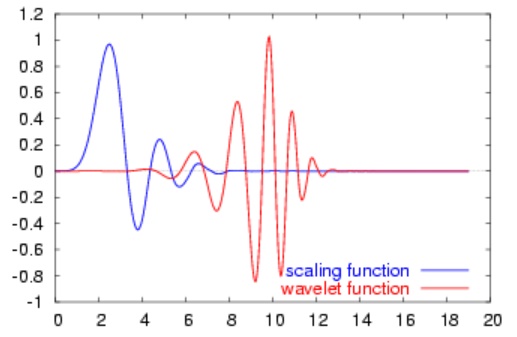
| 21:53, 17 November 2021 | Daubechies20.jpg (file) |  |
34 KB | Daubechies scaling and wavelet functions of order 20. From [https://en.wikipedia.org/wiki/Daubechies_wavelet Wikipedia]. | 1 |
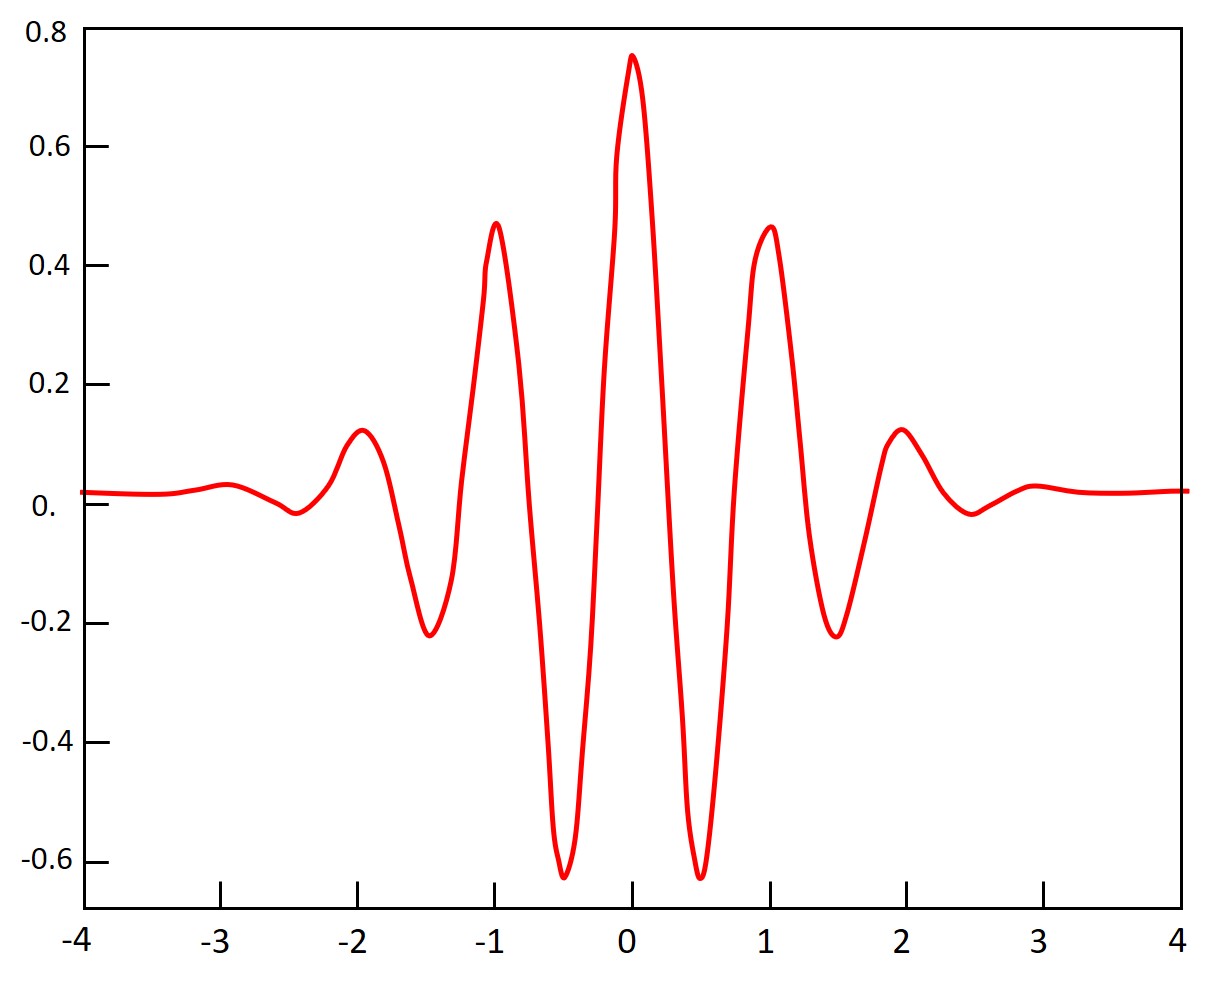
| 11:31, 15 November 2021 | Morlet.jpg (file) |  |
81 KB | Morlet wavelet. | 1 |
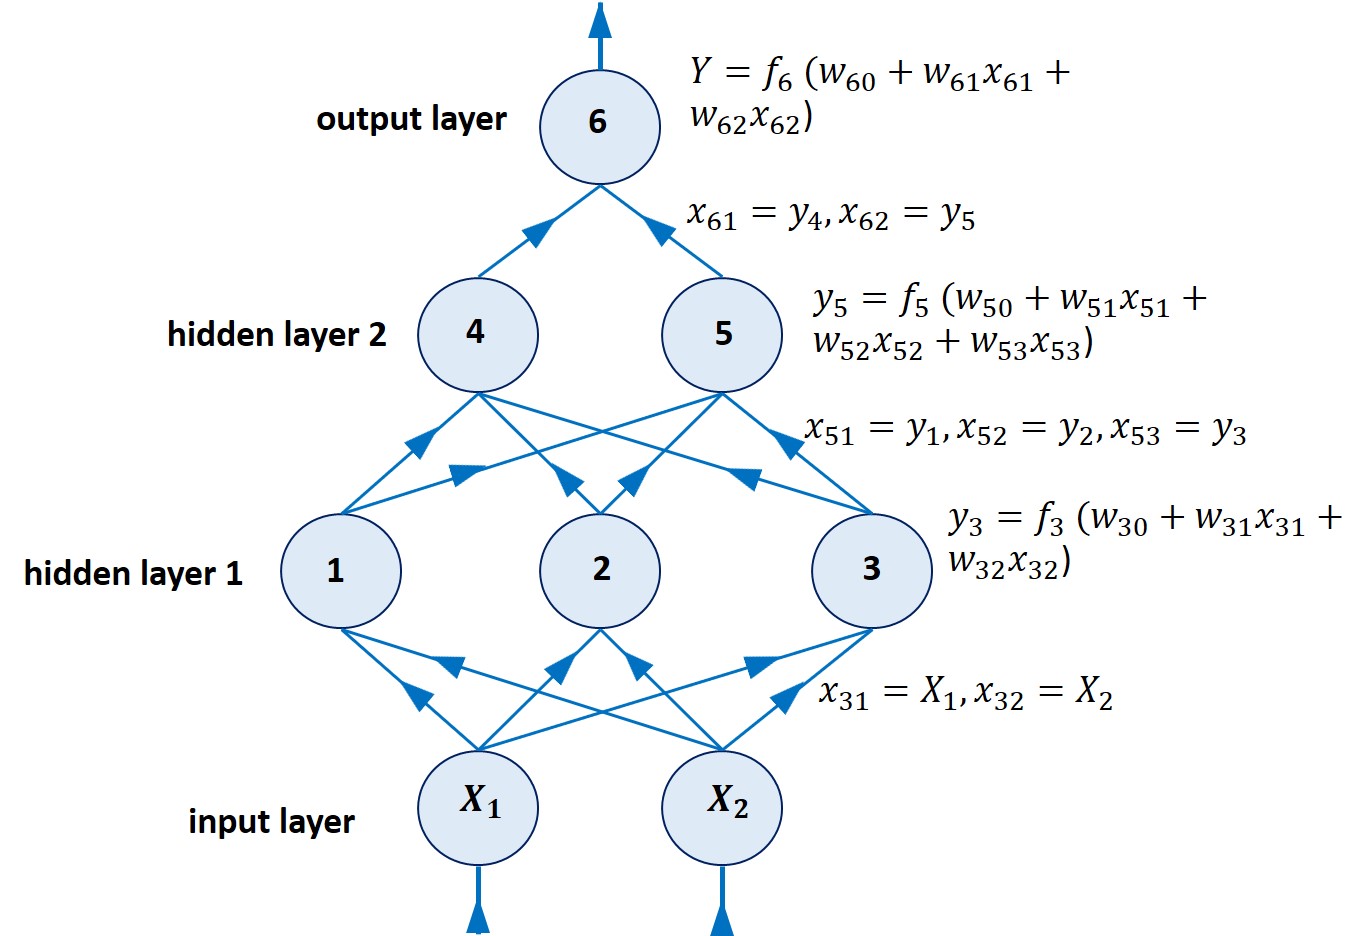
| 16:47, 11 November 2021 | Feedforward.jpg (file) |  |
140 KB | Schematic representation of a simple feedforward neural network with 2 inputs and 2 hidden layers. | 1 |
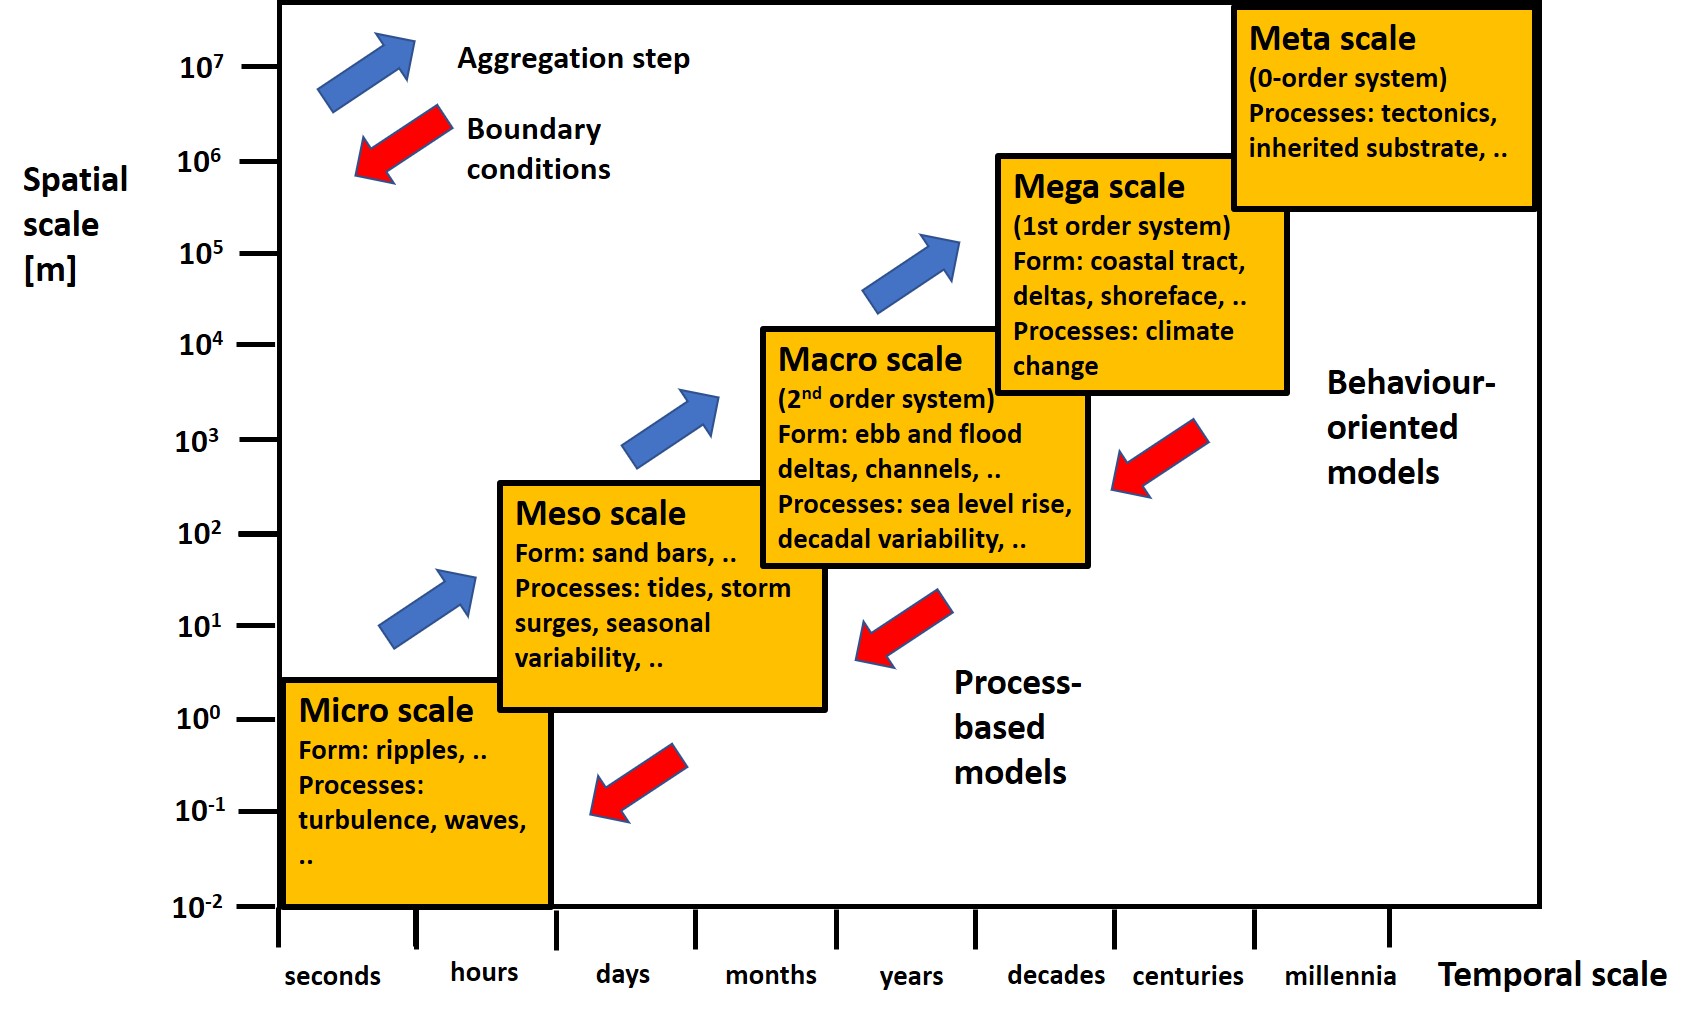
| 17:38, 7 November 2021 | TemporalSpatialScales.jpg (file) |  |
237 KB | Scale hierarchy in coastal modelling. | 1 |
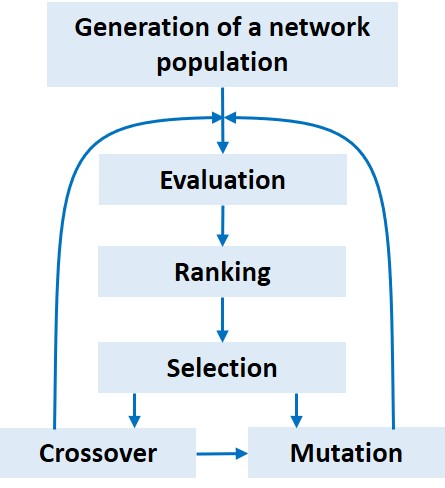
| 11:11, 1 November 2021 | GeneticNetwork.jpg (file) |  |
36 KB | Flowchart of a genetic neural network. | 1 |
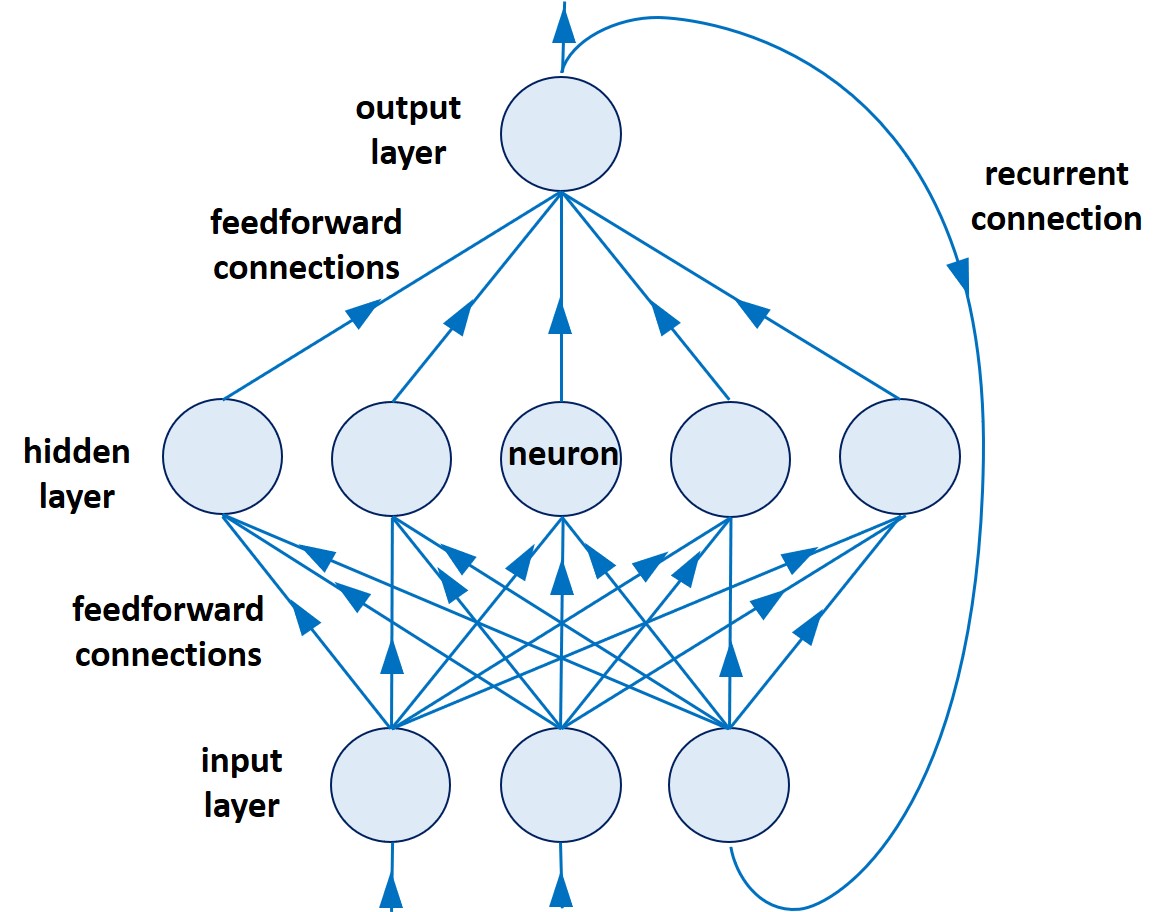
| 11:10, 1 November 2021 | RecurrentNetwork.jpg (file) |  |
145 KB | Schematic representation of a recurrent neural network. | 1 |
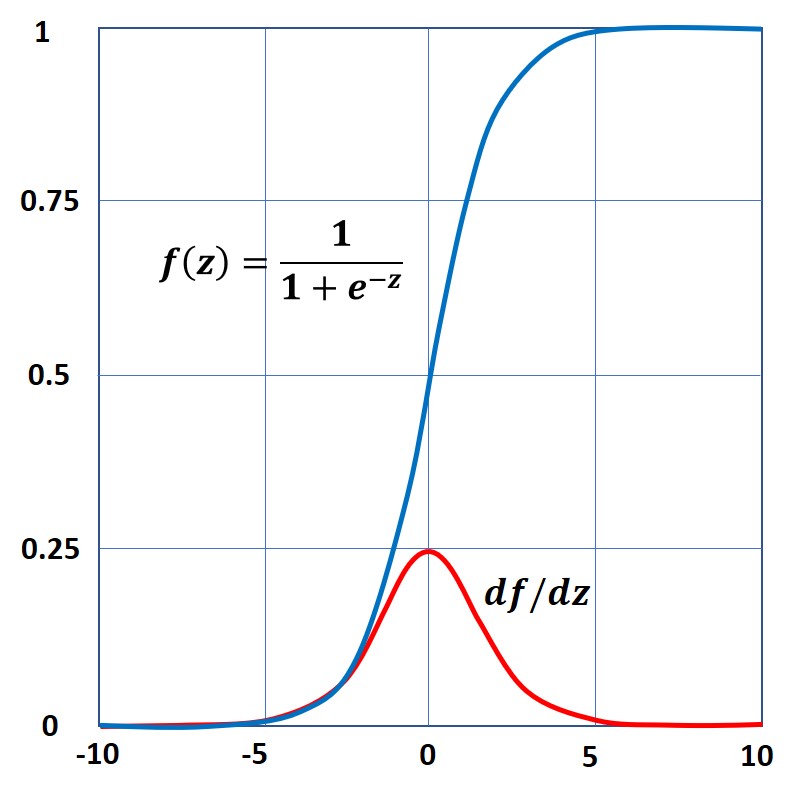
| 11:09, 1 November 2021 | LogisticFunction.jpg (file) |  |
56 KB | Logistic function (blue) and its derivative (red). | 1 |
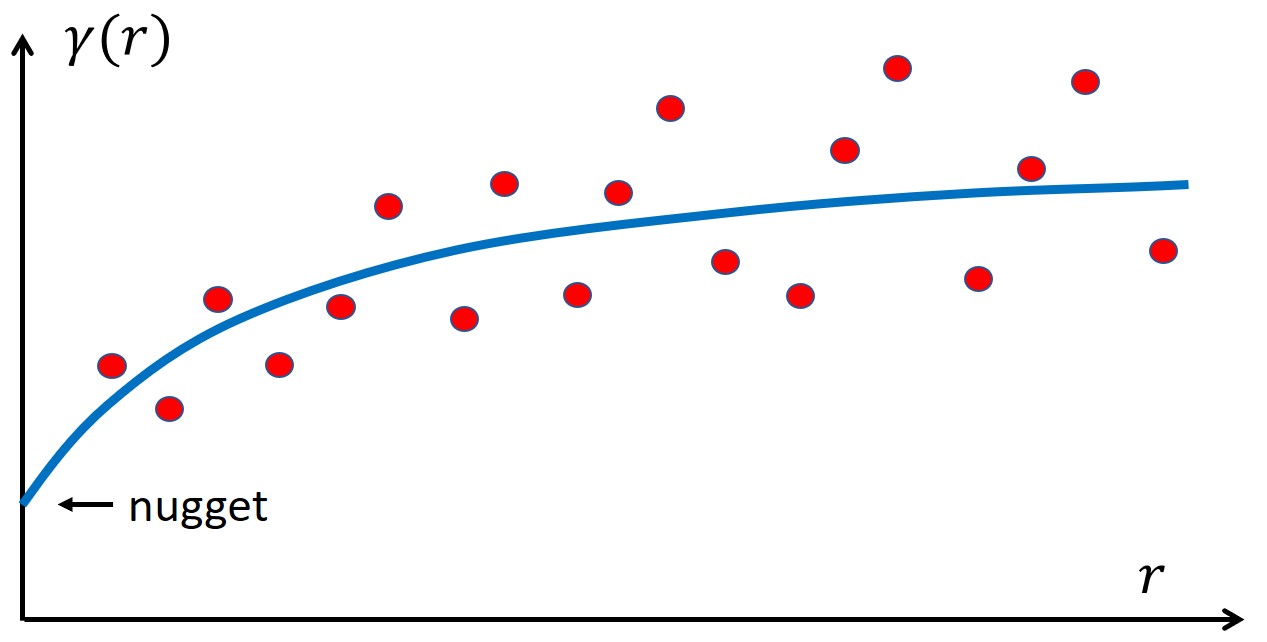
| 22:41, 16 October 2021 | Variogram.jpg (file) |  |
50 KB | Example of a variogram. | 1 |
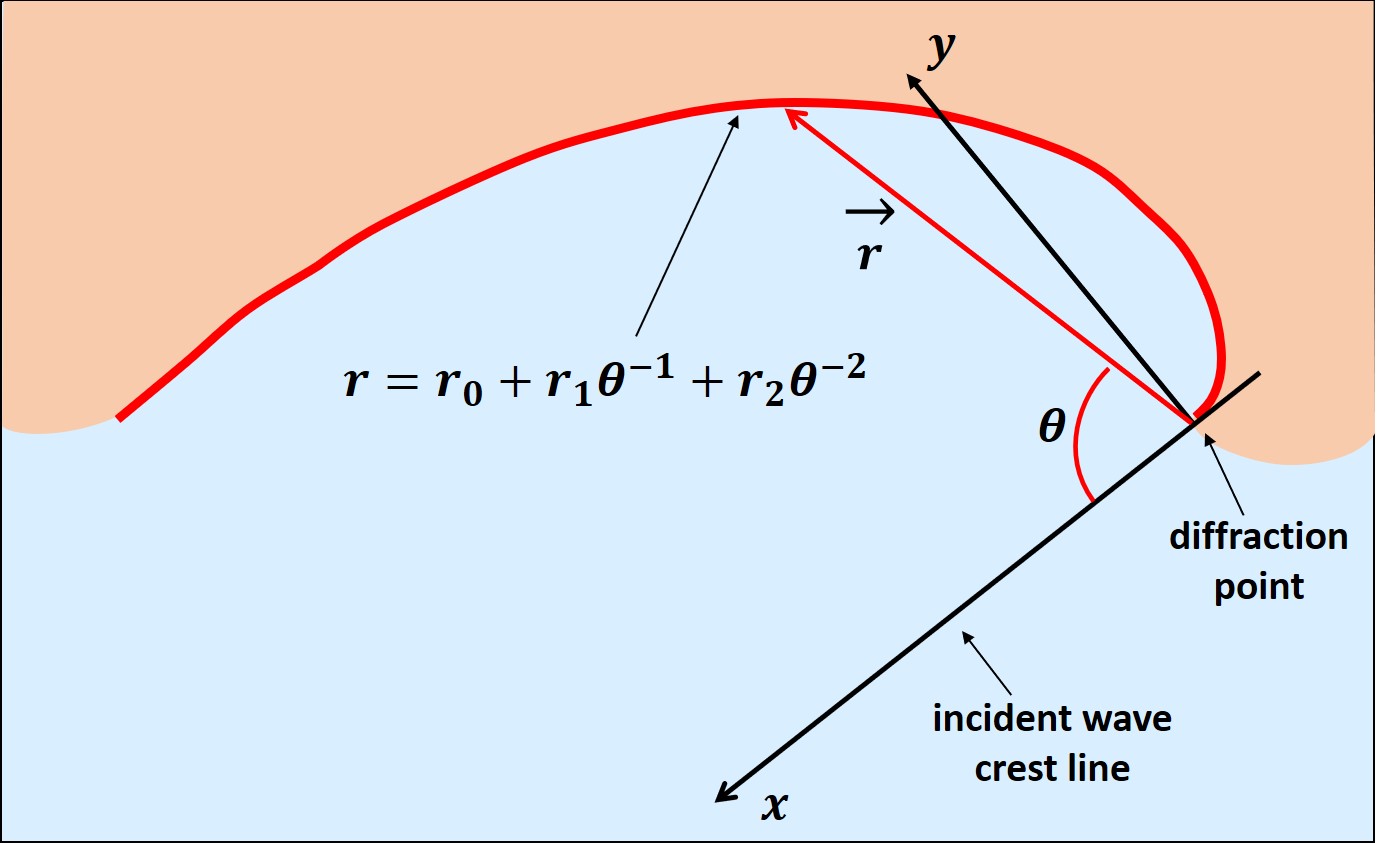
| 15:49, 3 October 2021 | ParabolicBayScheme.jpg (file) |  |
95 KB | Sketch and symbols for the parabolic headland bay. | 1 |
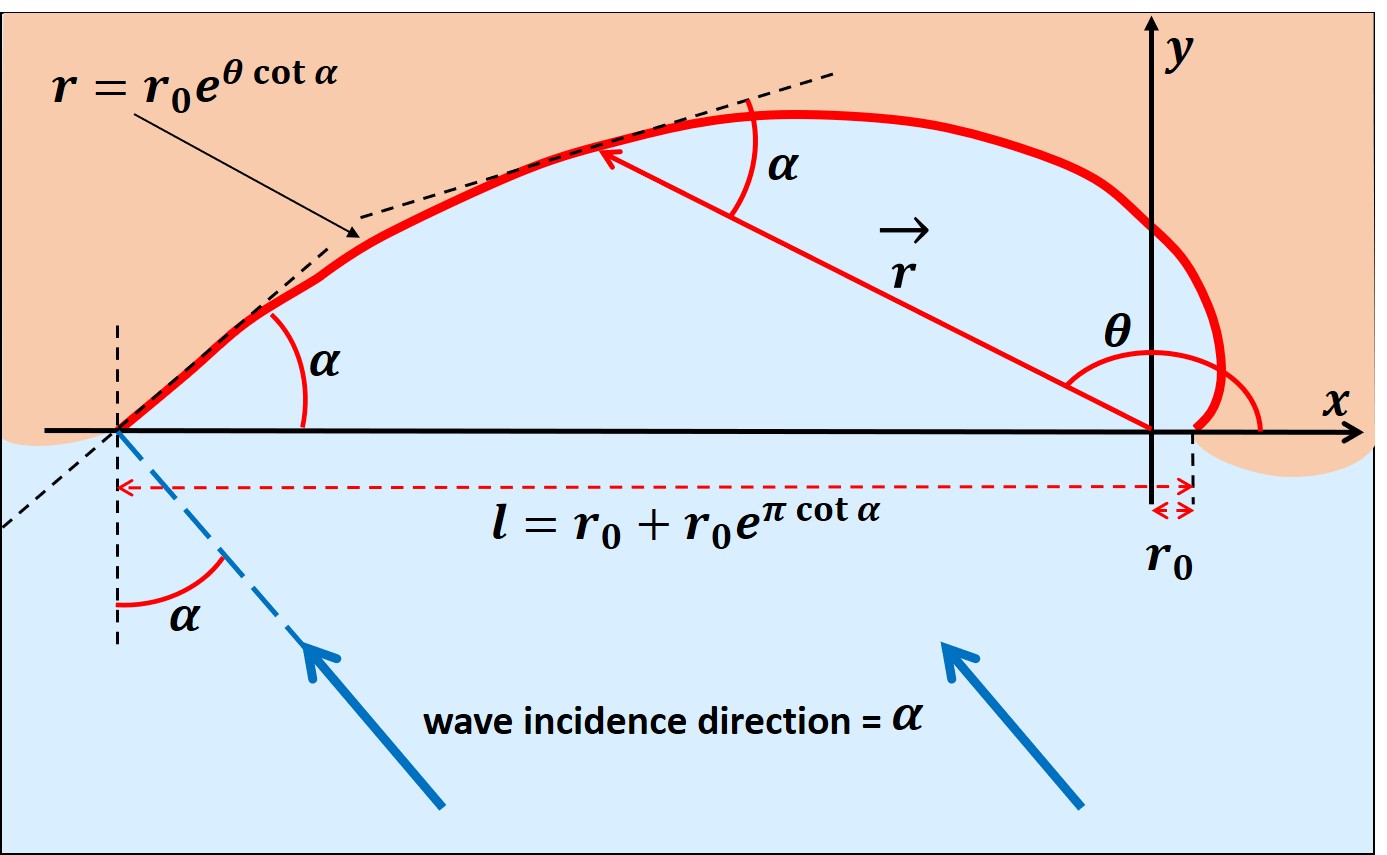
| 12:31, 2 October 2021 | Logspiral.jpg (file) |  |
123 KB | Sketch and symbols for the logspiral plan shape formula, assuming equilibrium and ignoring wave refraction outside the embayment. | 1 |
| 20:47, 1 October 2021 | LogspiralBeach.jpg (file) |  |
139 KB | Schematic representation of the theoretical equilibrium planform of an embayed beach of the logspiral type. | 1 |
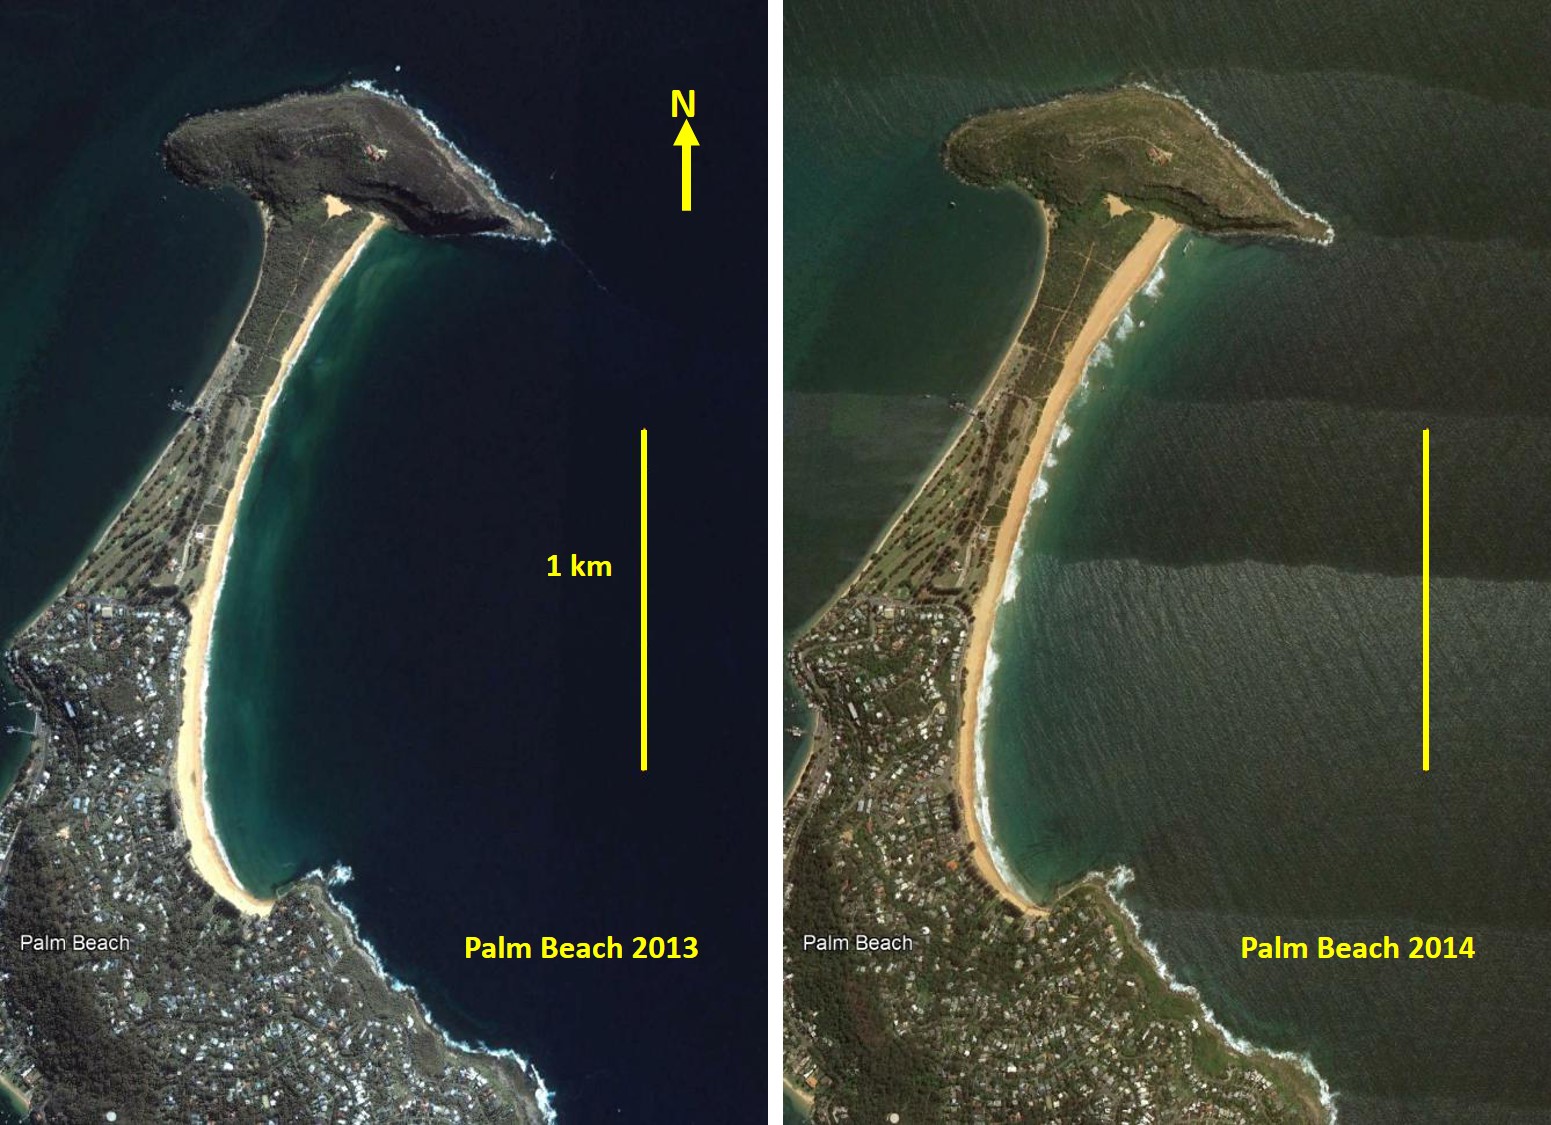
| 20:44, 1 October 2021 | BeachRotationPB.jpg (file) |  |
346 KB | Example of beach rotation, Palm Beach, Australian east coast. In 2013 the beach width was greatest in the southern part; in 2014 the width was greatest in the northern part. Images Google Earth. | 1 |
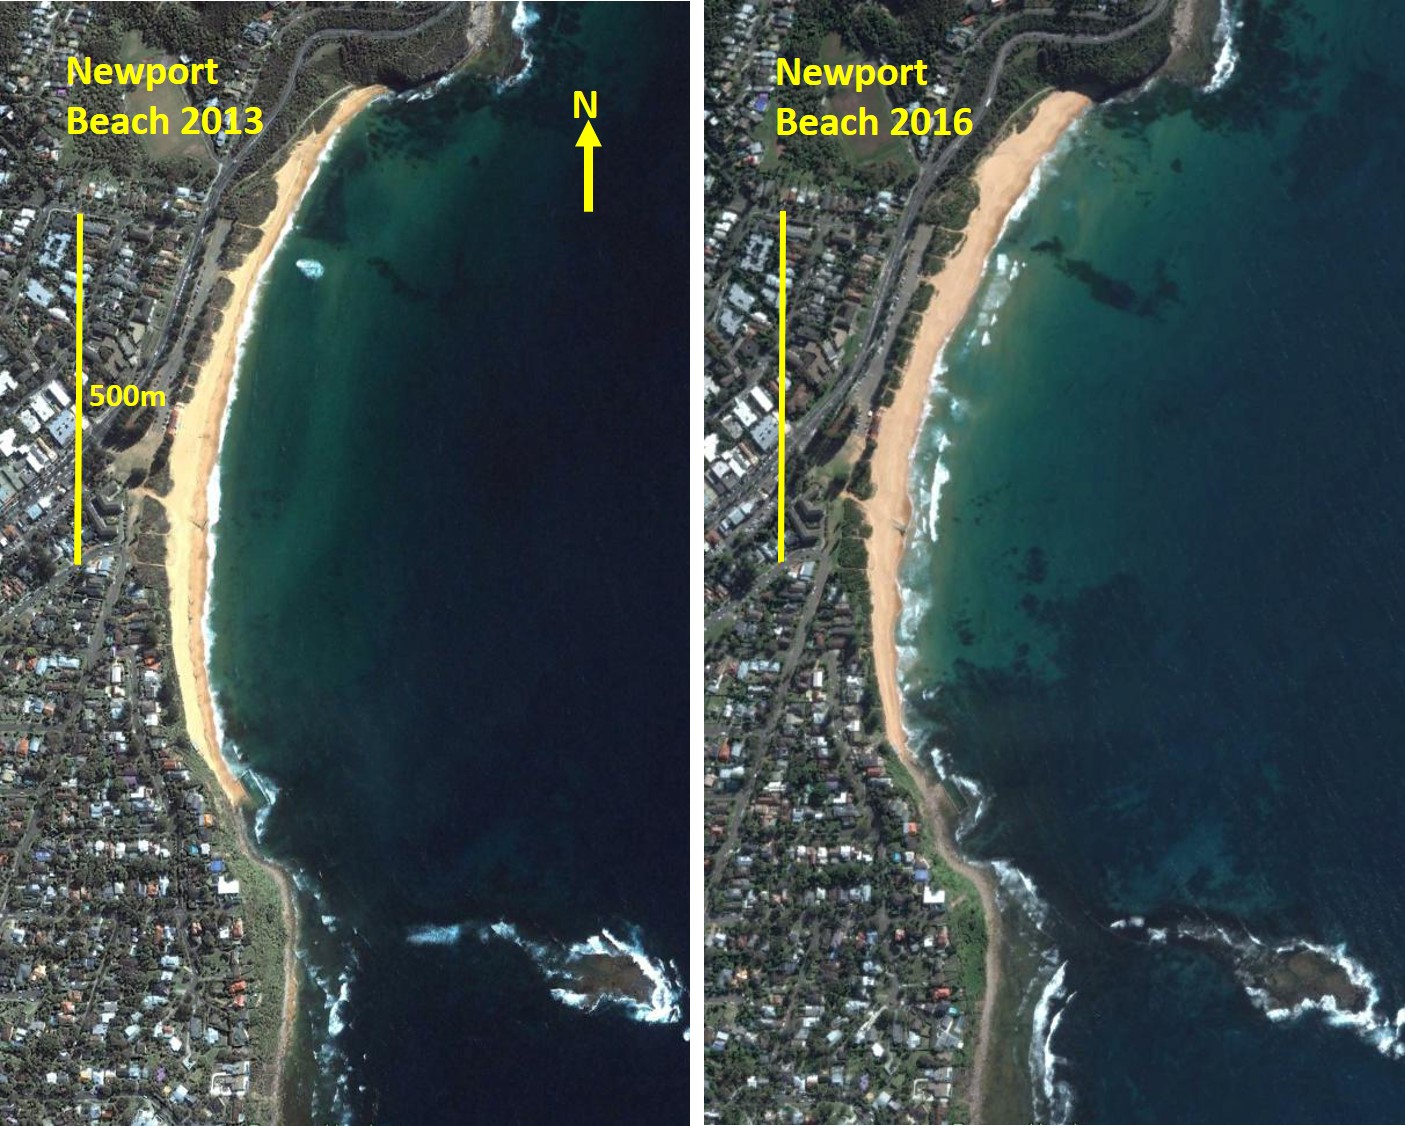
| 15:25, 1 October 2021 | BeachRotation.jpg (file) |  |
366 KB | Example of beach rotation, Newport Beach, Australian east coast. In 2013 the beach width was greatest in the south-middle part; in 2016 the width was greatest in the northern part. Images Google Earth. | 1 |
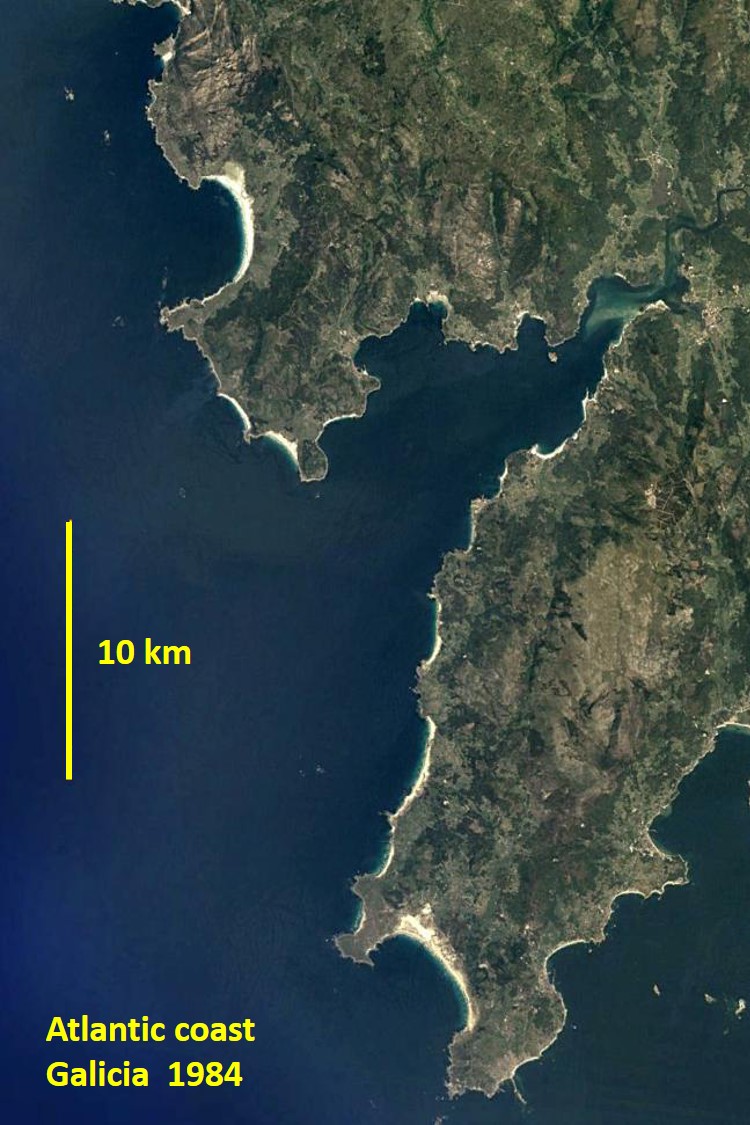
| 15:24, 1 October 2021 | EmbayedBeaches.jpg (file) |  |
183 KB | The rocky shore of western Galicia (Spain) with numerous embayed beaches. Google Earth image. | 1 |
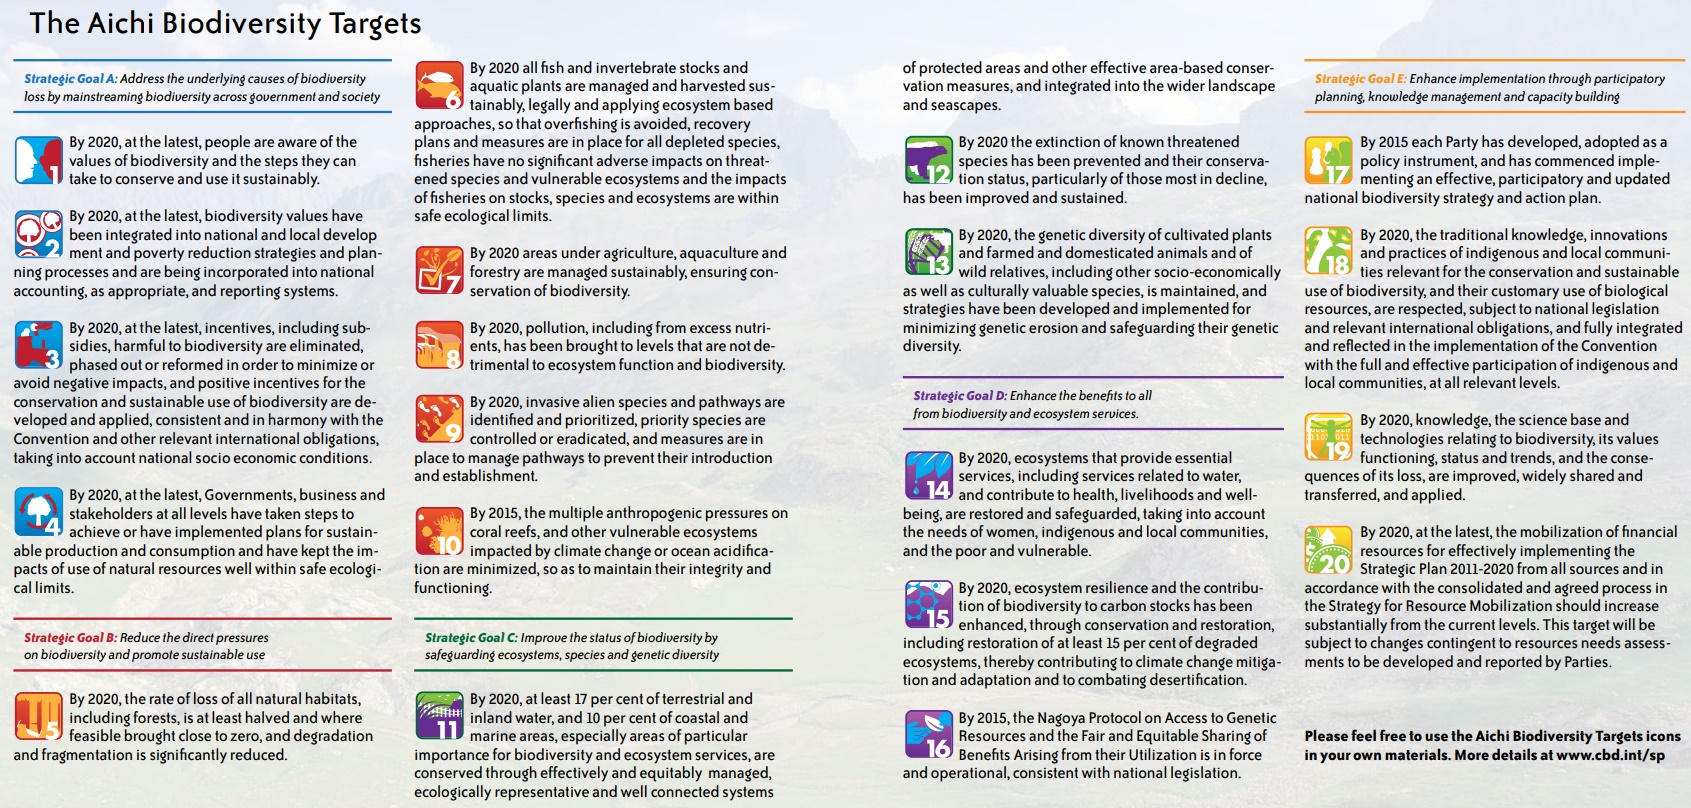
| 12:24, 26 September 2021 | AichiTargets.jpg (file) |  |
827 KB | AICHI Biodiversity Targets. | 1 |
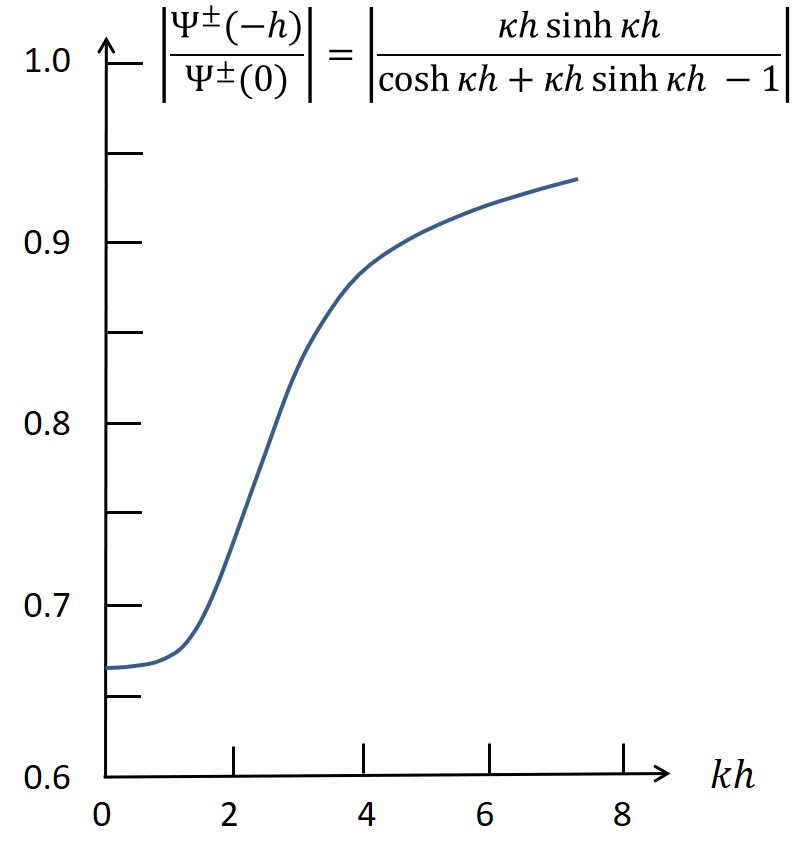
| 16:48, 15 September 2021 | RotationDamping.jpg (file) |  |
48 KB | Relative damping of the rotation components <math>|\Psi^{\pm}(-h)/\Psi^{\pm}(0)|</math> between surface and top of boundary layer as function of <math>kh</math>. | 2 |
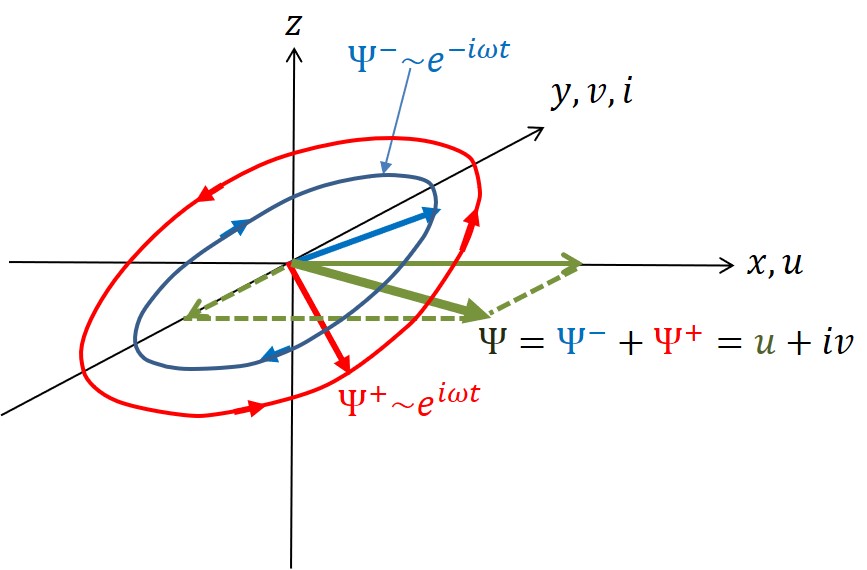
| 20:39, 13 September 2021 | RotatingComponents.jpg (file) |  |
54 KB | Definition of right-handed reference scheme with cyclonic and anticyclonic velocity components. | 1 |
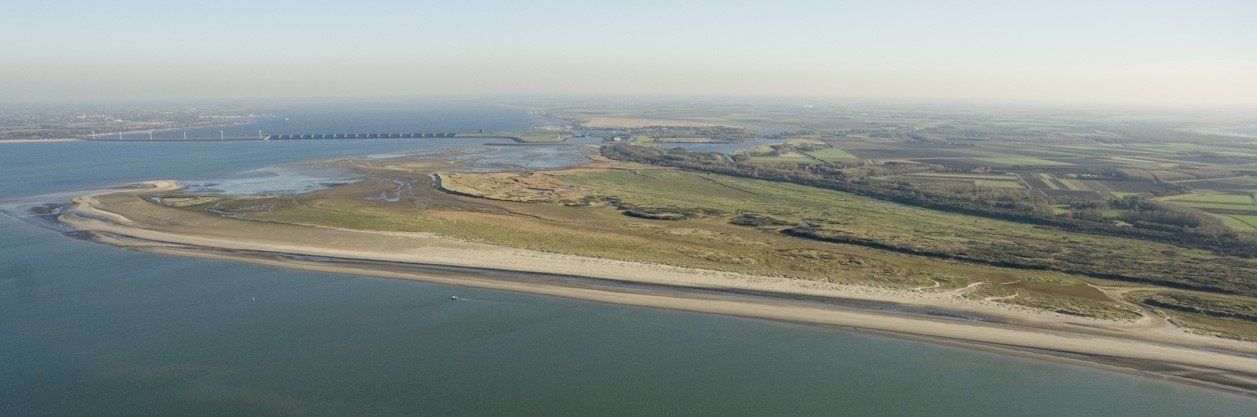
| 15:08, 30 August 2021 | DuneBeltsGoeree2005.jpg (file) |  |
93 KB | Following the construction of the Rhine discharge sluices ('Haringvliet sluices') in 1970, a strong progradation occurred at the adjacent coast of Goeree. The image from 2005 shows new dune ridges that formed on the accreted strand plain. Photo credit... | 1 |
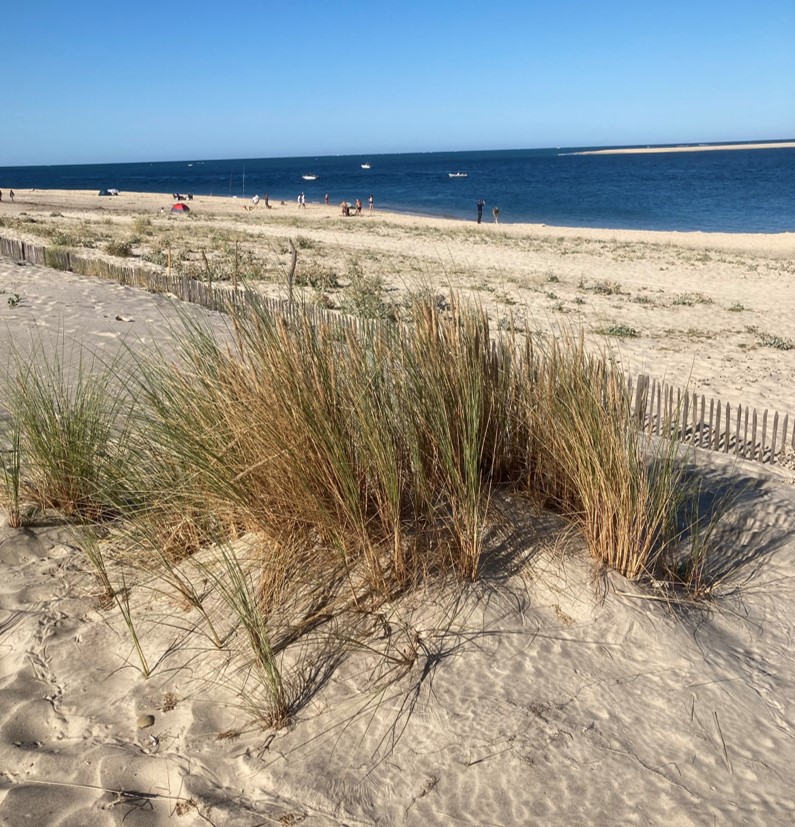
| 15:07, 30 August 2021 | NebkhaMarramGrass.jpg (file) |  |
232 KB | Development of an embryo dune induced by sand trapping marram grass (''Ammophila arenaria''). | 1 |
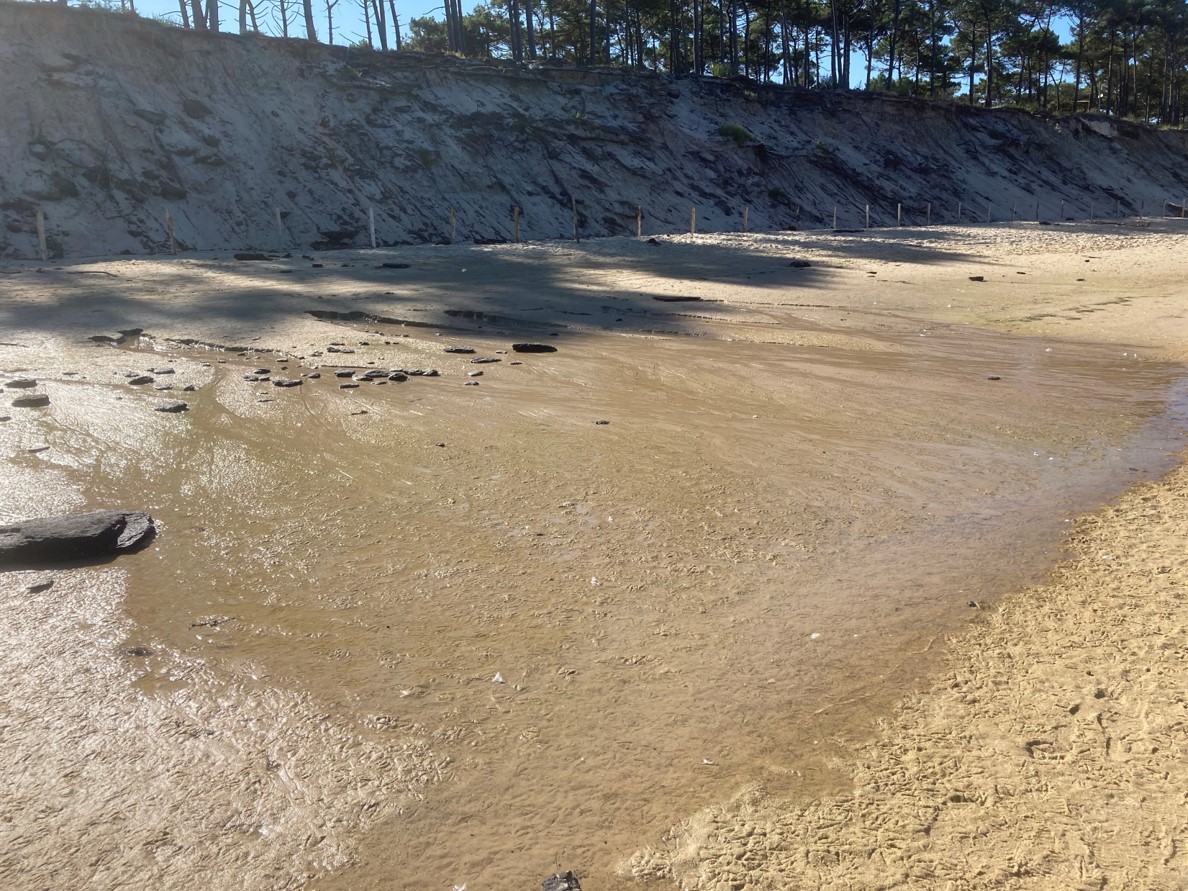
| 15:06, 30 August 2021 | BackshoreGroundwaterUpwelling.jpg (file) |  |
384 KB | Backshore groundwater upwelling, near the foot of the eroded dune face, Aquitaine coast, France. | 1 |
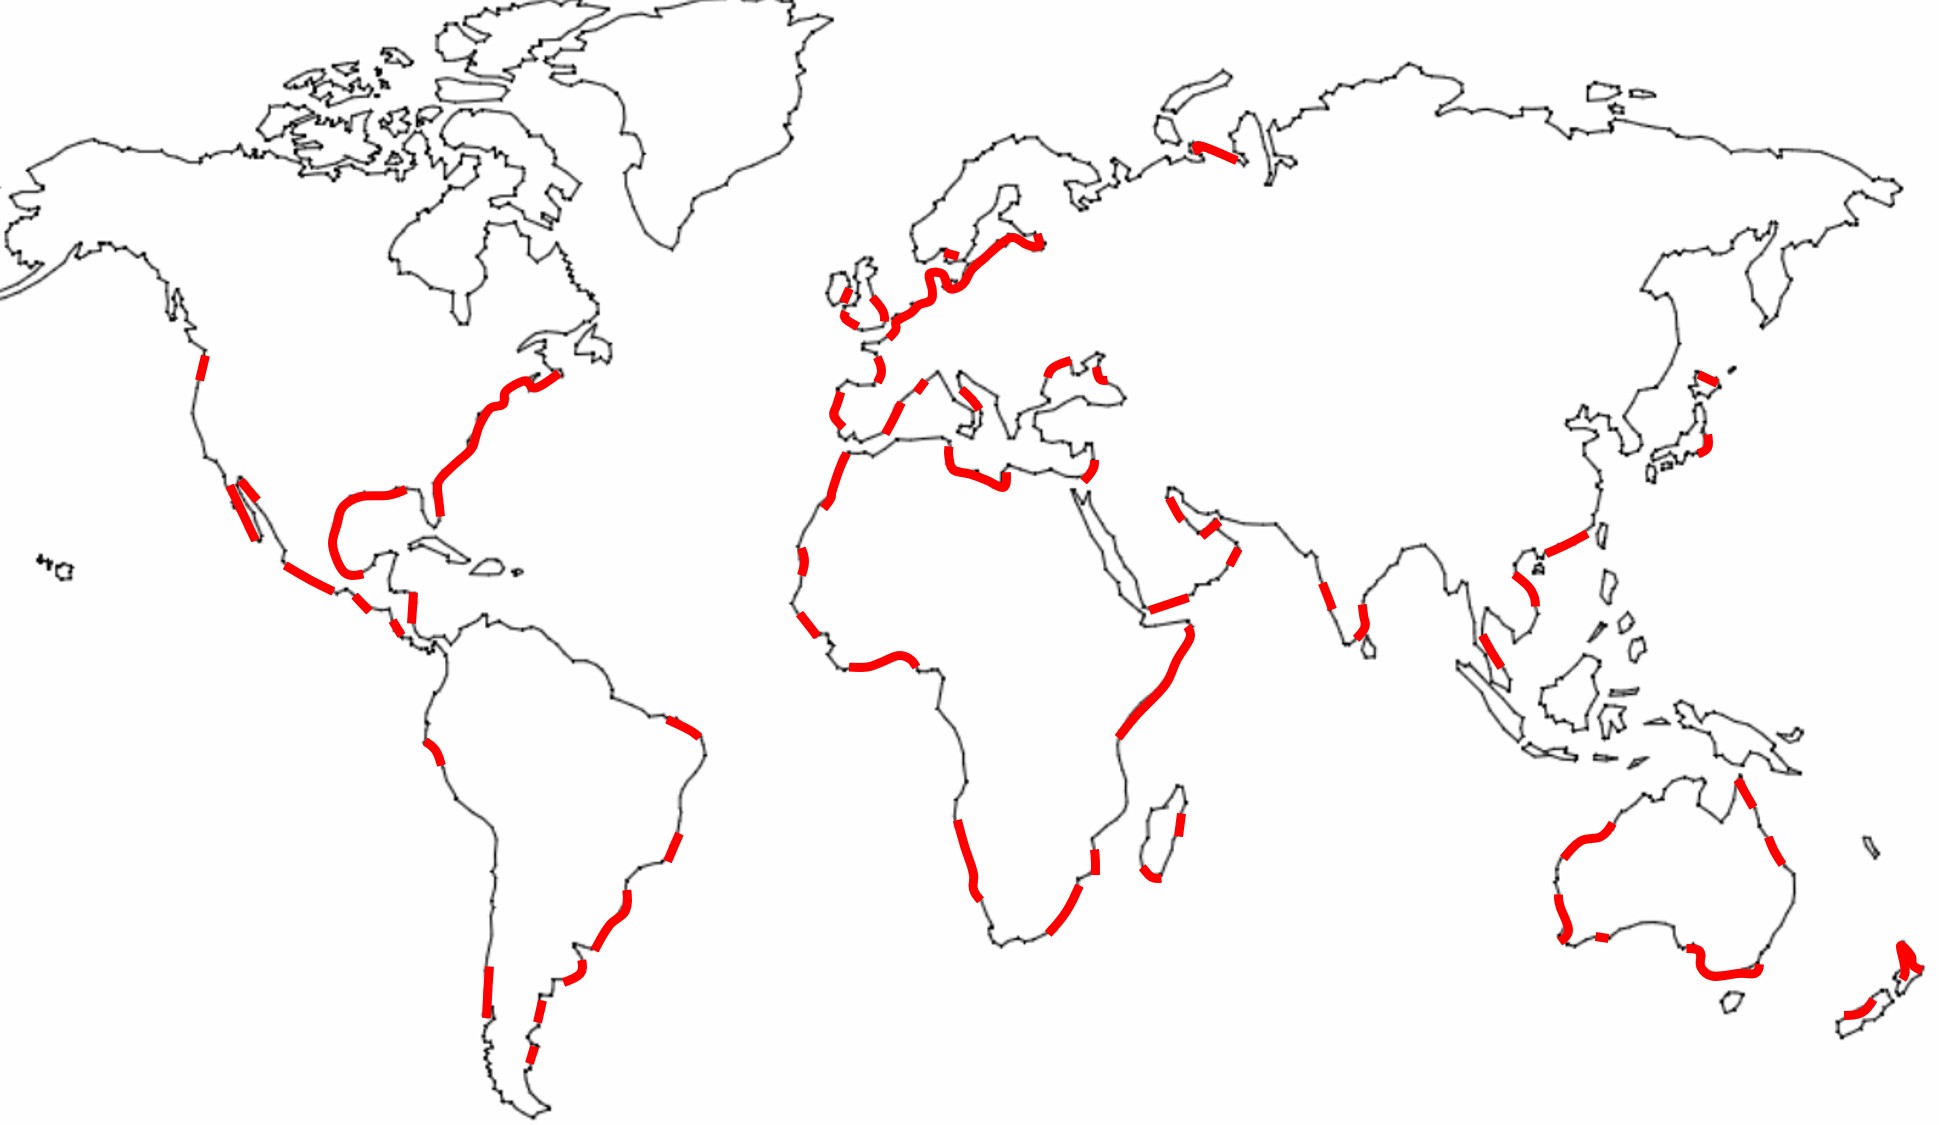
| 15:05, 30 August 2021 | WorldDuneMap.jpg (file) |  |
169 KB | World map of coastal zones where well-developed coastal dune belts occur. Adapted from Martinez and Psuty (2008) | 1 |
| 17:33, 17 August 2021 | FlocDepositionFlux.jpg (file) |  |
85 KB | Deposition flux of flocculated sediment from the San Francisco Bay tested in a flume (modified from Mehta, A.J., Manning, A.J. and Khare, Y.P. 2014. A note of the Krone deposition equation and significance of floc aggregation, Marine Geology 354: 34-39) | 2 |
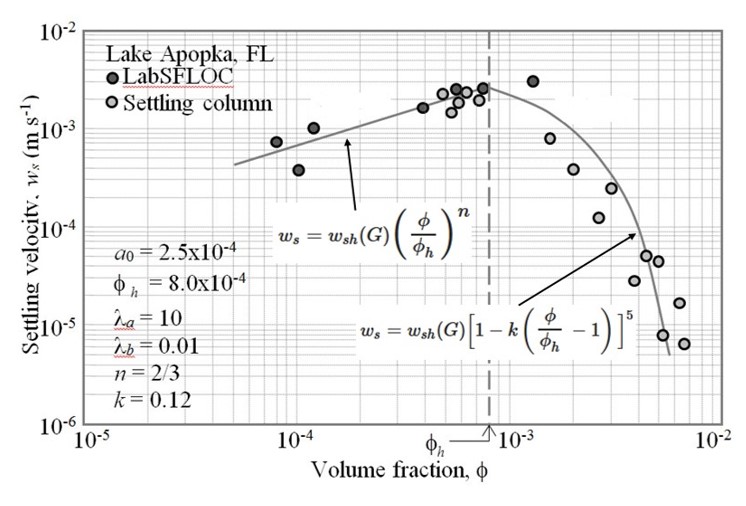
| 17:31, 17 August 2021 | HinderedFlocSettling.jpg (file) |  |
80 KB | Settling velocity as a function of volume fraction; data from Lake Apopka. | 2 |
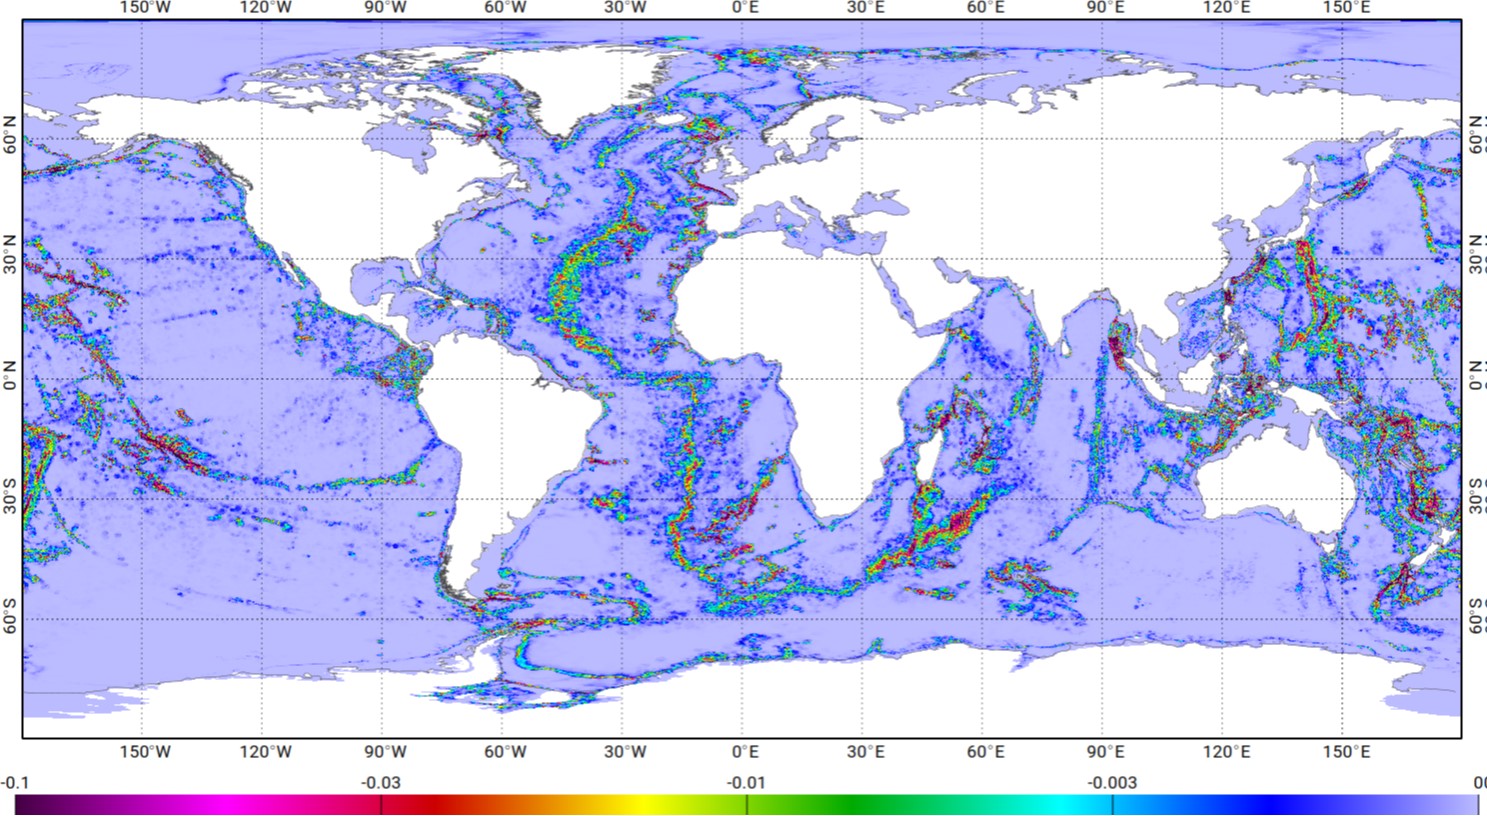
| 21:55, 10 August 2021 | M2BaroclinicDissipationFES.jpg (file) |  |
351 KB | M2 barotropic energy conversion rate (W/m2) toward baroclinic internal tides computed from the FES2014 hydrodynamic model. From Lyard et al. (2021) Creative Commons Licence. | 1 |
| 21:54, 10 August 2021 | M2EnergyDissipationFES.jpg (file) |  |
330 KB | Energy (W/m2) dissipated by bottom friction in the FES2014 hydrodynamic model for the M2 wave. From Lyard et al. (2021) Creative Commons Licence. | 1 |
| 22:55, 26 July 2021 | ResistanceResilienceSystemEvolution.jpg (file) |  |
163 KB | Schematic plot of the (eco)system response to a temporal change in environmental conditions that exert a pressure (red) on the system. The time evolution of the ecosystem state is represented by blue lines corresponding to different resistance-resilien... | 1 |
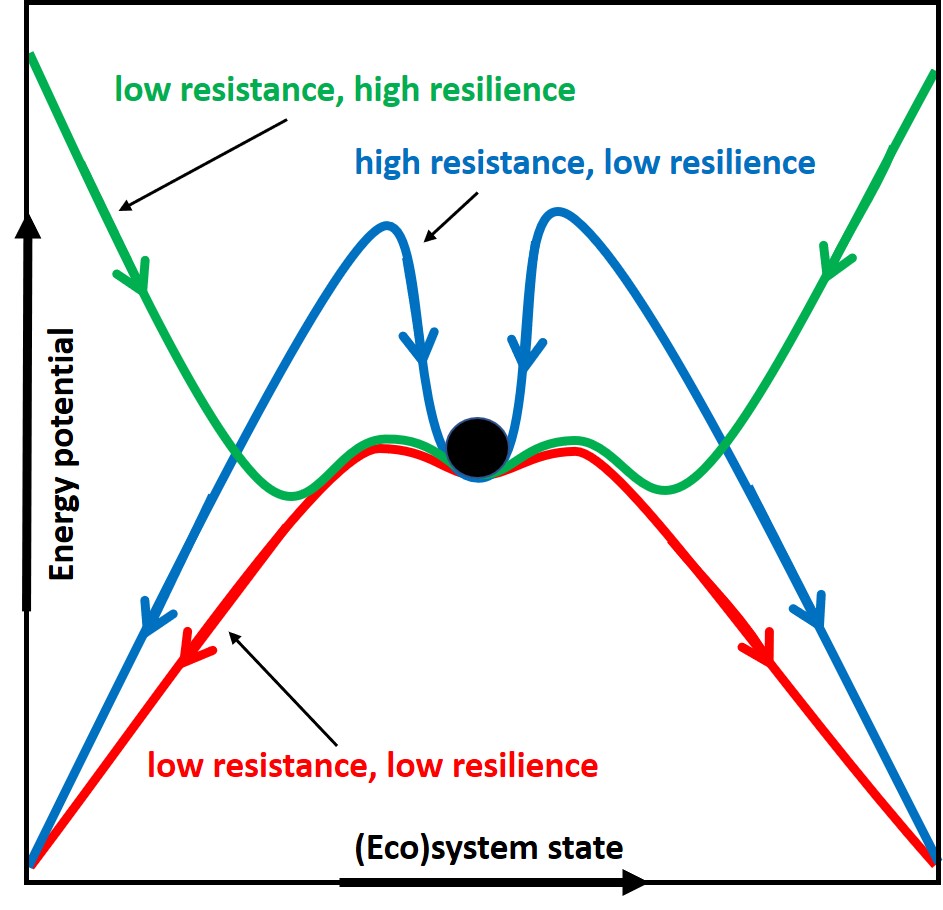
| 22:54, 26 July 2021 | ResistanceResiliencePotential.jpg (file) |  |
125 KB | Schematic plot of different combinations of resistance and resilience, where the ecosystem state is represented by a black marble and the resistance-resilience characteristics by a fictitious energy potential. | 1 |
| 12:32, 13 June 2021 | GPS shoreline.jpg (file) |  |
19 KB | GPS shoreline monitoring. | 1 |
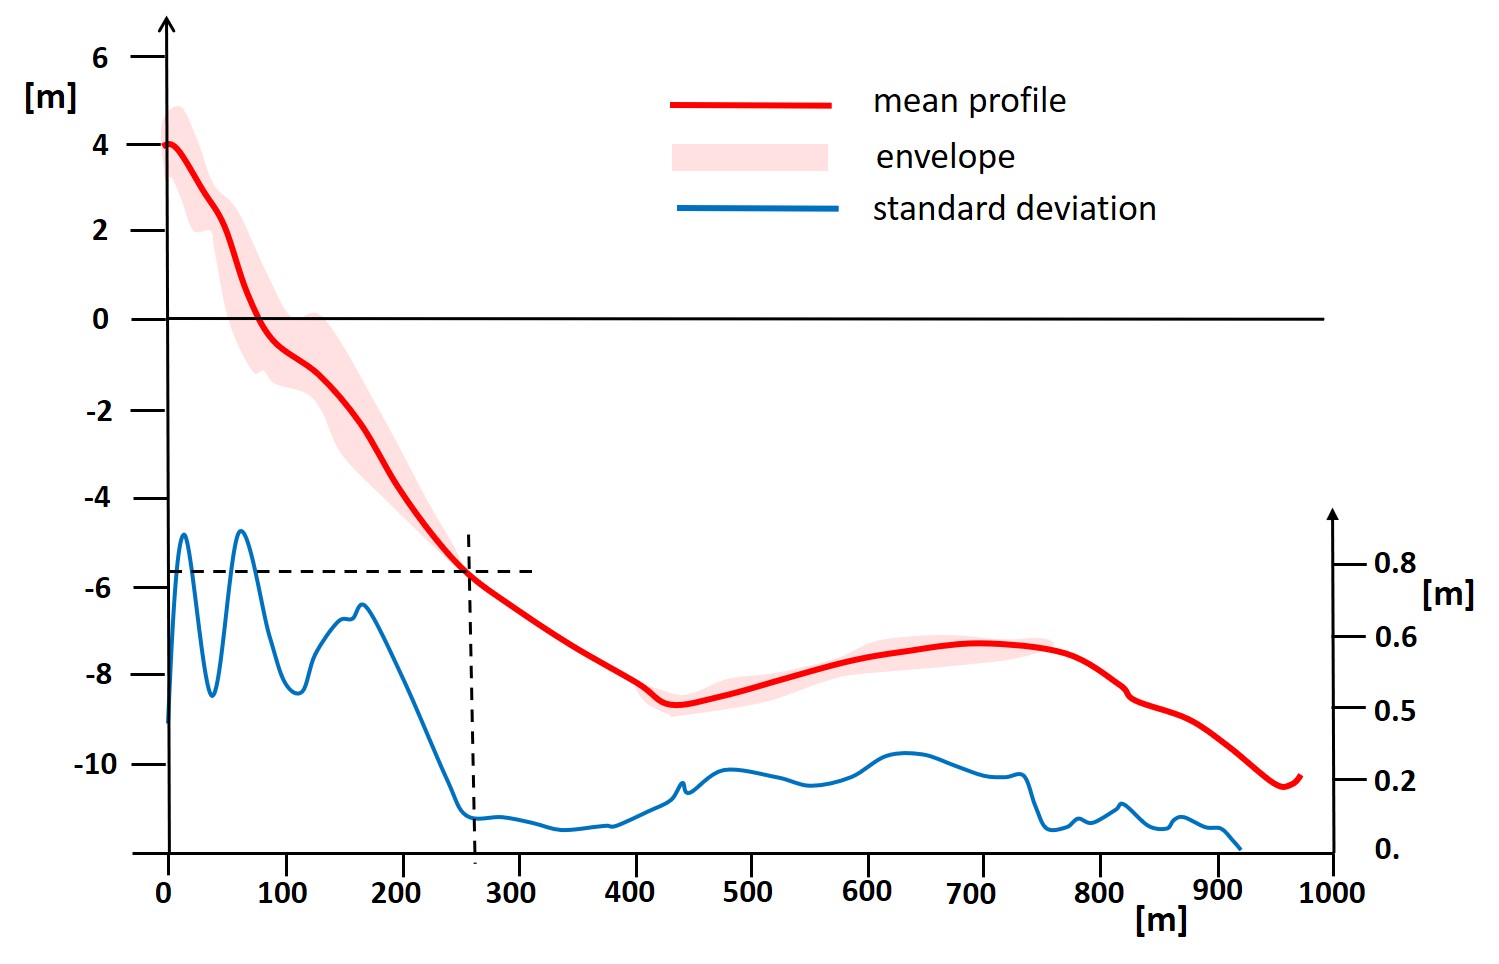
| 12:43, 12 June 2021 | OceanCityProfiles.jpg (file) |  |
114 KB | Mean, envelope and standard deviation of profile survey elevations 56th Street, Ocean City, Maryland, from Krauss et al. (1998). | 1 |
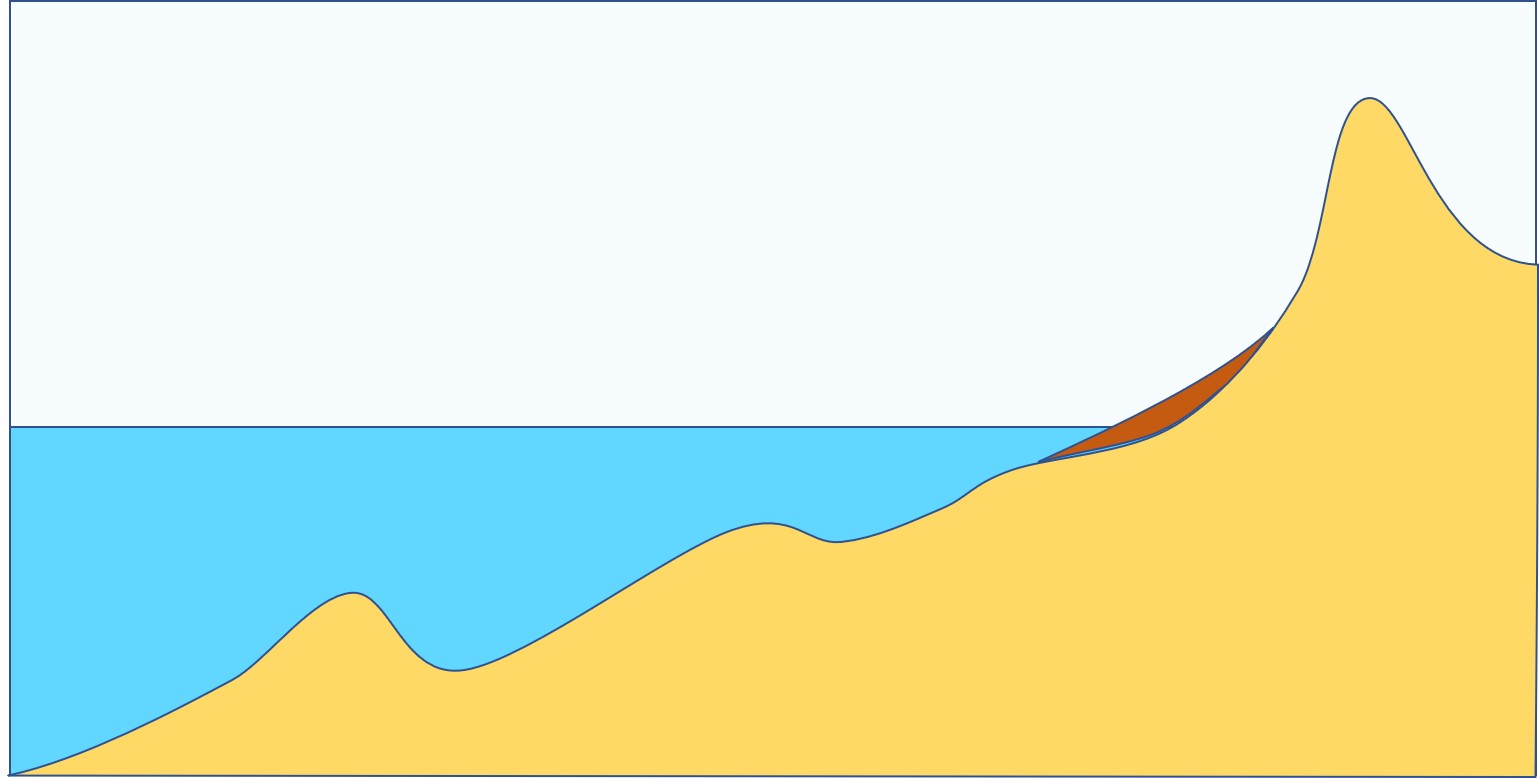
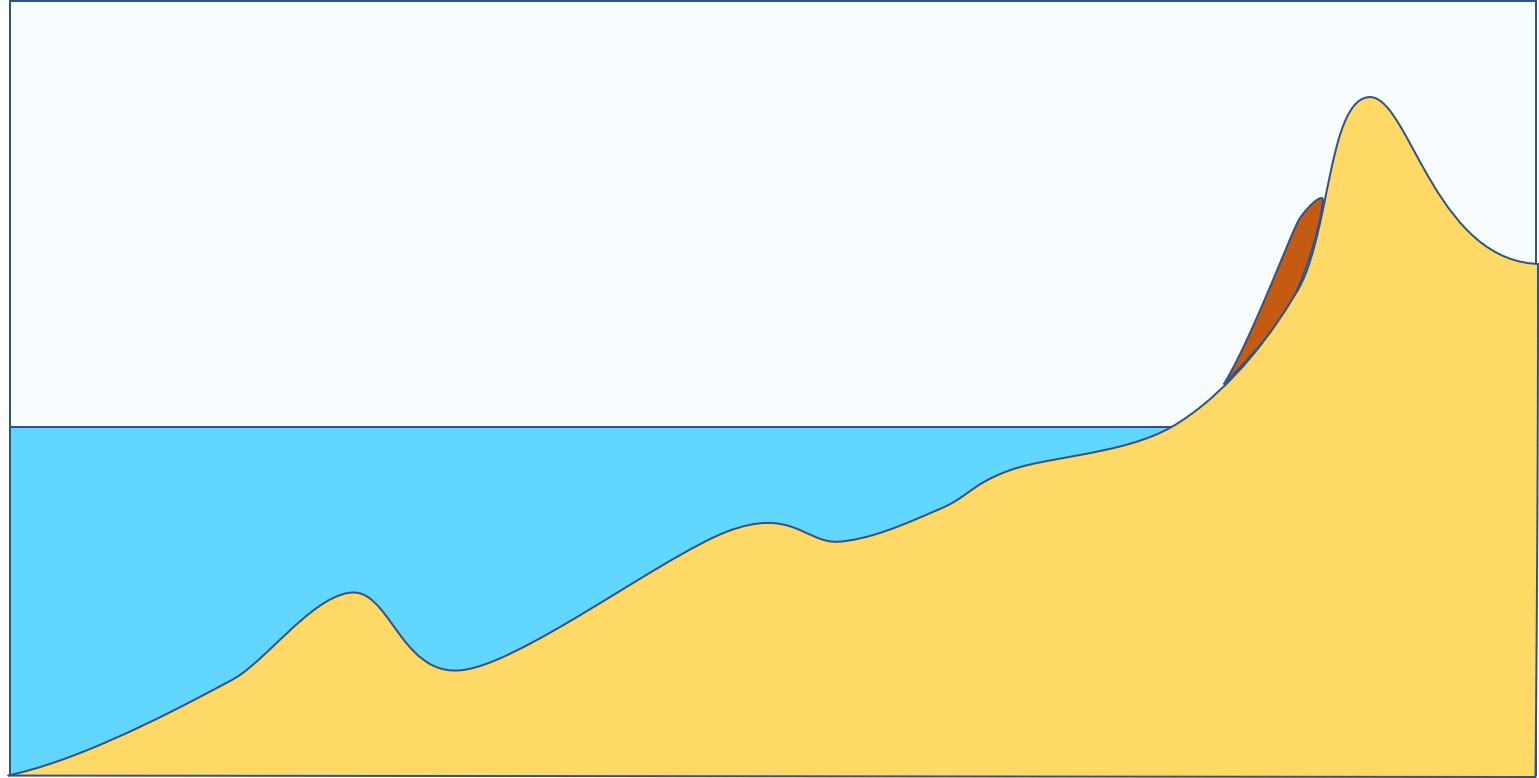
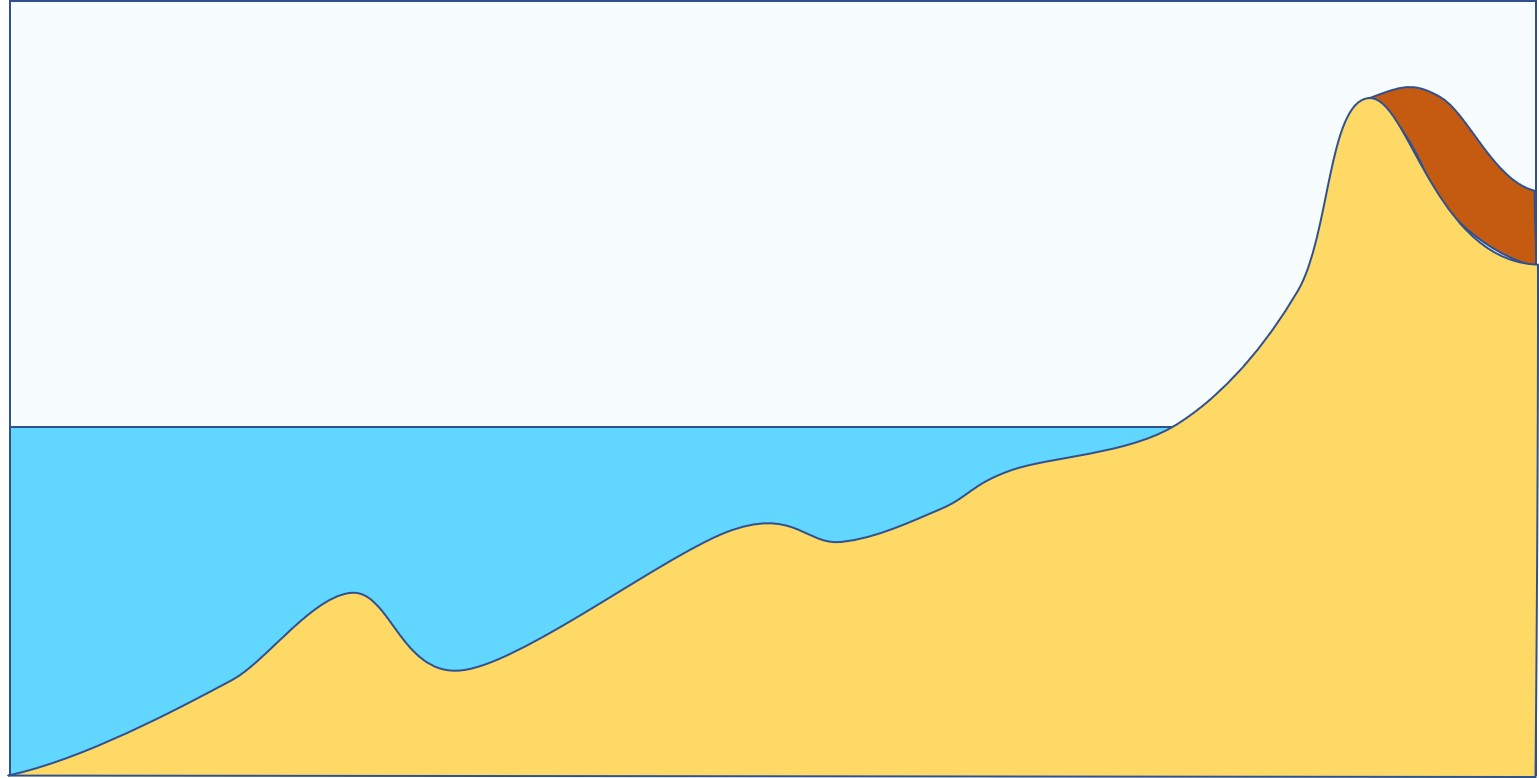
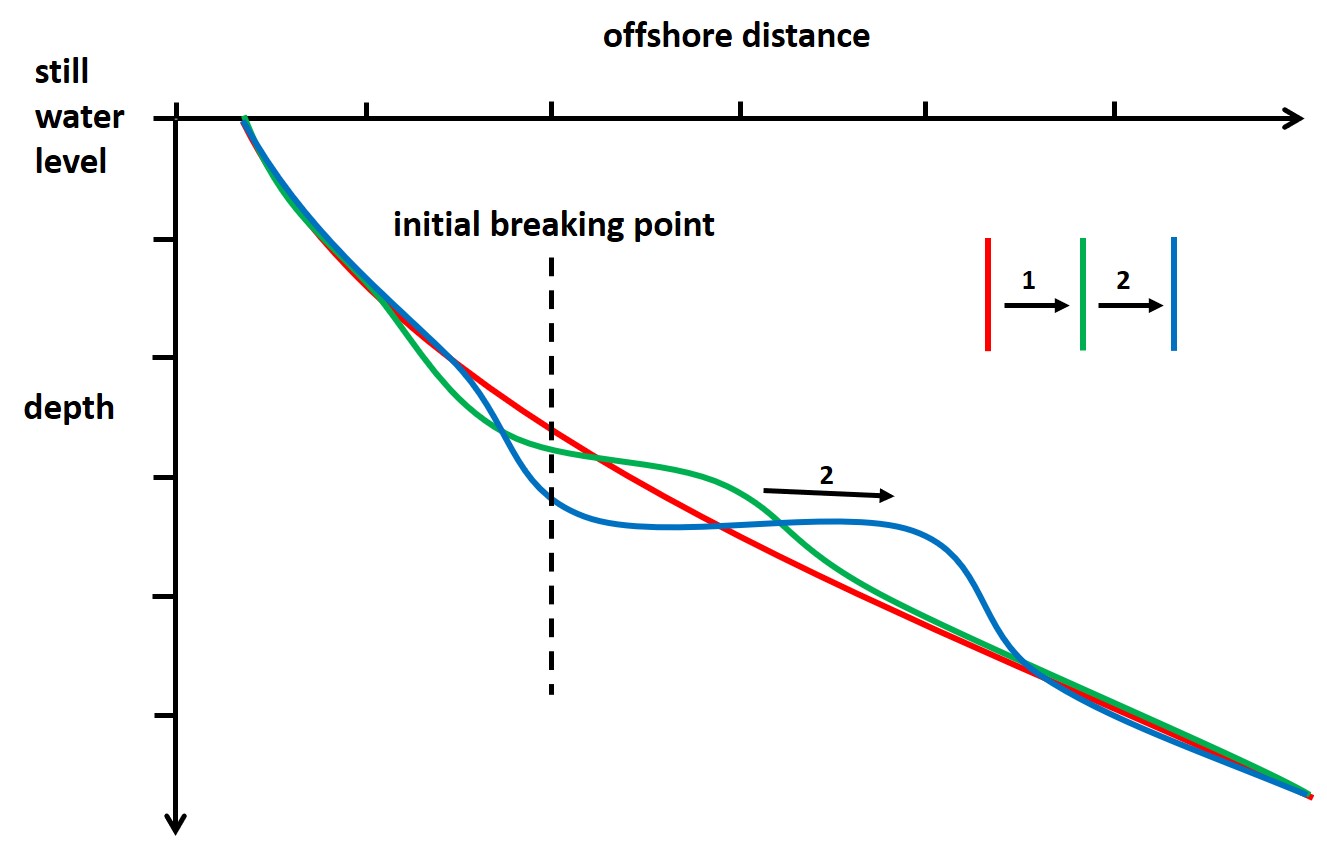
| 21:17, 1 June 2021 | BarFormation.jpg (file) |  |
82 KB | Profiles (green and blue) schematically representing two successive stages of bar formation by wave breaking on an initially non-barred shoreface (red). | 1 |
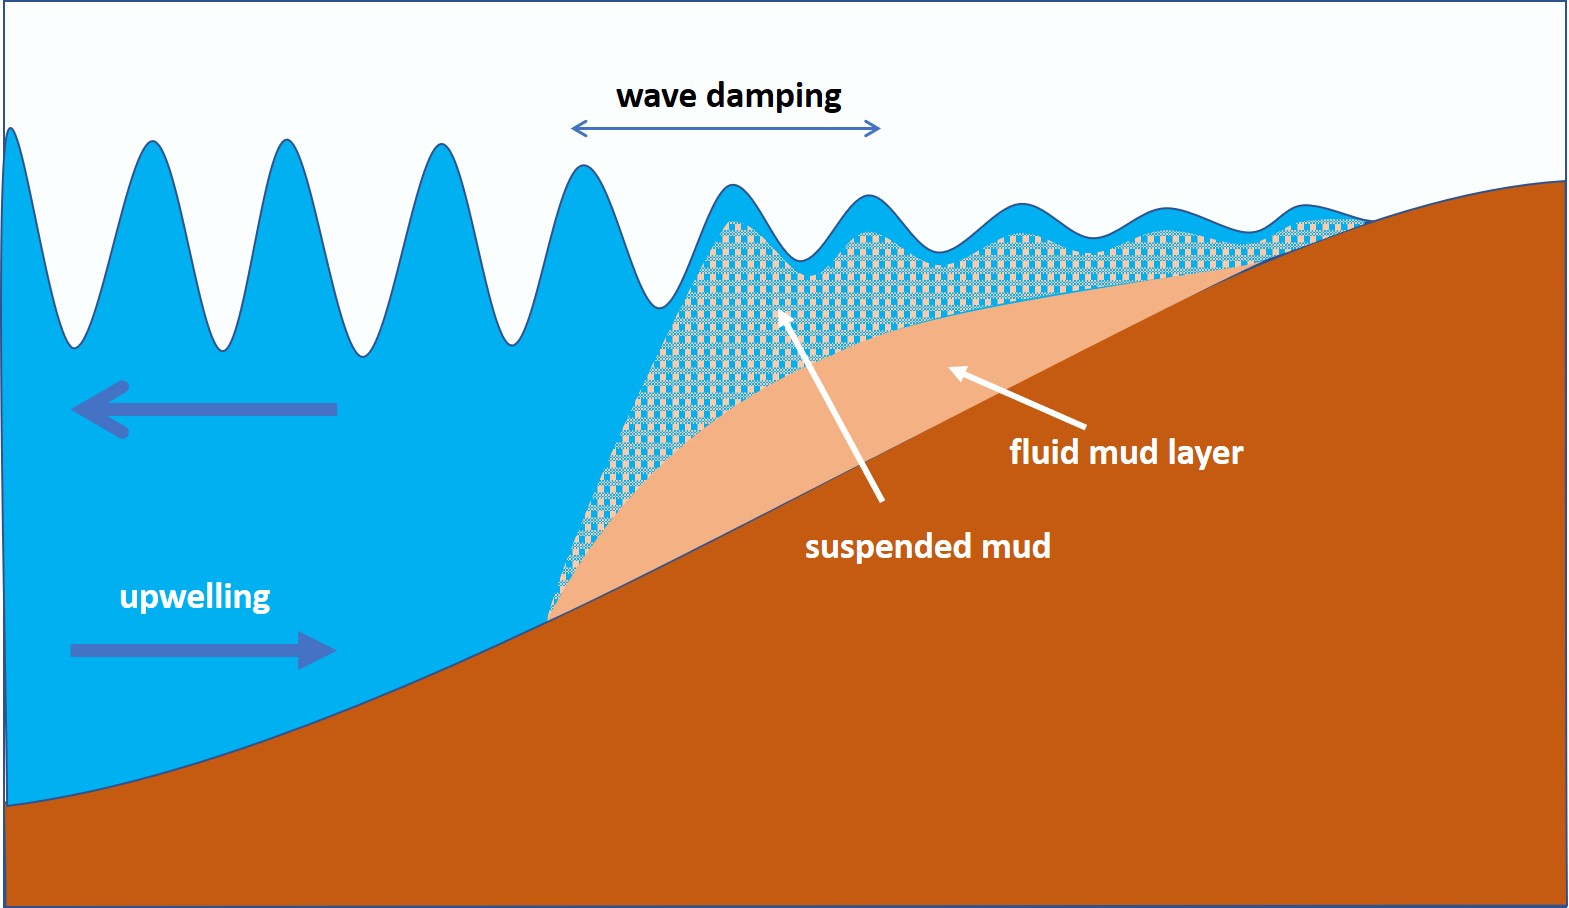
| 15:29, 15 May 2021 | FluidMudWaveDamping1.jpg (file) |  |
138 KB | Schematic representation of wave damping by a fluid mud layer (strongly exaggerated vertical scale). | 1 |
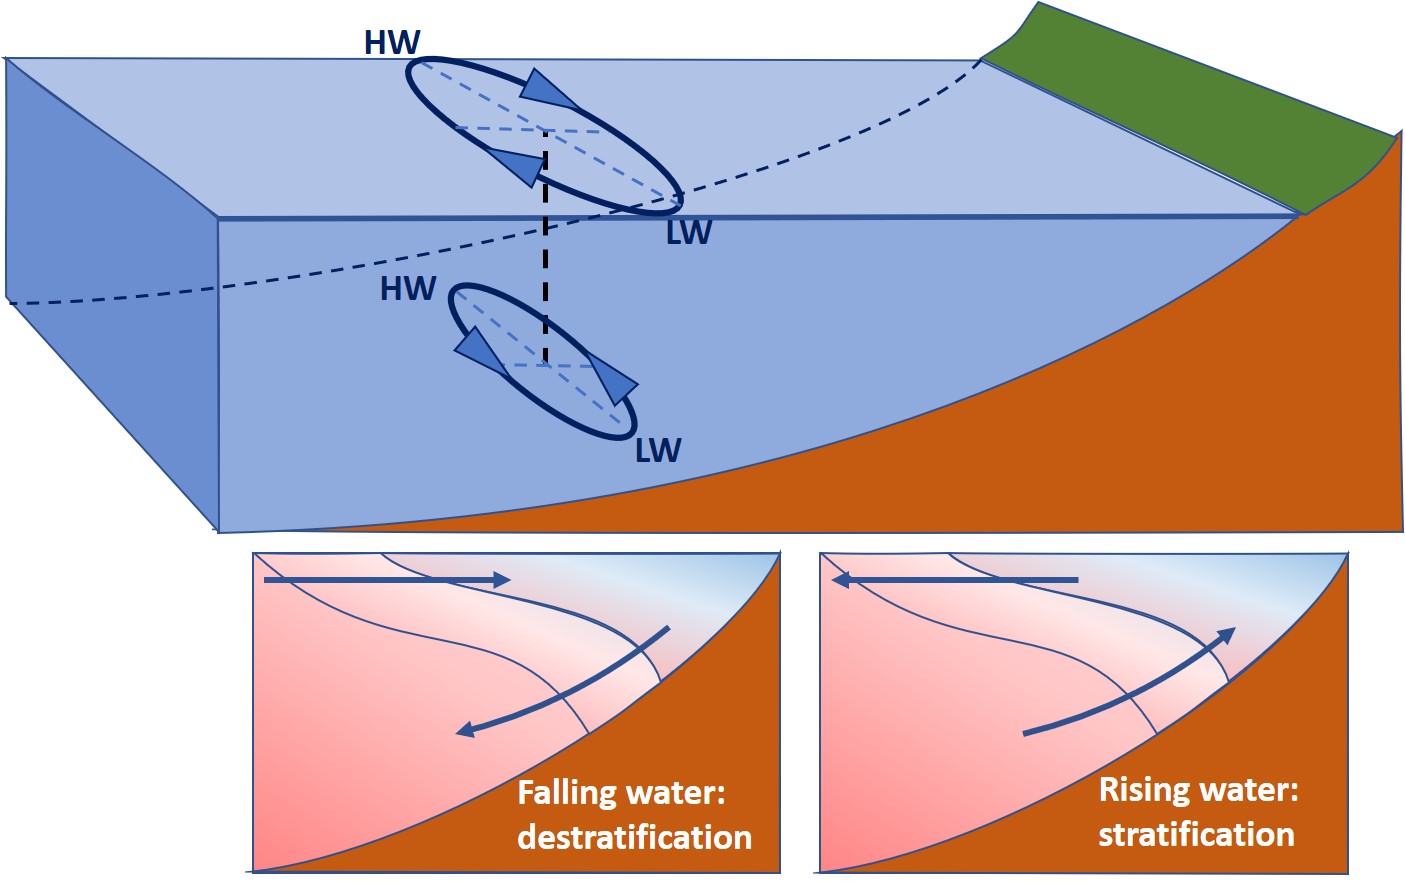
| 13:01, 14 May 2021 | GeoTidalStraitication.jpg (file) |  |
131 KB | Top: Near-surface and near-bottom current ellipses of a progressive longshore tidal wave. Bottom: Resulting tilting of haloclines during falling tide and rising tide. | 1 |