Common biomarkers for the assessment of marine pollution
Contents
Introduction
The use of biomarkers stands for a fundamental approach in the assessment of ecosystem health. It might allow the detection of early biological changes, which may result in long-term physiological disturbances. Mussels, such as Mytilus spp and other marine bivalves, as well as fishes (Mullus sp., Platichthys flesus L., Zoarces viviparus, Perca sp.) are widely used in both, field and laboratory experiments as sensitive bioindicators of trace metal or organic substances contamination. [1] [2] [3] [4] [5] [6] [7] The choice of molluscs in monitoring programs is taken on the basis of their wide geographic distribution, their non-complicated availability in the field and aquacultures, while in the case of fishes, even though there are logistic problems related to the cost of sampling, caging, transportation, etc, the importance of their use is linked to their key position in the trophic chain and their high commercial value.
Contrary to chemical monitoring, which principally evaluates the presence of pollutants in cells and tissues using chemical analyses, biomonitoring methods evaluate not only the presence, but what is more significant, the response of the organisms to these pollutants assessing their effects at the molecular, cellular, tissue/organ, and organism level. The use of biomarkers does not replace chemical monitoring or strategies using population studies, but it integrates them providing an unique contribution in determining the toxicity of pollutants, even when they are present at low, sub-lethal concentrations.
Initial studies concerning the toxic effects of pollutants on the cell structure and function showed changes on cell compounds, such as lysosomes, lipids inclusion, peroxisomes etc., as well as on physiological responses, for example the reproductive performance of the animals. The progression and the advances of aquatic toxicology in the recent years allowed the development of biomonitoring strategies that employed sentinel organisms and biomarkers. Two main features characterize the biomonitoring techniques regarding their suitability for usage by large research projects (for example MED POL of United Nations, BEEP project of EU, etc.). The first is their low coast combined to relatively non-complicated and non-expensive research equipments and the second and most important, their proposal and use by many researchers and laboratories.
Below are listed in some detail examples of suitable biomarkers to be utilized on bivalves or fish as sentinel organisms:
Biomarkers of stress
Usually this class includes biomarkers related to the general physiological stress that the organisms undergo due to a wide range of pollutants, i.e., the biomarkers of this class are not specific. ‘Lysosome membrane stability in cryosections’, [8] [9] ‘lysosome membrane stability-neutral red retention time’, [10] ‘oxidative stress / lipofuscin lysosomal content’ [11] [12] [13] and ‘neutral lipid accumulation’ are the main biomarkers of this category.
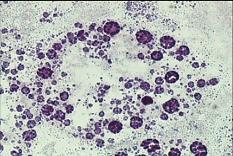
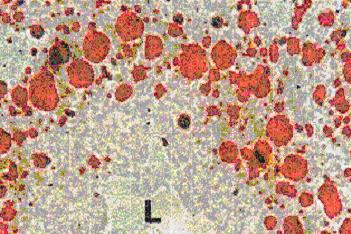
The application of these biomarker needs histochemical / cytochemical approach and frozen sections, giving so an advantage related to the possibility to analyse a number of other parameters in parallel, such as lipofuscin and unsaturated neutral lipids contents (see figure above), as well as changes in basic proteins in situ.

A characteristic example of this class is ‘lysosomal membrane stability in cryosections’ (LMS). [14] [15] The biomarker is related to changes due to pollution in the membranes of the lysosomes, which constitute main sites of toxic metal and organic pollutant’s sequestration and detoxification. [16] [17] This biomarker is mainly applied on digestive gland cryosections of mussels and is based on the cytochemical detection of the lysosomal enzyme N-acetyl-β-hexosaminidase and on the time of acid labilization treatment required to produce lysosomal maximum staining intensity (see figure below). Minor values of the technique characterize relatively polluted marine areas, while higher ones less polluted areas.
Biomarkers of genotoxicity
DNA damage
Usually includes biomarkers related to the single and double strand breakages, modified bases, DNA-DNA crosslinks, and DNA-protein crosslinks. ‘Alkaline elution’ and ‘COMET assay’ are two of the well known biomarkers of this category. [18] [19] [20] [21] [22] [23] [24]
Micronucleus Test
The ‘micronucleus test’ (MN) is a well known cytogenetic technique commonly used for the evaluation of genotoxic effects caused by environmental stressors. Micronuclei are formed during cell division when complete or fragment chromosomes fail to be incorporated in the daughter nuclei, forming so small or more additional nuclei. The test consists in the scoring of cells containing one or more cytosolic micronuclei in addition to the main nucleus and has been applied in wild and caged marine invertebrates, [25] [26] [27] [28] as well as in in different cell types of fishes. [29] [30] [31]
Biomarkers of exposure
Usually includes biomarkers whose changes can be related to the organism exposure to a specific class of pollutants, i.e. the biomarkers of this class are specific. Tissue ‘levels of metallothioneins’, [32] [33] [34] ‘inhibition of cholinesterase activity’, [35] [36] [37] ‘peroxisomal proliferation, [38] [39] ‘mixed function oxygenases’, [38] [39] and ‘EROD activity’ [40] are the main biomarkers of this category.
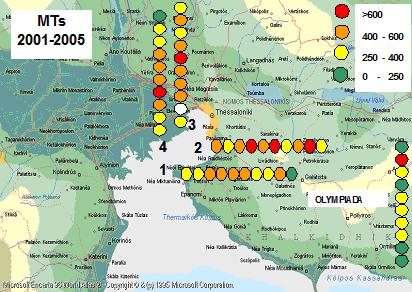
As an example, ‘levels of metallothioneins’ (MTs) refer to low-molecular-weight cytosolic proteins rich in sulphyhydryl (-SH) residues, with a high affinity for IB and IIB metal ions. These metalloproteins are normally expressed in animal tissues and are involved in heavy metal homeostasis, while in environments with high metal concentrations are over-expressed, [34] [41] both in fish, and mussels. [34] [42] [43] Therefore, MTs have been regarded as an indicator of metal contamination and widely used as a tool for biomonitoring programs. [34]

Tissue Damage
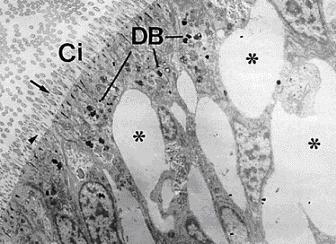
This class usually includes biomarkers whose changes can be related to morphological alterations suggestive of harmful changes due to contaminants, [44] [45] [46] [47] such as ‘thinning of the epithelium’, ‘increase in the number of epithelial basophil cells’, ‘changes in the ratio of basophil to digestive cells’, the ‘ratio between the lysosome/cytoplasm volumes’.
A reduction of the digestive epithelium thickness was the main difference between exposed and reference groups. A reduction or loss of digestive synchrony was also noted after exposure to pollutants. [45] Changes in the proportion of digestive tubule phases, thinning of the digestive epithelium and increased volume density of basophilic cells was noted in mussels exposed to the water accommodated fraction of different oils. [46] [47] Similarly, an increase in the number of epithelial basophil (secretory) cells was observed and the appearance of lipid vacuoles in both digestive and basophil cells.
Biomarkers at the organism level
This category refers to parameters able to indicate whether an effect at organism/population level is produced. The biomarkers ’stress on stress’ [48] [49] and the ‘scope for growth’ [50] [51] are the main representative of this class.
The effects of environmental stressors at the organism level can be evaluated also by the use of the simple biomarker ’stress on stress’, assessing whether contaminants have affected the capacity of molluscs to survive to environmental change, such as the air exposure. Its application is very simple and is calculated by the survival time when animals are exposed to air. [48] [49]
Reproductive performance and endocrine disruptors
This class refers to fundamental aspects of research related to the biological effects of pollutants, such as the gonad development related to the reproductive performance of the animals and endocrine disruptors, related to the interference of the hormonal pathway inside the cells.
Parameters assessing changes in gonad development are often used for both molluscs and fish studies. Biomarkers assessing gonad development (such as ‘simple gonad index’ or ‘changes in structure of gonad tissue’) are helpful, giving indications of the effects of pollution on the reproductive performance of animals. [52] [53] [54] [55] [56]
Concerning endocrine disruption, biomarkers such as ‘vitellogenin levels’, ‘zona radiata proteins’ [57] [58] and ‘steroid hormones balance’ [59] have been regarded as useful tools for an assessment of endocrine disruption caused by chemicals in fish. [60] [61]
Caging animals
Recent studies enhance the use of caged organisms in biomonitoring studies. Using caged organisms for 3-4 weeks (mainly mussels or fishes), the standardization of the results and the comparison of control organisms to animals collected from polluted sites is easier. Nowadays, a ‘2-tier approach’ has been proposed aimed at developing a cost-effective strategy which environmental agencies can afford. [61] The application of this approach comprises an initial screening of the various sampling station using a highly sensitive low-cost biomarker, such as lysosomal membrane stability (Tier 1). Only in the areas that an alteration in lysosomal stability has been established, the general stress of the animals is then to be assessed by utilizing the full battery of biomarkers (Tier 2). The data collected should be then run through an “expert system” [62] [63] software to obtain an objective assessment of the pollutant induced stress syndrome.
References
- ↑ Krishnakumar et al., 1994
- ↑ Regoli and Orlando, 1994
- ↑ Regoli and Orlando, 1994b
- ↑ Walsh et al., 1995
- ↑ Viarengo et al., 1997
- ↑ Regoli, 1998
- ↑ Lafontaine et al., 2000
- ↑ Moore, 1985
- ↑ Viarengo et al., 1987
- ↑ Lowe and Pipe (1994)
- ↑ George and Viarengo, 1985
- ↑ Viarengo, 1989
- ↑ Viarengo and Nott, 1993
- ↑ Moore, 1976
- ↑ UNEP/RAMOGE (1999)
- ↑ Moore, 1985
- ↑ Viarengo et al., 1987
- ↑ Batel et al., 1994
- ↑ Bolognesi et al., 1999
- ↑ Bolognesi et al 2004
- ↑ Bolognesi et al 2006
- ↑ Lee and Steinert, 2003
- ↑ Frenzilli et al., 2004
- ↑ Majone et al., 1990
- ↑ Majone et al., 1990
- ↑ Scarpato et al., 1990
- ↑ Bolognesi et al., 2004
- ↑ Al-Sabti and Metcalfe, 1995
- ↑ Arkhipchuk and Garanko, 2005
- ↑ Barsiene et al., 2006
- ↑ Viarengo et al., 1989
- ↑ Viarengo et al., 1989
- ↑ Viarengo et al., 1999b
- ↑ 34.0 34.1 34.2 34.3 Sturm et al., 1999
- ↑ Sanchez-Hernandez and Moreno-Sanchez, 2002
- ↑ Rodriguez-Fuentes and Gold-Bouchot, 2004
- ↑ Cajaraville et al., 2003
- ↑ 38.0 38.1 Orbea and Cajaraville, 2006
- ↑ 39.0 39.1 Omura and Sato, 1964
- ↑ Viarengo et al., 1989
- ↑ Bremner, 1987
- ↑ Webb, 1987
- ↑ Lowe et al., 1981
- ↑ Lowe 1988
- ↑ 45.0 45.1 Cajaraville et al. 1990
- ↑ 46.0 46.1 Cajaraville et al, 1992
- ↑ 47.0 47.1 Viarengo et al., 1995
- ↑ 48.0 48.1 Pampanin et al., 2005
- ↑ 49.0 49.1 Widdows and Donkin, 1992
- ↑ Widdows et al., 2002
- ↑ Lowe and Pipe, 1985
- ↑ Kime, 1995
- ↑ Minier et al., 2000
- ↑ Van der Oost et al., 2003
- ↑ Aarab et al., 2006
- ↑ Haux et al., 1988
- ↑ Spies et al., 1990
- ↑ Karels et al., 1998
- ↑ Armstrong, 1990
- ↑ Martin-Skilton et al., 2006
- ↑ 61.0 61.1 Viarengo et al., in press
- ↑ Viarengo et al., 2000
- ↑ Dagnino et al., in press


