Difference between revisions of "Gravel Beaches"
(→Morphology: +ref +ref) |
(→Hydrodynamics) |
||
| Line 106: | Line 106: | ||
<p> | <p> | ||
Another distinguishing characteristic is the high permeability of gravel which, compared to a sand beach, increases the potential for infiltration during the swash uprush and exfiltration during the swash downrush. This induces a downward, stabilising force on sediment movement during the uprush and a lift force during backwash. Conversely, there is a thinning of the boundary layer during uprush, leading to increased shear stress on the bed and a thickening during backwash, leading to deceased shear stress on the bed. This latter effect is thought to predominate. On a gravel beach the backwash volume can also be considerably reduced, lowering the backwash velocities (see Elfrink and Baldock (2002) <ref name="Elfink">Elfrink B, Baldock T. (2002) Hydrodynamics and sediment transport in the swash zone: a review and perspectives. Coastal Engineering, 45, 149–167.</ref> for a detailed review). It is these processes that lead to the formation of the high water mark berm. | Another distinguishing characteristic is the high permeability of gravel which, compared to a sand beach, increases the potential for infiltration during the swash uprush and exfiltration during the swash downrush. This induces a downward, stabilising force on sediment movement during the uprush and a lift force during backwash. Conversely, there is a thinning of the boundary layer during uprush, leading to increased shear stress on the bed and a thickening during backwash, leading to deceased shear stress on the bed. This latter effect is thought to predominate. On a gravel beach the backwash volume can also be considerably reduced, lowering the backwash velocities (see Elfrink and Baldock (2002) <ref name="Elfink">Elfrink B, Baldock T. (2002) Hydrodynamics and sediment transport in the swash zone: a review and perspectives. Coastal Engineering, 45, 149–167.</ref> for a detailed review). It is these processes that lead to the formation of the high water mark berm. | ||
| + | |||
| + | [[Image:Hydraulic_gradients.png|700px|center]] | ||
==References== | ==References== | ||
<references/> | <references/> | ||
Revision as of 15:07, 9 August 2012
Introduction
Gravel beaches are widespread around the world, including the USA, Canada, Japan, Argentina, New Zealand and the wave dominated coastlines of Northern Europe [1]. In the UK, about one third of the coastline is protected by such beaches [2].
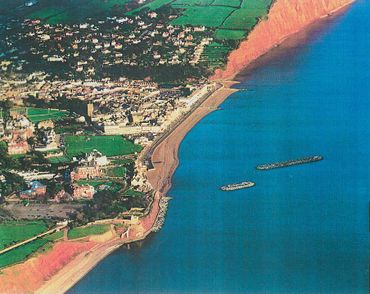
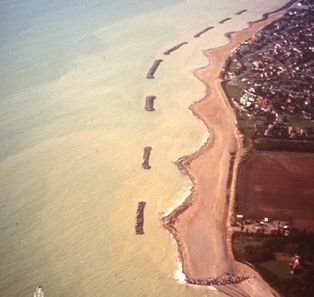
In coastal defence schemes, considerable use is made of coarse-grained (gravel) sediment to replenish eroding beaches, often in conjunction with structures such as rock or wooden groynes or offshore breakwaters. This is because such beaches are known to be an efficient form of natural coastal defence [3][4]. Two examples from the UK are those at Sidmouth, Devon and Elmer, West Sussex.
|
|
Contents
Research into the particular characteristics of gravel beaches and their engineering analysis is relatively new, with much of the progress being made recently. In the 1990’s small scale experimental measurements and early field studies lead to the subsequent development of parametric models for profile prediction, longshore transport and the stability of barrier beaches. Since 2002, two major large scale experimental studies and some new comprehensive field studies have been undertaken. Since that time, good progress has also been made in process based numerical modelling systems for long and cross shore transport.
The emphasis of the article is to present in a clear and concise manner the most relevant concepts, basic understanding and insights into the behaviour of gravel beaches, to provide a summary of the available engineering analysis techniques and modelling approaches and to provide guidance to further reading and a list of the most relevant references to work carried out since 1990.
Beach Origins
|
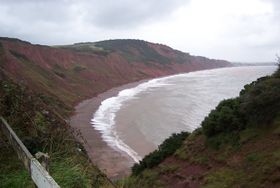
The current world’s coastlines were formed as a result of the last ice age, which ended about 10,000 years ago, see the beach management manual [5]. At that time large ice sheets covered more of the world’s land masses than they do at present. As they melted there was a rapid rise of sea level (about 120m between 20,000 and 6000 years ago). Vast quantities of sediment were carried by rivers to the sea during this period, eventually forming the pre-cursor to our present coastlines as the rate of sea level rise rapidly reduced about 6000 years ago. Much of our beaches today are composed of the remnants of these sediments, composed predominantly of sand and gravel. These sources of beach material have subsequently been supplemented by coastal erosion of soft cliffs and the reduced but continuing supply of sediments from rivers. Material has also been derived from offshore banks left behind by relatively rapid rises of sea level after cold episodes in the earth’s climate.
Sediment classification and properties

|

|

|
|
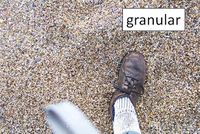
Traditionally sand and gravel sizes have been classified according to the Wentworth scale. This defines sand as being of diameter between 0.0625mm to 2mm. Material sizes larger than this are classified as gravel, subdivided into granular (2mm to 4 mm), pebble (4mm to 64 mm), cobble (64mm to 256 mm) and boulder (>256 mm). Rounded gravel, typical of a significant number of UK beaches, is referred to as shingle.
There are several physical properties of sand and gravel beaches which are important in the study of coastal sediment transport. The first is the sediment density (ρs), typically 2650 kg/m³ for quartz. The rest are required in recognition of the fact that a beach comprises a mixture of the beach material, interspersed with voids which may be filled with air or water. Thus the bulk density (ρb) is defined as the in situ mass of the mixture/volume of the mixture, the porosity (ps) as the volume of air or water/volume of the mixture, typically between 0.25 to 0.4 for a gravel beach, the voids ratio (e) as the volume of air or water/volume of the grains, typically between 0.33 to 0.66 for a gravel beach, and finally the angle of repose (Φ), which is the limiting slope angle at which the grains begin to roll, typically about 35° in air. In water this reduces to about 30°.
The material sizes on any particular beach will normally comprise a range of grain sizes, thus it is standard practice to measure the grain size distribution by a sieve analysis from which the percentage by weight of material passing through a range of sieve sizes is plotted against particle size. The median size is denoted by D50, representing the diameter for which 50% of the grains by mass are finer. The spread of sizes is often indicated by the values of D84 and D16 and their ratio is used to measure the degree of sorting. A well sorted sample is one in which there is a small range of sizes (D85/D16<2), whereas a well mixed sample has a large range of sizes (D85/D16>16).
Beach types
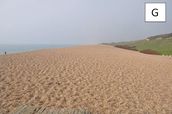
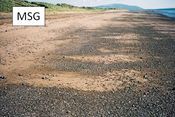
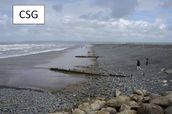
Beaches types may be categorised according to the mixture of sands and gravels present, which has a significant influence on the beach slope and the more general morphological response of the beach to wave action. Four categories are defined as pure gravel (G), mixed sand and gravel (MSG), composite sand and gravel (CSG) and pure sand (S).
|
|
|

|
Morphology
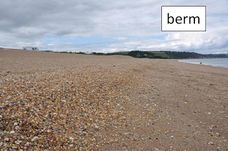
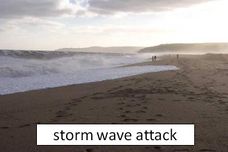
The characteristics of a gravel beach are very different from those of a sand beach. Most notably, gravel can support a steep gradient typically of the order of 1 in 8 with a tendency to form a near vertical berm towards the high water mark and a step at the wave break point. Swell wave conditions promote onshore accretion in the swash zone, with storm conditions promoting rapid offshore erosion. Despite the large grain size, the sediment is highly mobile. Changes in the vertical profile of the order of 0.5m are commonly found over just one tidal cycle for moderate to large waves [6].
|

|
|
|
|
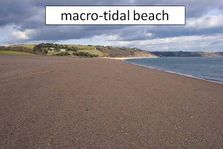
On macro-tidal beaches, the active swash zone continuously re-works the beach face as the tide rises and falls. At low tide, it is common to observe a berm at the high water mark of the beach below which is a beach face of uniform slope, which ends in the step feature at the low water mark.
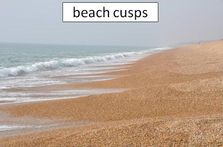
Cusp formation on gravel beaches is another distinctive feature. They can form rapidly when the wave approach is near normal, but are also washed out rapidly when the wave approach changes to an oblique angle. In the literature, two dominant models of cusp formation are recognised, namely edge wave forced and swash circulation/self organisation modes. However, cusp formation on gravel beaches has not been discussed very much in the literature [7].
Hydrodynamics
|
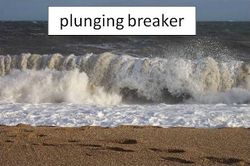
The steep beach gradient allows waves to progress much closer inshore before breaking, often resulting in a single plunging breaker. Consequently, there is minimal generation of infra-gravity waves. Even during storms, a wide surf zone is rare. An important consequence of this is that the swash zone can be of similar width to the surf zone and hence the sediment transport within the swash zone is of considerably more significance than on sand beaches. A second effect of the steep beach gradient is that refraction processes are also confined to a narrower zone than is experienced on a sand beach, with the result that refraction is often observed to be incomplete and the waves arrive at the beach face with some considerable angle, resulting in significant longshore transport. Gravel beaches are also much more reflective than sand beaches, with reflection coefficients of up to about 0.2.
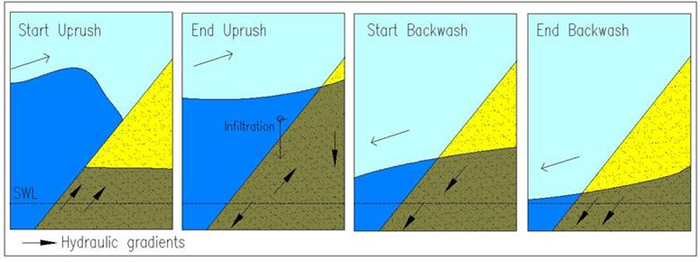
Another distinguishing characteristic is the high permeability of gravel which, compared to a sand beach, increases the potential for infiltration during the swash uprush and exfiltration during the swash downrush. This induces a downward, stabilising force on sediment movement during the uprush and a lift force during backwash. Conversely, there is a thinning of the boundary layer during uprush, leading to increased shear stress on the bed and a thickening during backwash, leading to deceased shear stress on the bed. This latter effect is thought to predominate. On a gravel beach the backwash volume can also be considerably reduced, lowering the backwash velocities (see Elfrink and Baldock (2002) [8] for a detailed review). It is these processes that lead to the formation of the high water mark berm.
References
- ↑ Buscome D., Masselink G. (2006). Concepts in gravel beach dynamics. Earth science Reviews 79 33-52.
- ↑ Fuller, R. M. & Randall, R. E. (1988). The Orford Shingles, Suffolk, UK. Classic conflicts in coastline management. Biological conservation.
- ↑ Powell, K. A. (1990). Predicting short term profile response for shingle beaches. HR Wallingford Report SR 219.
- ↑ Diserens, A. P. & Coates, T. T. (1993). UK South Coast shingle beach study: storm response of shingle beaches. HR Wallingford Report SR 323.
- ↑ CIRIA (2010). Beach management manual, Second Edition. Publication no. RP787, London.
- ↑ Van Wellen, E, Chadwick, A J and Mason, T (2000) A review and assessment of longshore sediment transport equations for coarse grained beaches. Coastal Engineering, 40, 3, 243-275.
- ↑ Anthony E. J. (2008). Gravel beaches and barriers. Developments in Marine Geology, Vol 4, 289-324.
- ↑ Elfrink B, Baldock T. (2002) Hydrodynamics and sediment transport in the swash zone: a review and perspectives. Coastal Engineering, 45, 149–167.
