File list
This special page shows all uploaded files.
| Date | Name | Thumbnail | Size | Description | Versions |
|---|---|---|---|---|---|
| 21:42, 30 June 2017 | ChadwickFig15e.jpg (file) |  |
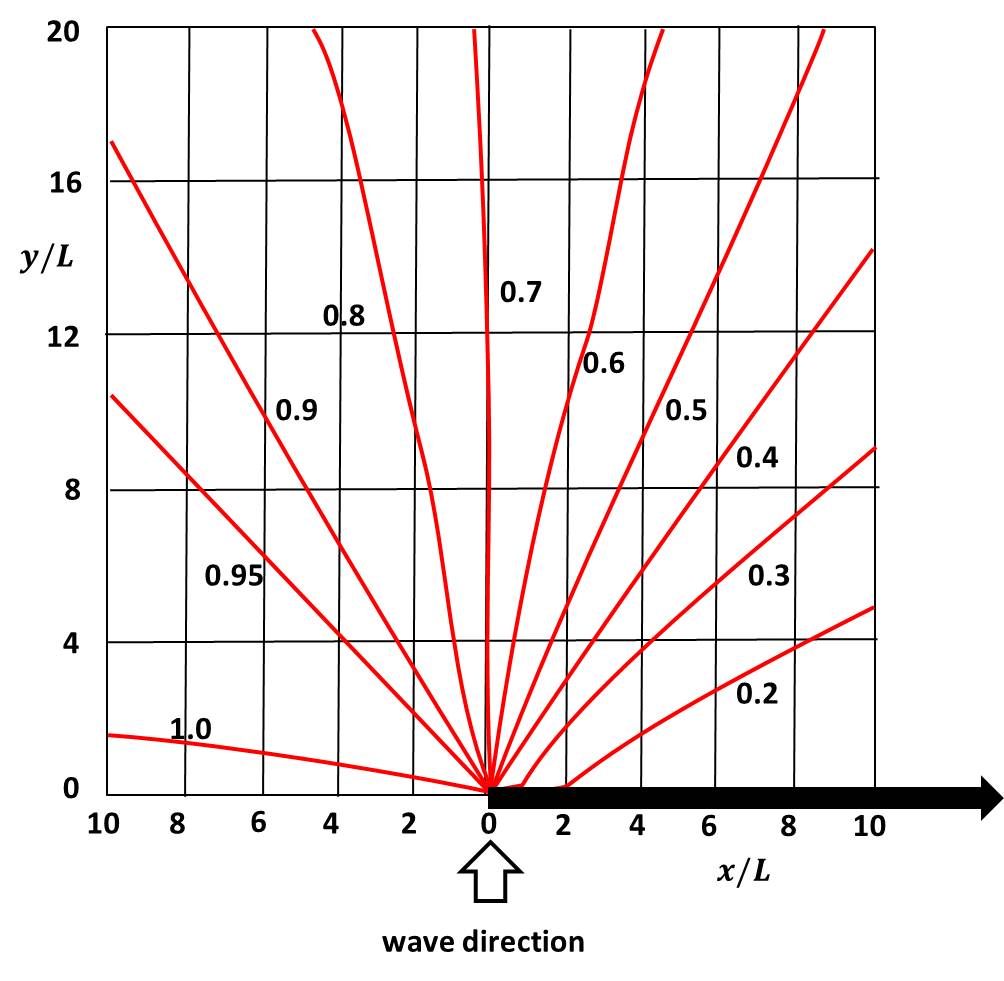
89 KB | Diffraction (ratio of diffracted wave height and incident wave height) of a normally incident directional random sea state for a semi-infinite barrier. | 1 |
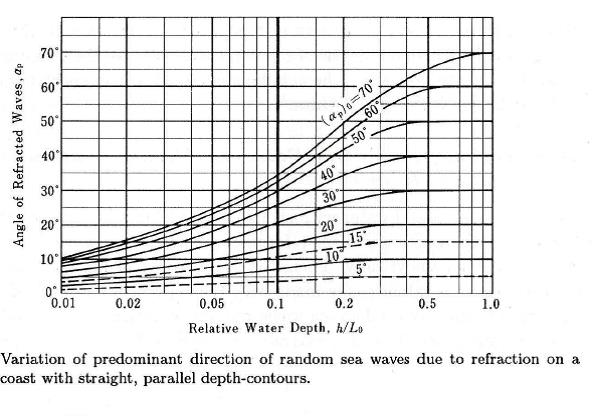
| 21:41, 30 June 2017 | ChadwickFig10NEW.jpg (file) |  |
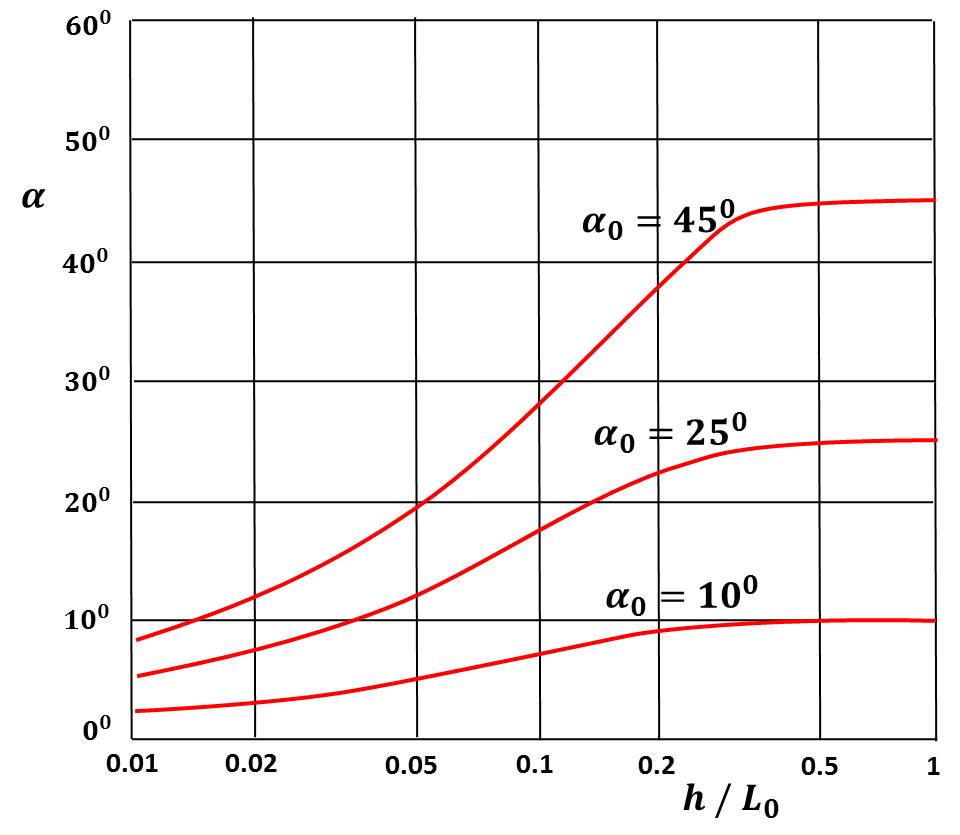
58 KB | Some of Goda’s results for the predominant wave direction at a range of relative depths for a typical wind wave state and different predominant wave incident angles at deep water. | 1 |
| 21:39, 30 June 2017 | ChadwickFig9b.jpg (file) |  |
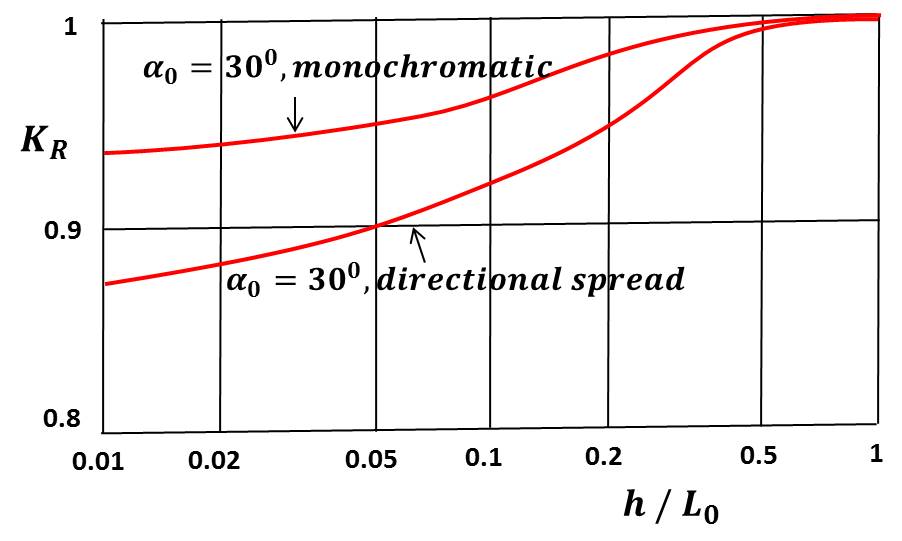
42 KB | Comparison of results for the diffraction coefficient between a monochromatic wave and Goda’s result for a directional spectrum of a typical wind wave state. | 1 |
| 21:37, 30 June 2017 | ChadwickFig9a.jpg (file) |  |
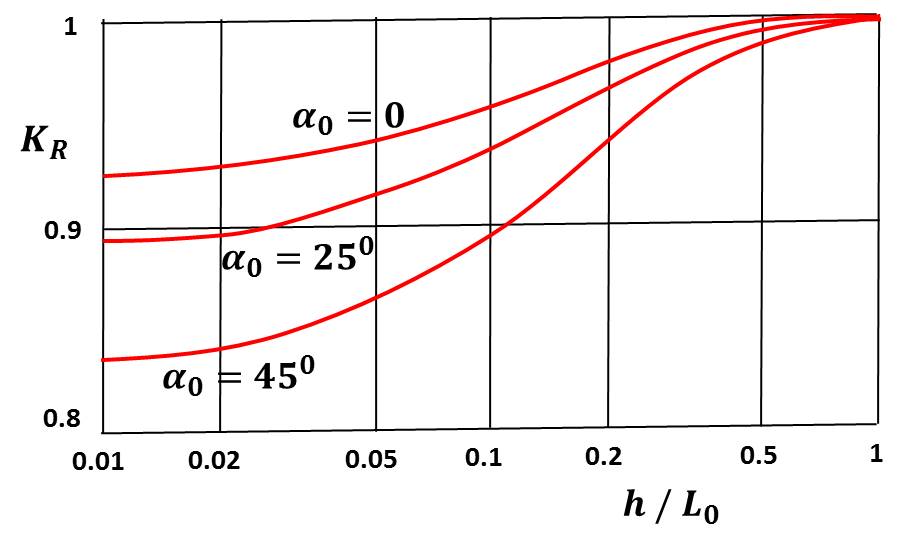
41 KB | Some of Goda’s results for the diffraction coefficient as a function of relative depth for a typical wind wave state and different predominant wave incident angles at deep water. | 1 |
| 15:34, 6 June 2017 | ChadwickFig20NEW.jpg (file) |  |
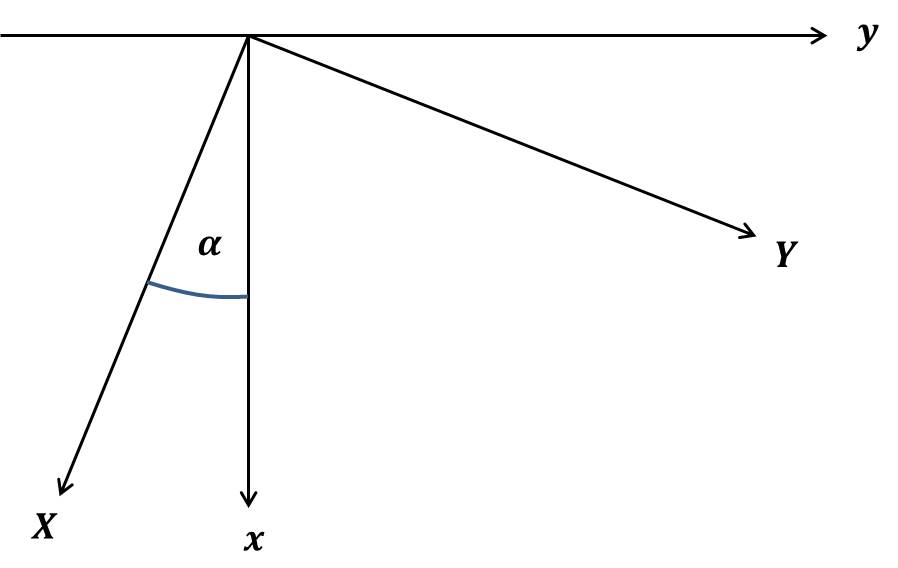
19 KB | Relationships between principal axes and shoreline axes. | 1 |
| 10:11, 6 June 2017 | ChadwickFig20.jpg (file) |  |
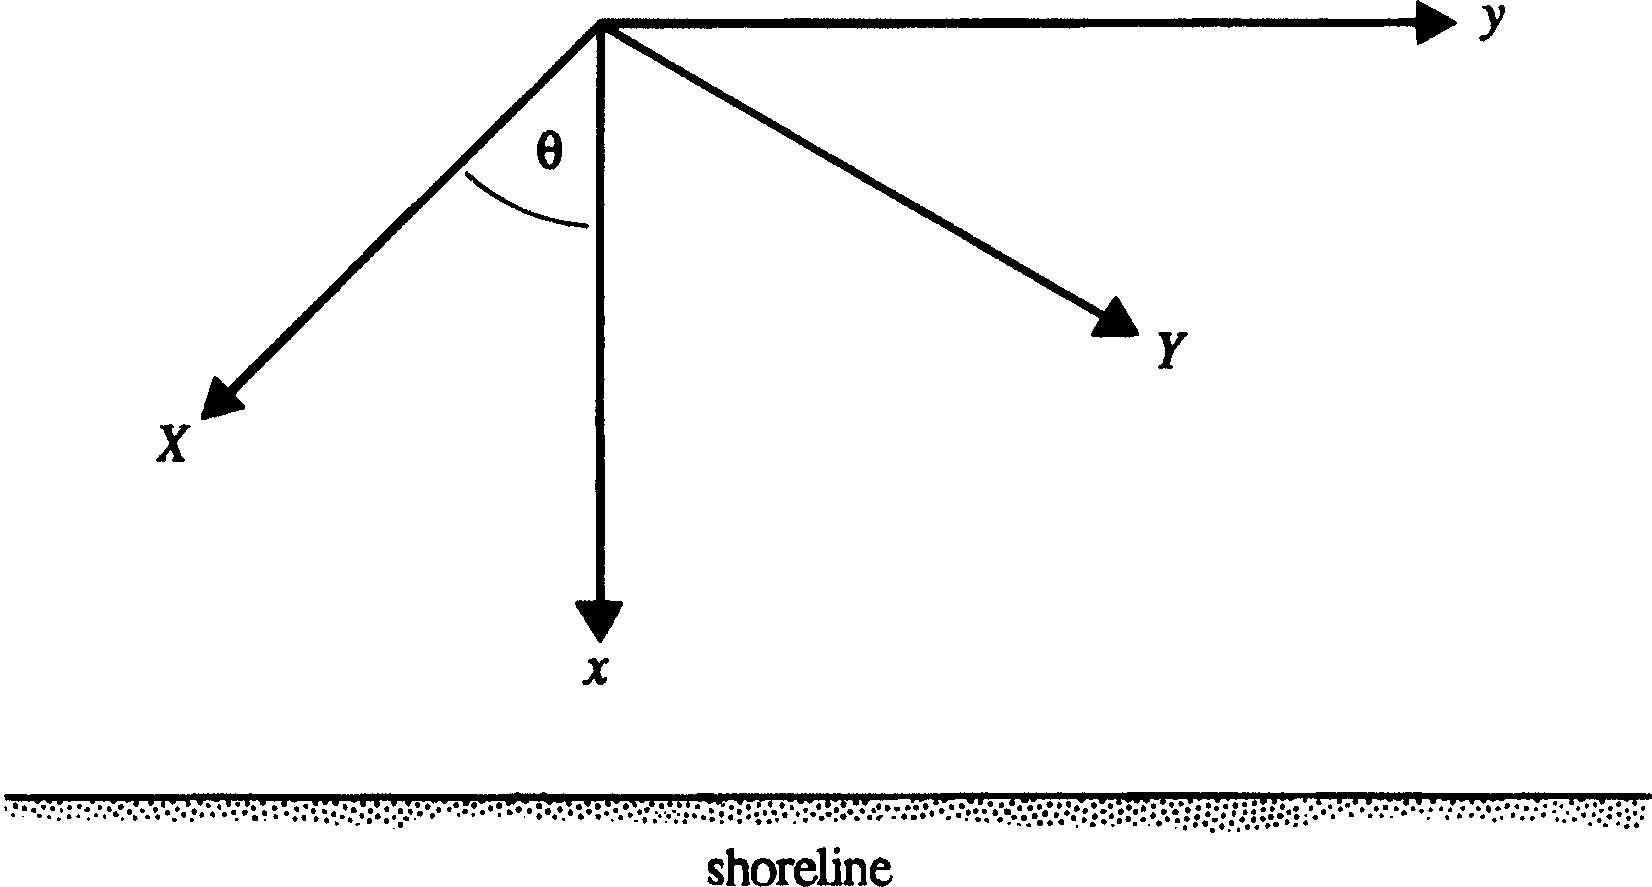
78 KB | Relationships between principal axes and shoreline axes. | 1 |
| 10:10, 6 June 2017 | ChadwickFig19.jpg (file) |  |
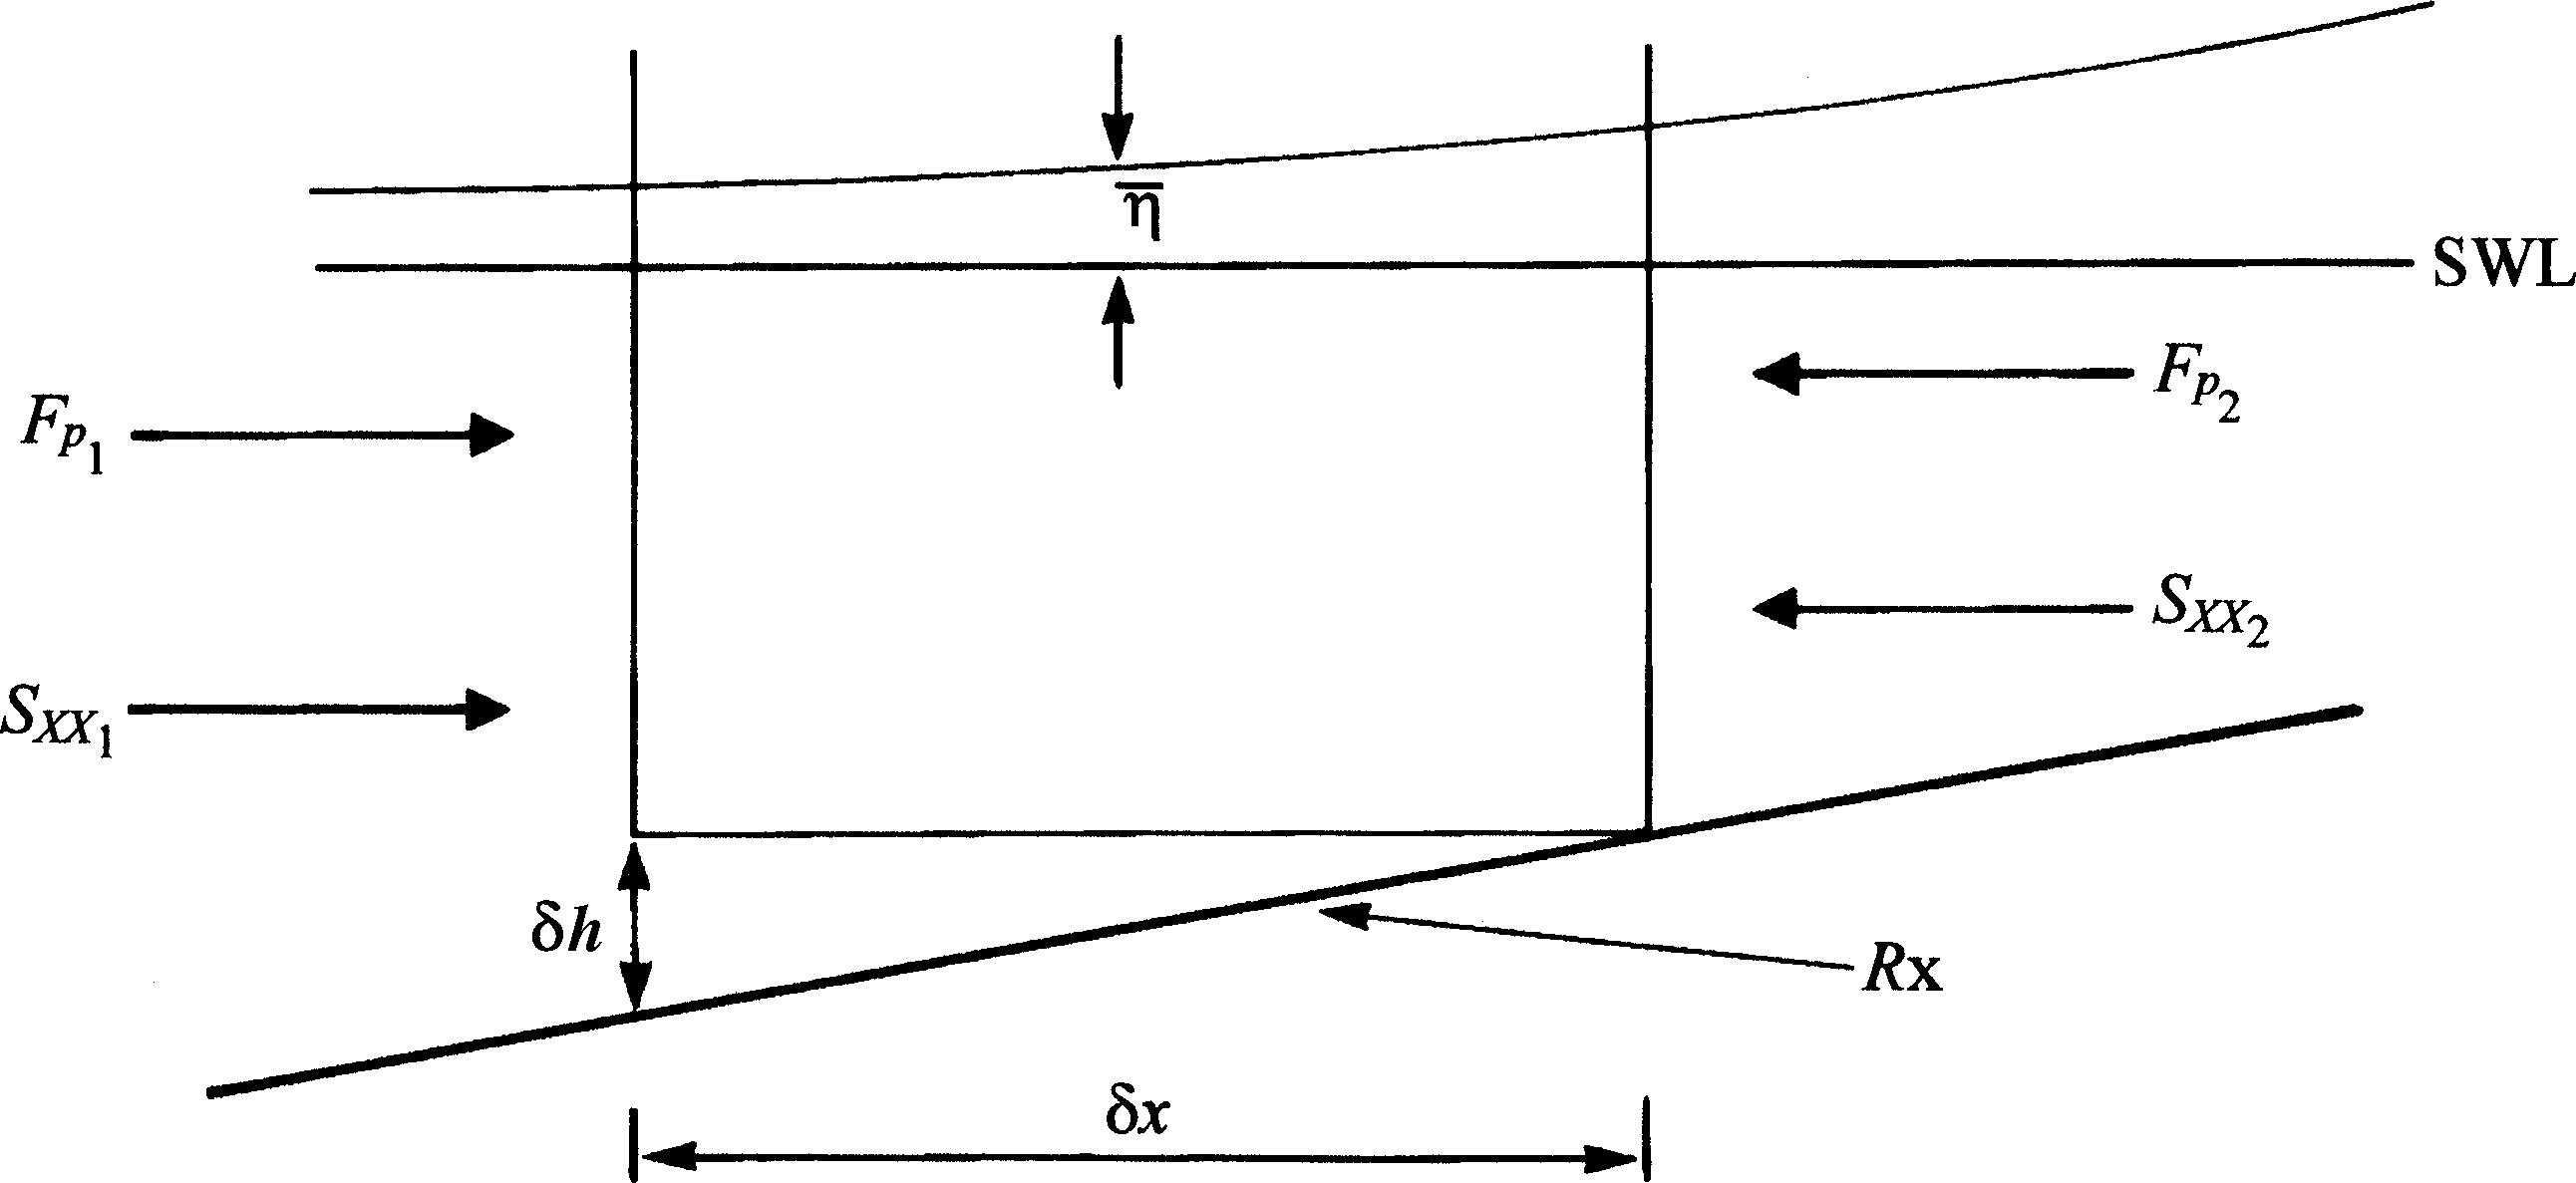
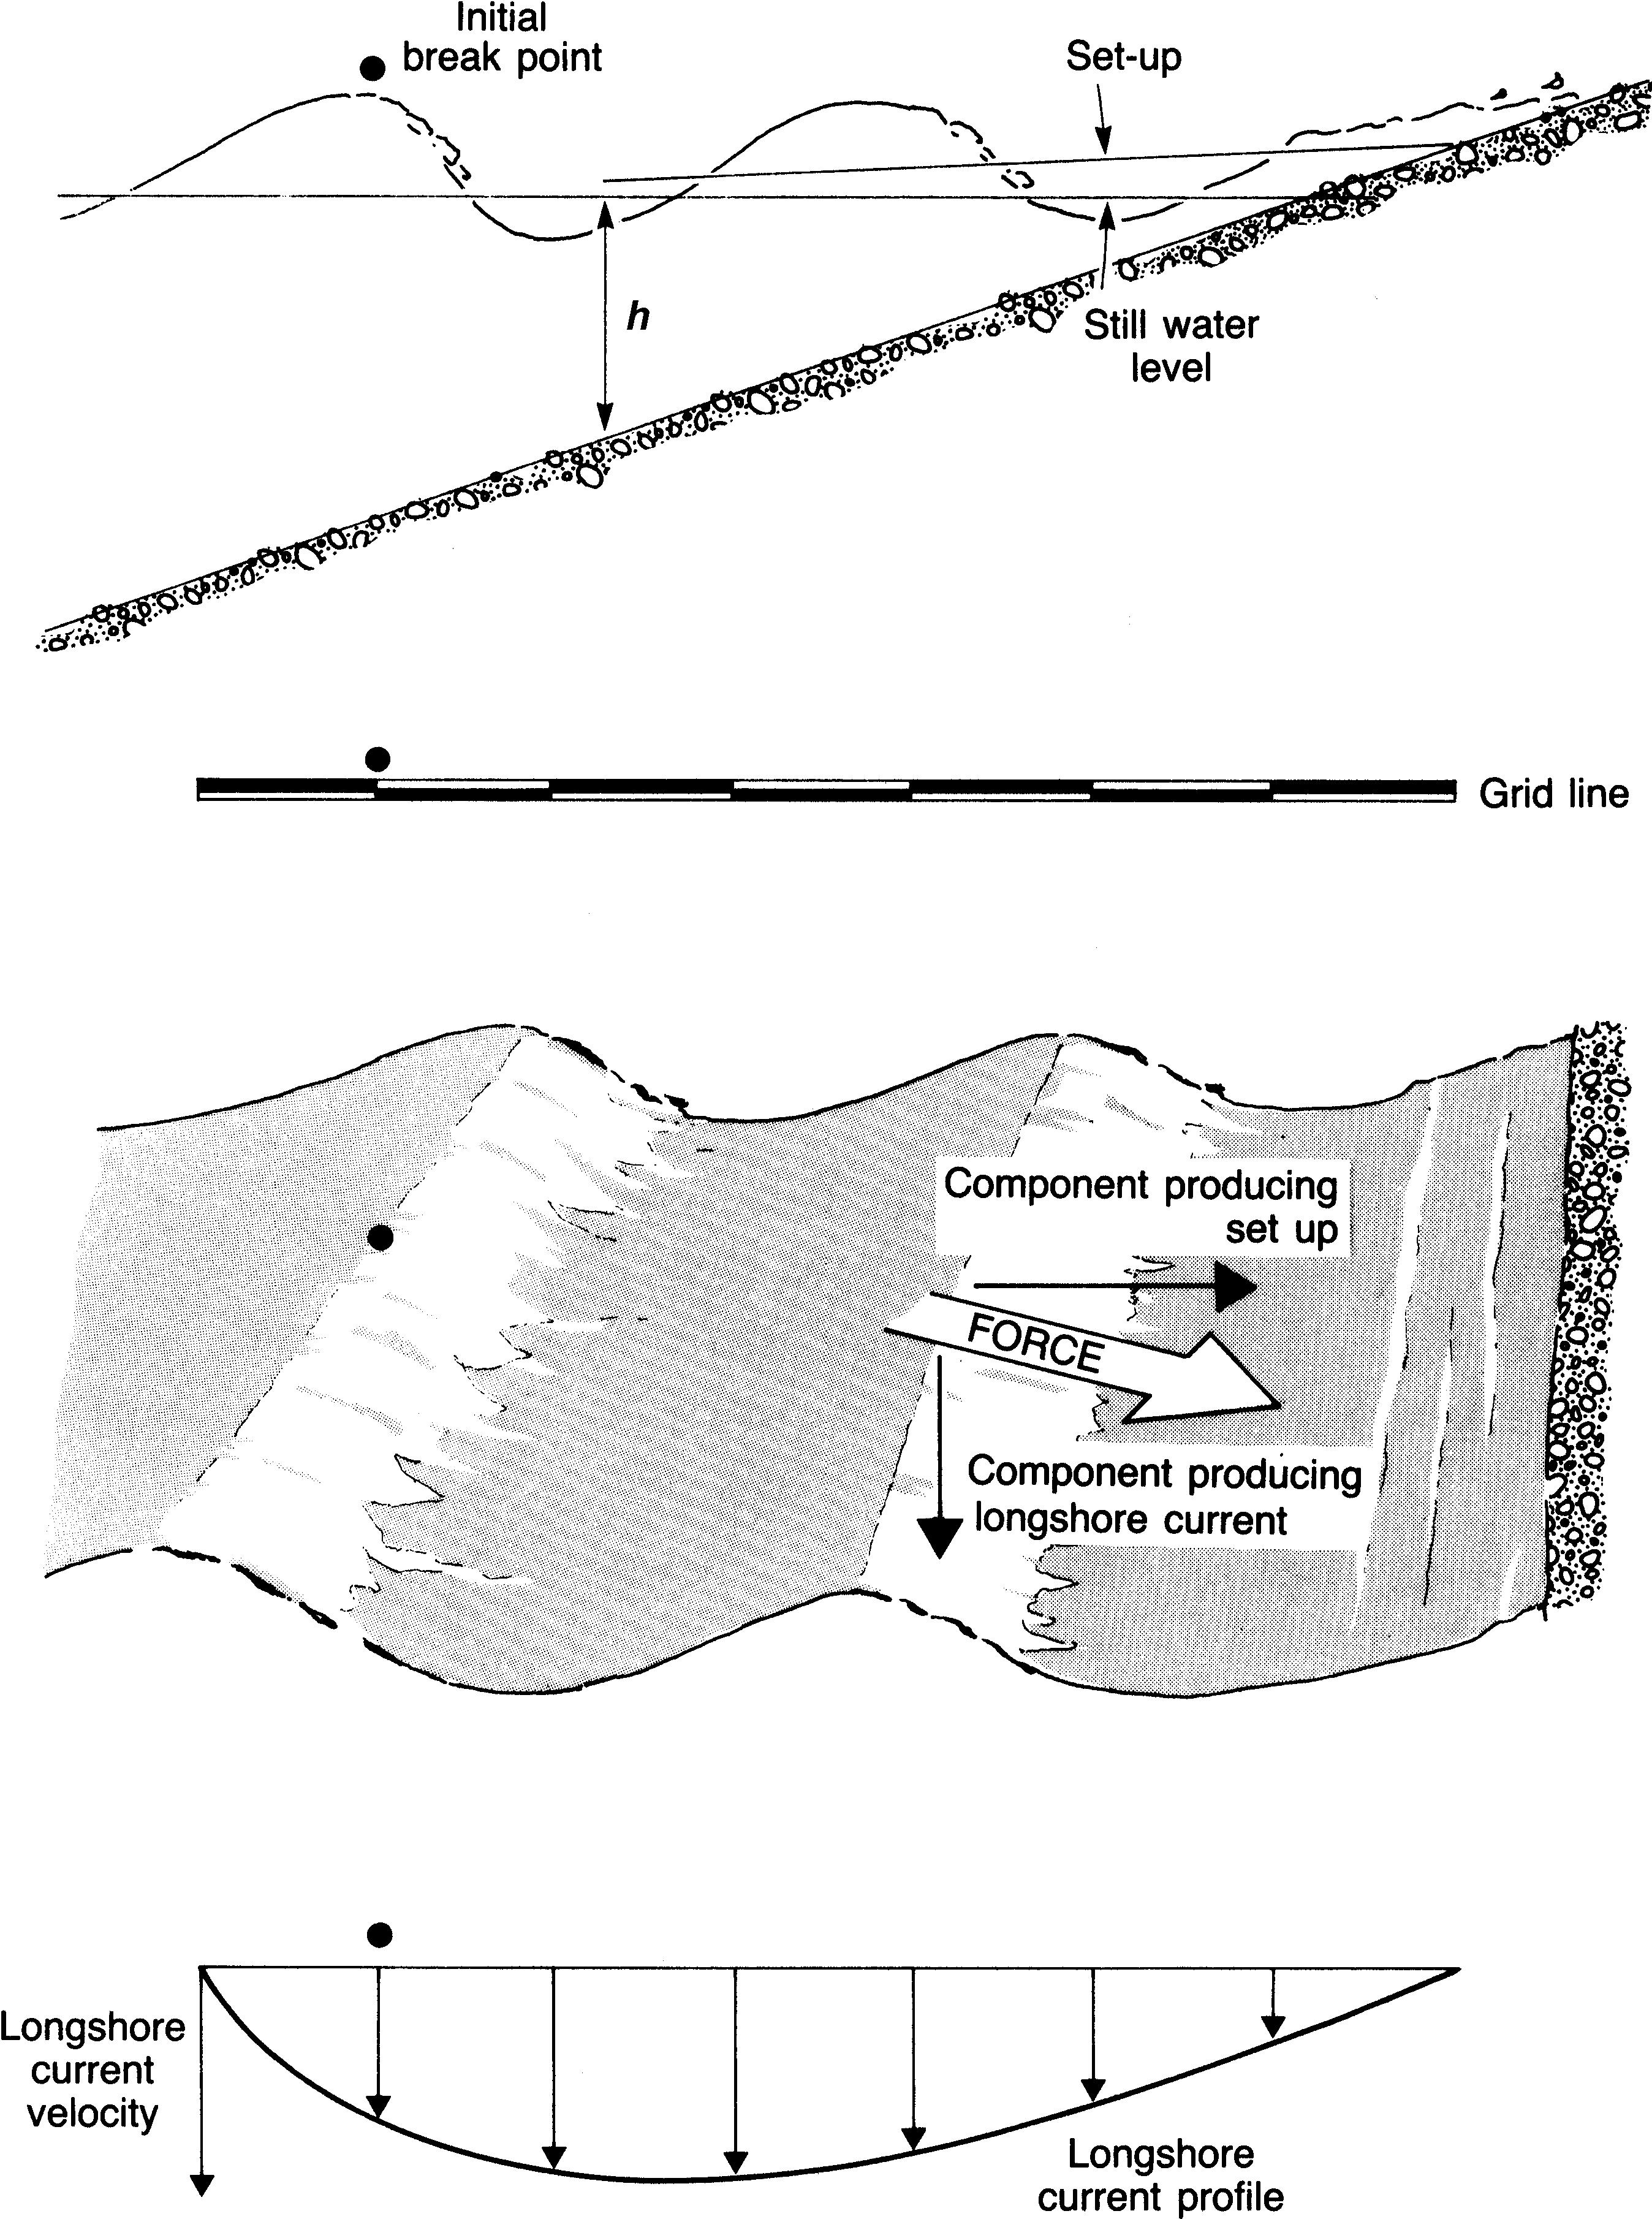
143 KB | Diagram for derivation of wave setdown/setup. | 1 |
| 10:08, 6 June 2017 | ChadwickFig18c.jpg (file) |  |
141 KB | Example of a plunging breaker. | 1 |
| 10:08, 6 June 2017 | ChadwickFig18b.jpg (file) |  |
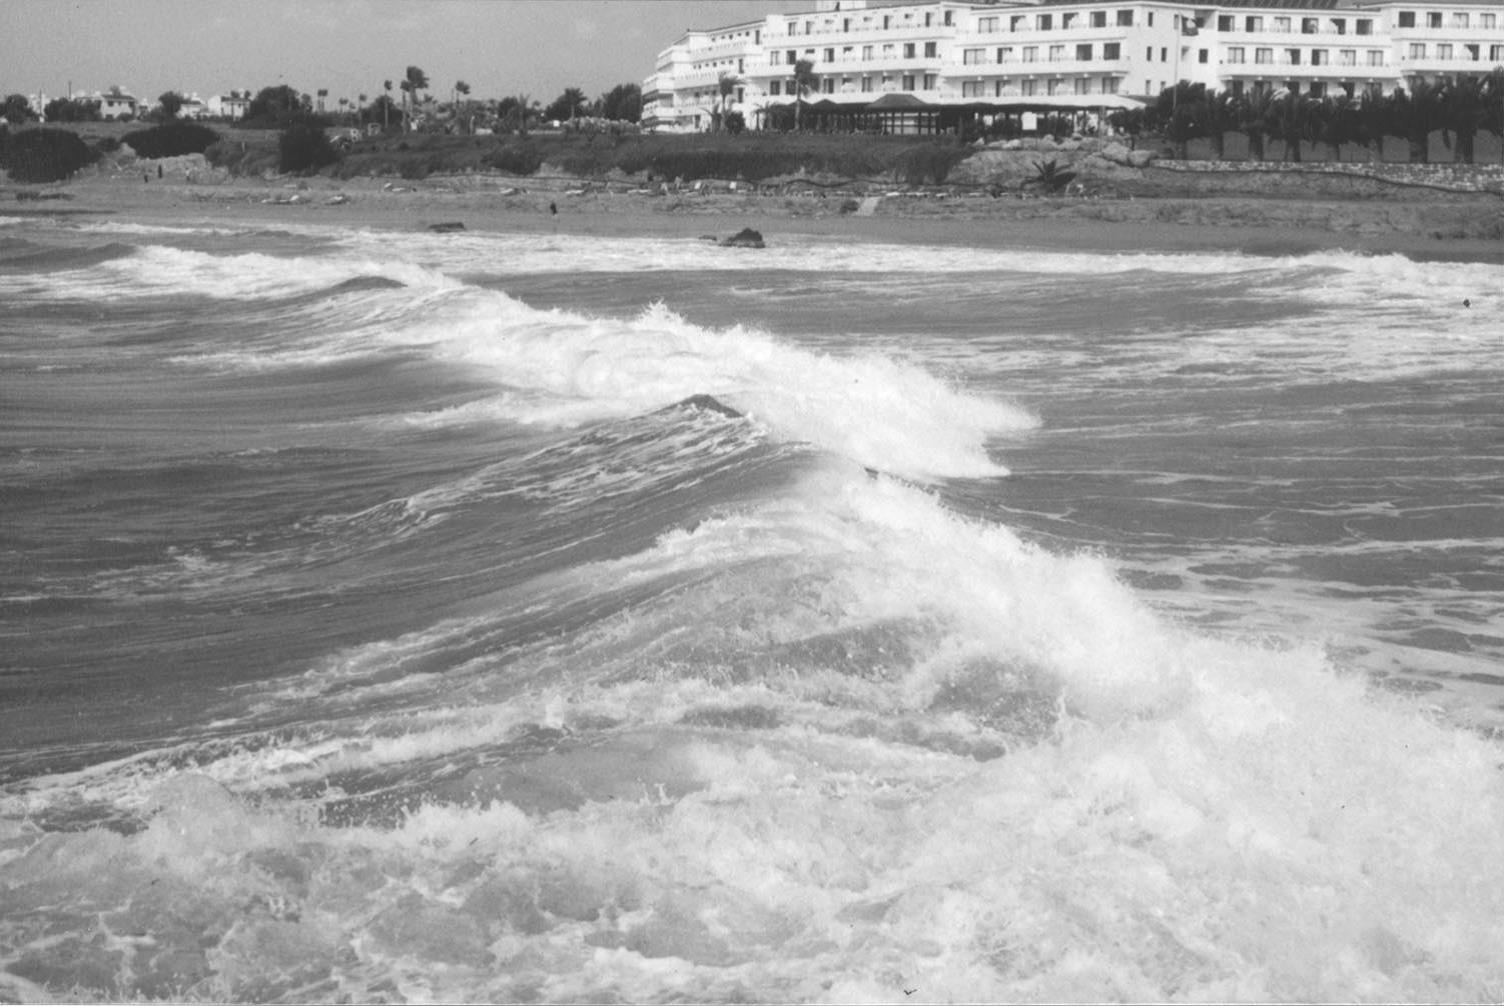
174 KB | Example of a spilling breaker. | 1 |
| 10:07, 6 June 2017 | ChadwickFig18a.jpg (file) |  |
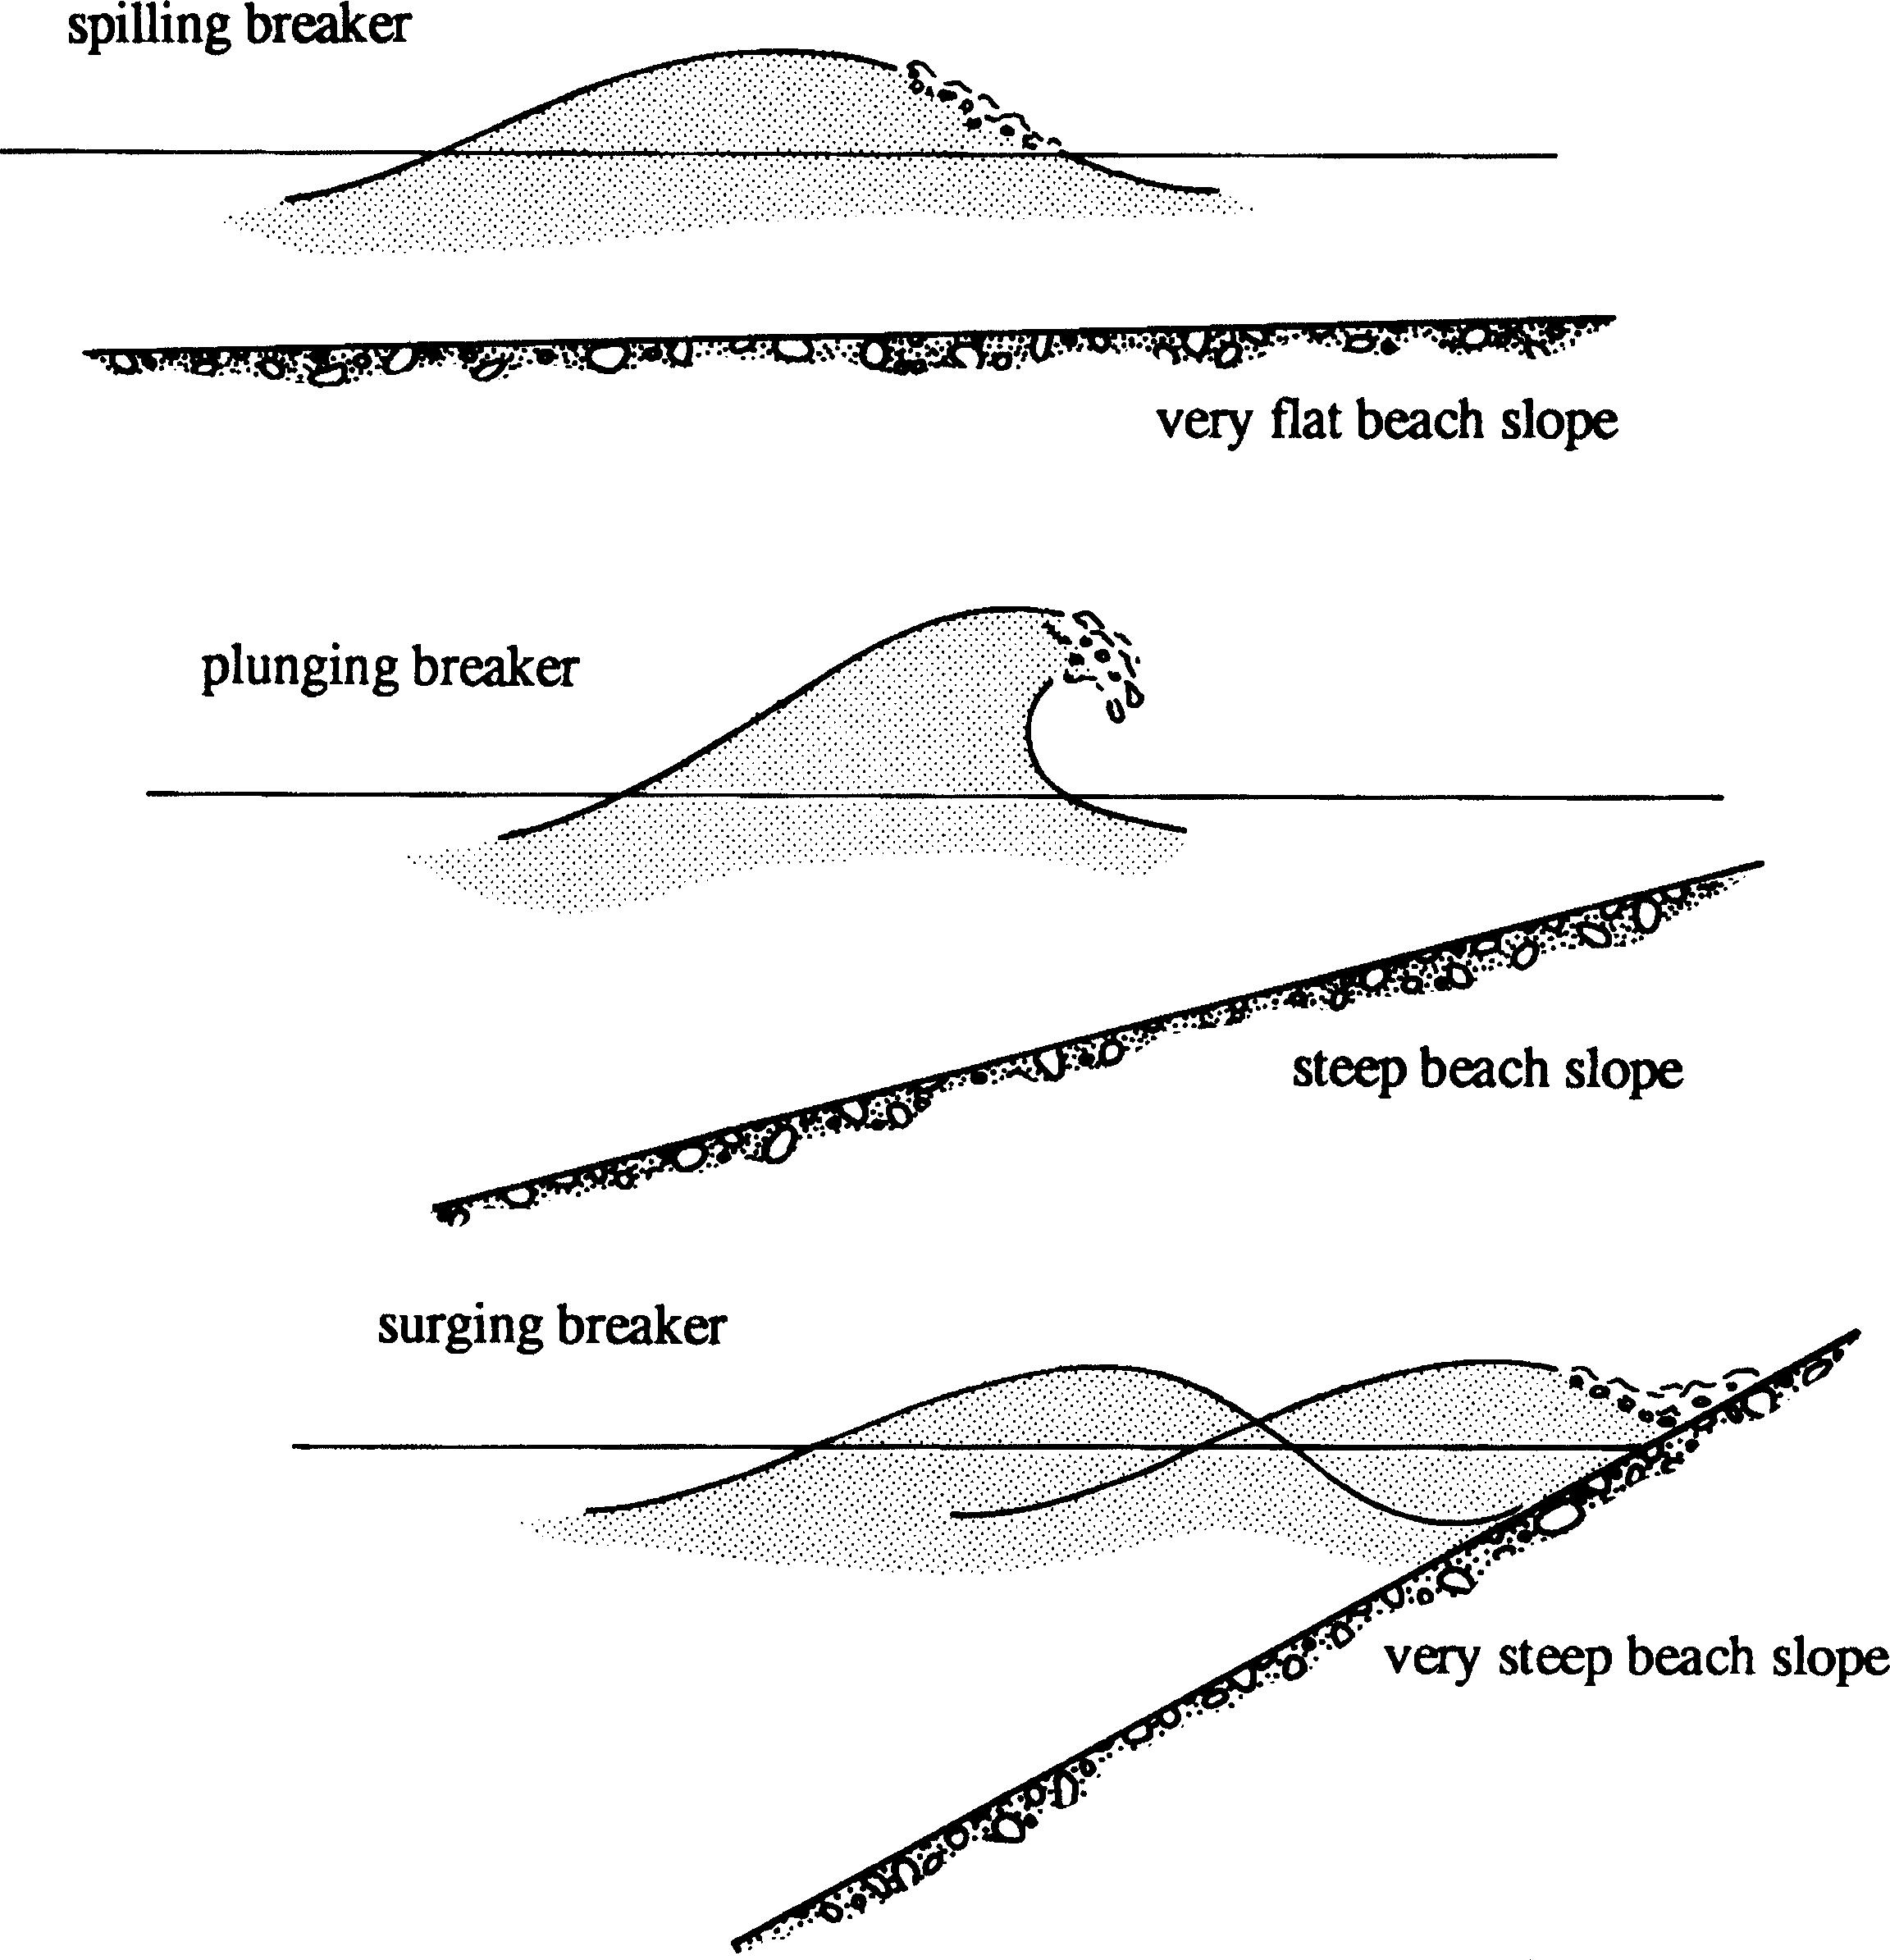
525 KB | Principal types of breaking waves. | 1 |
| 10:07, 6 June 2017 | ChadwickFig17b.jpg (file) |  |
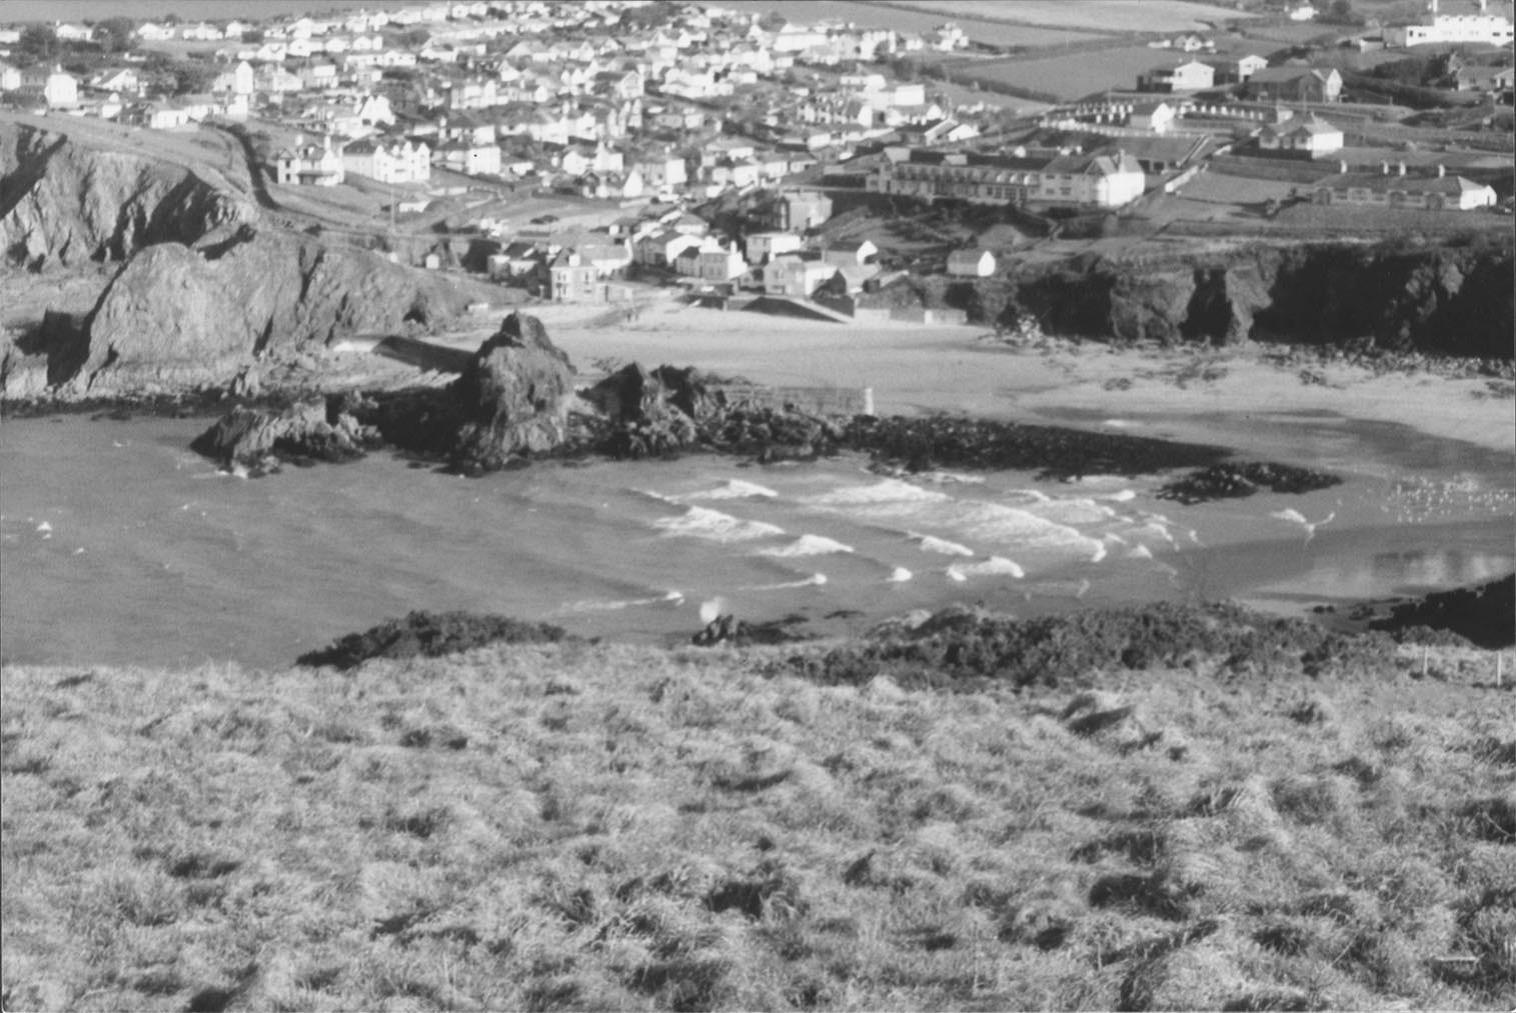
208 KB | A real surf zone at Hope Cove, Devon, England. | 1 |
| 10:06, 6 June 2017 | ChadwickFig17a.jpg (file) |  |
1.32 MB | The surf zone, conceptual. | 1 |
| 10:05, 6 June 2017 | ChadwickFig16.jpg (file) |  |
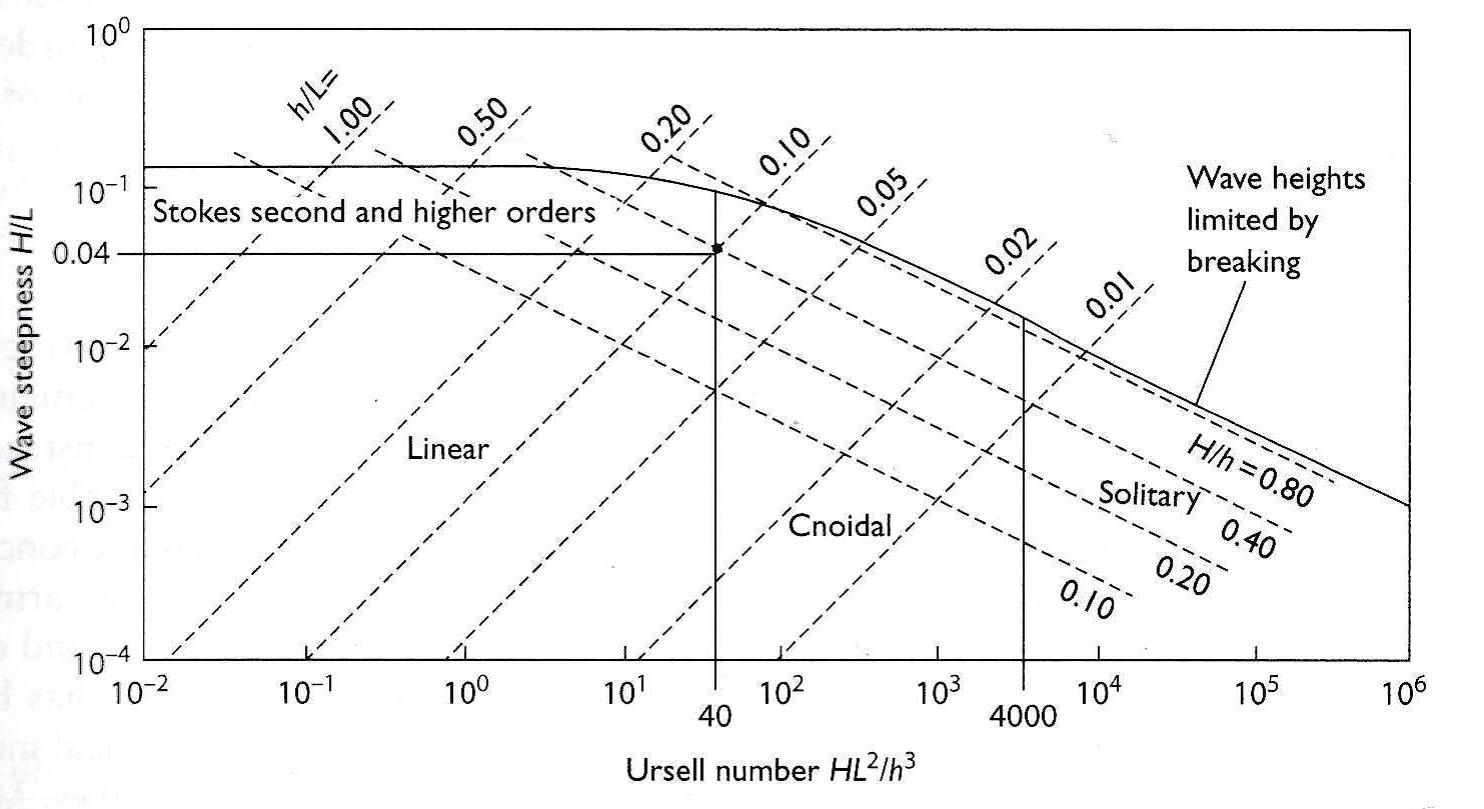
115 KB | Approximate regions of validity of analytical wave theories. | 1 |
| 10:05, 6 June 2017 | ChadwickFig15d.jpg (file) |  |
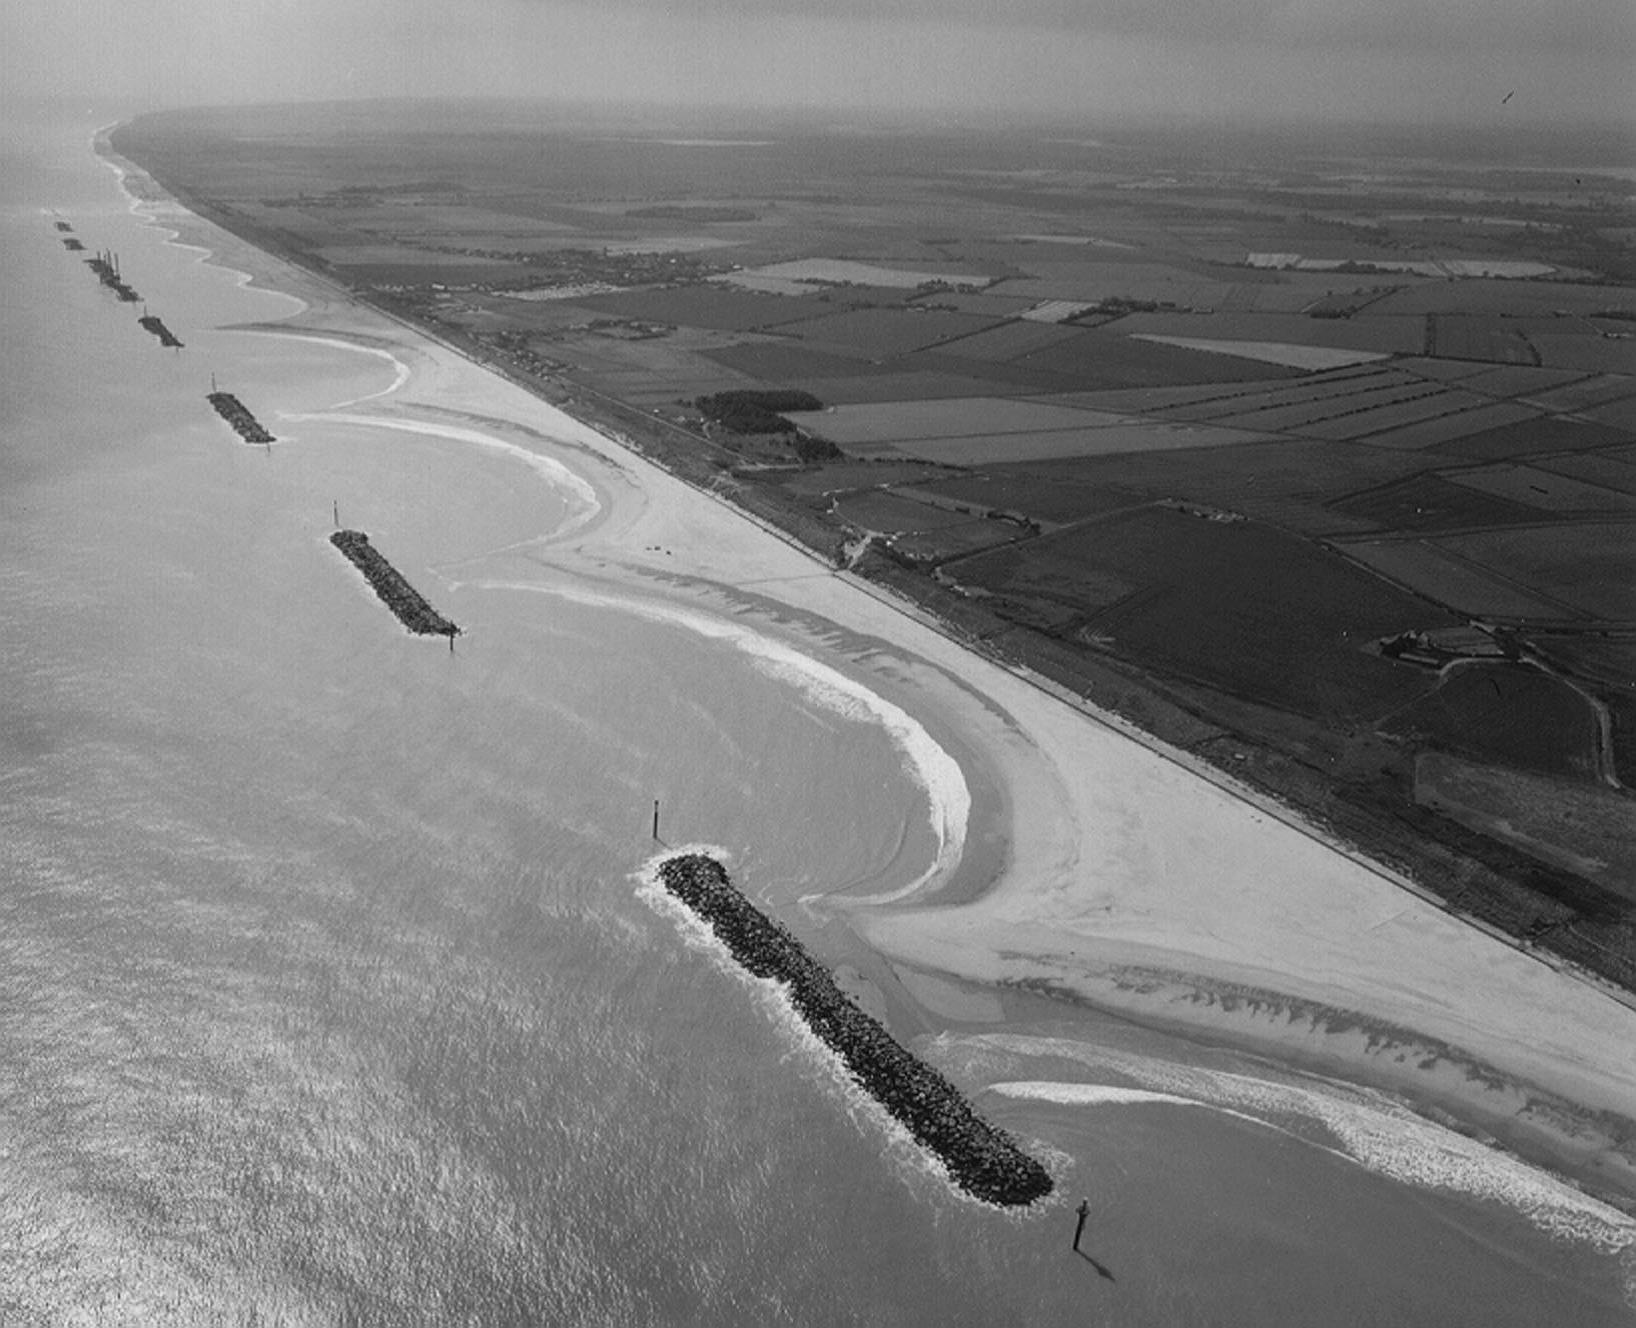
232 KB | Aerial photograph of wave diffraction at the Happisburgh to Winterton scheme, Norfolk, England, (courtesy of Mike Page). | 1 |
| 10:04, 6 June 2017 | ChadwickFig15c.jpg (file) |  |
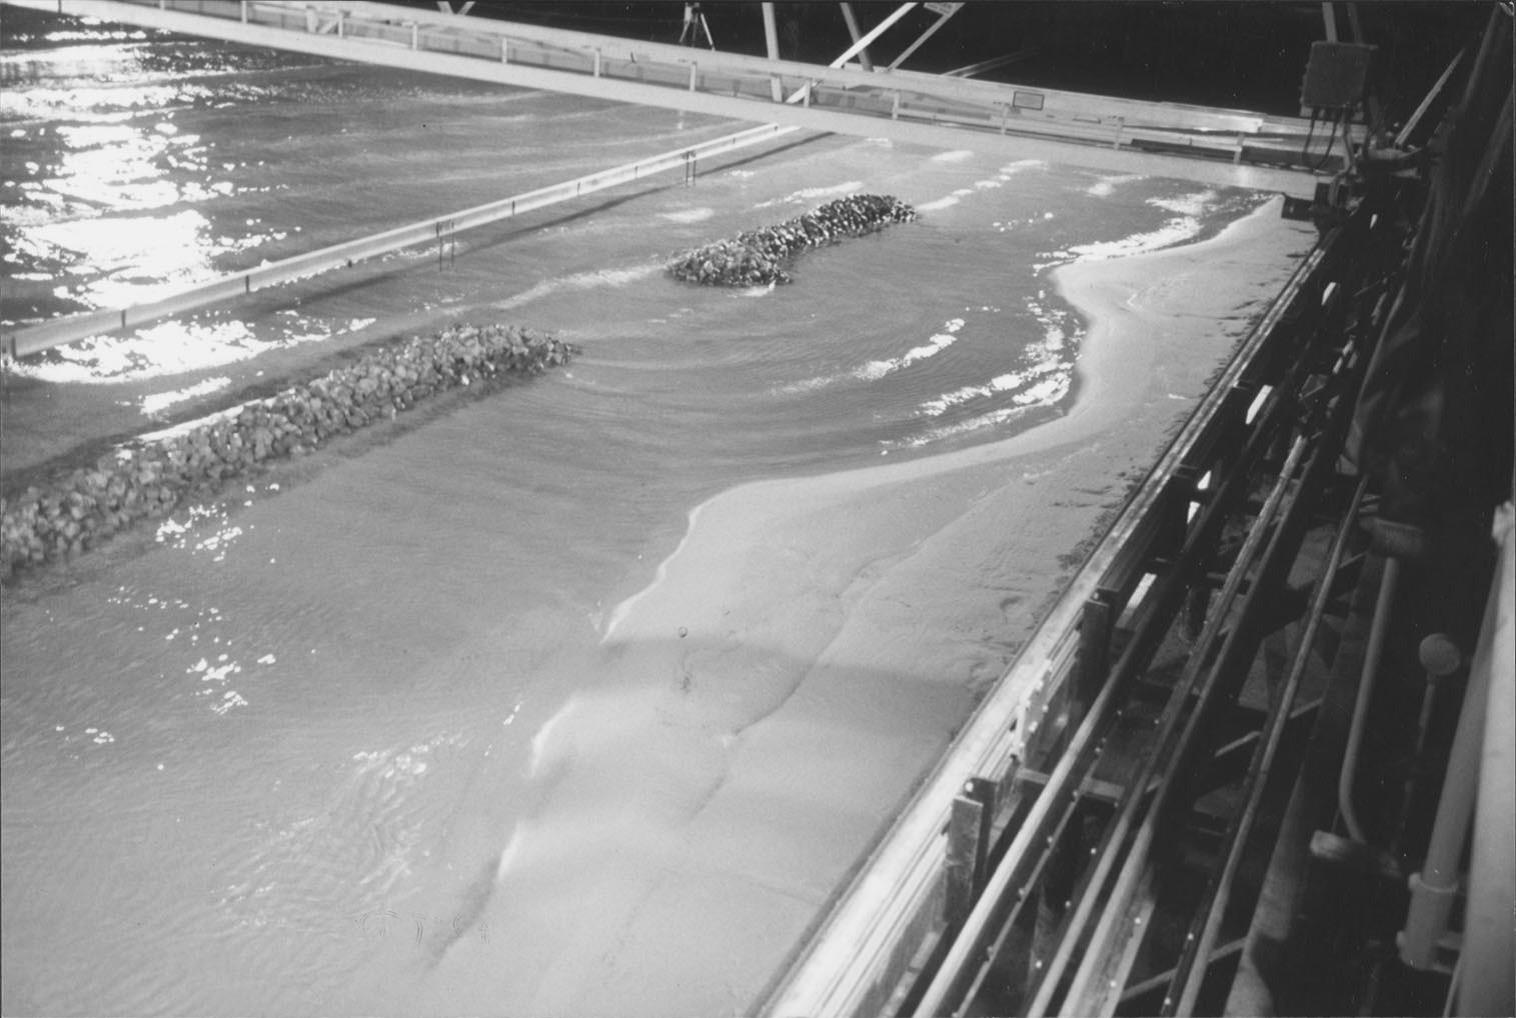
147 KB | Physical model study of (b) in the UK Coastal Research Facility at HR Wallingford. | 1 |
| 10:04, 6 June 2017 | ChadwickFig15b.jpg (file) |  |
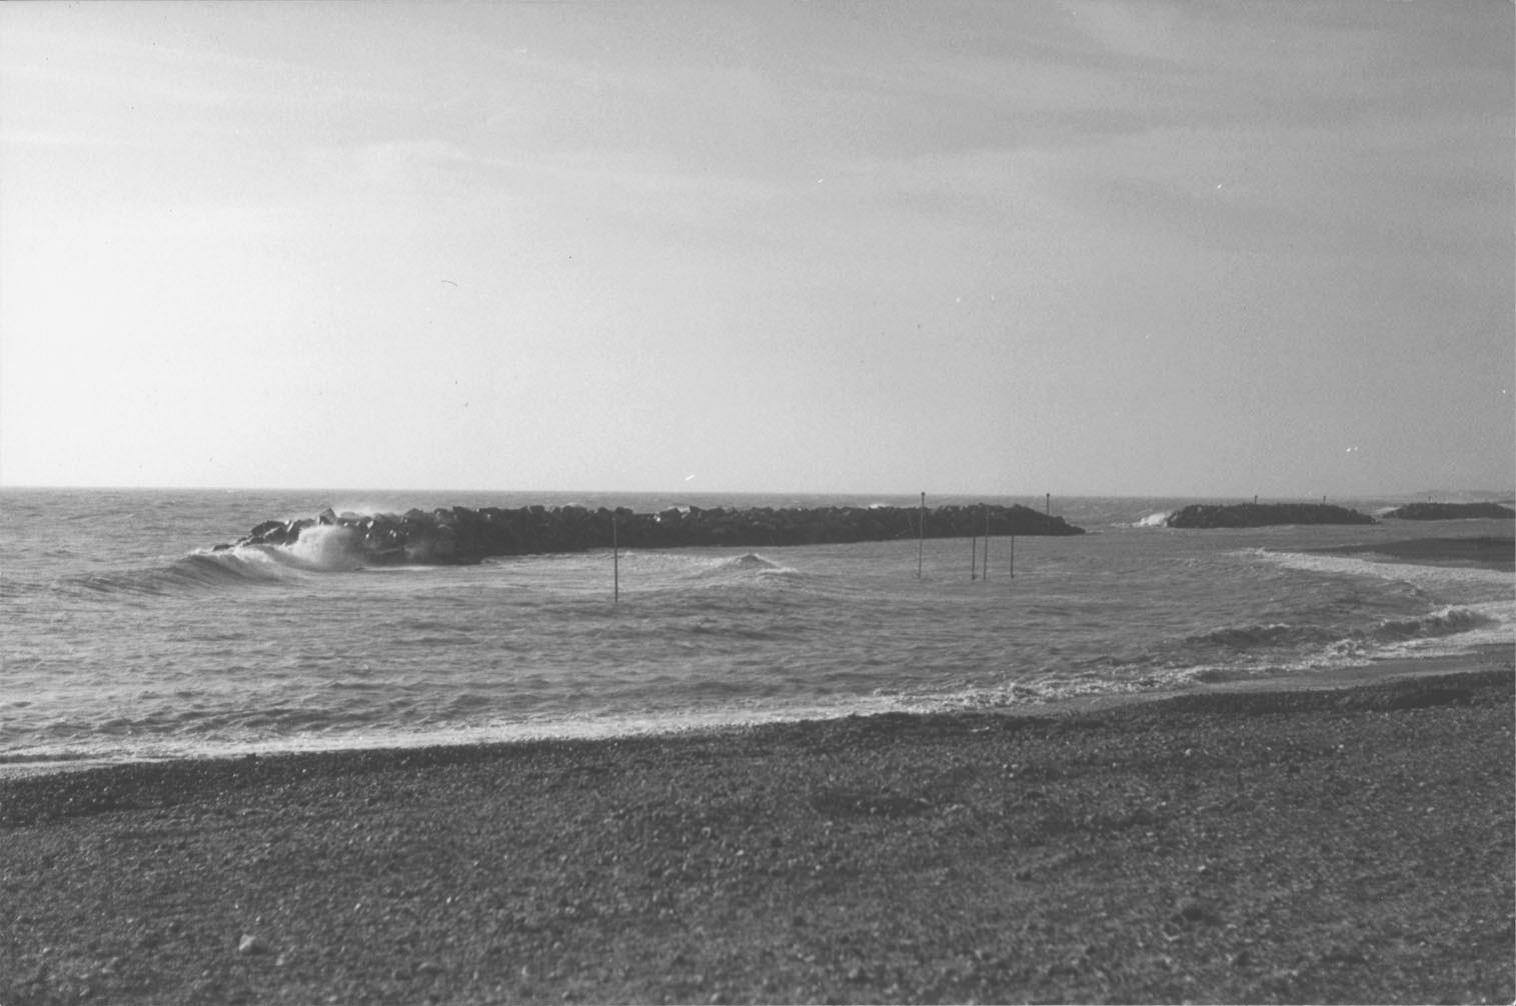
138 KB | Photograph of real wave diffraction at the Elmer breakwater scheme, Sussex, England. | 1 |
| 10:03, 6 June 2017 | ChadwickFig15a.jpg (file) |  |
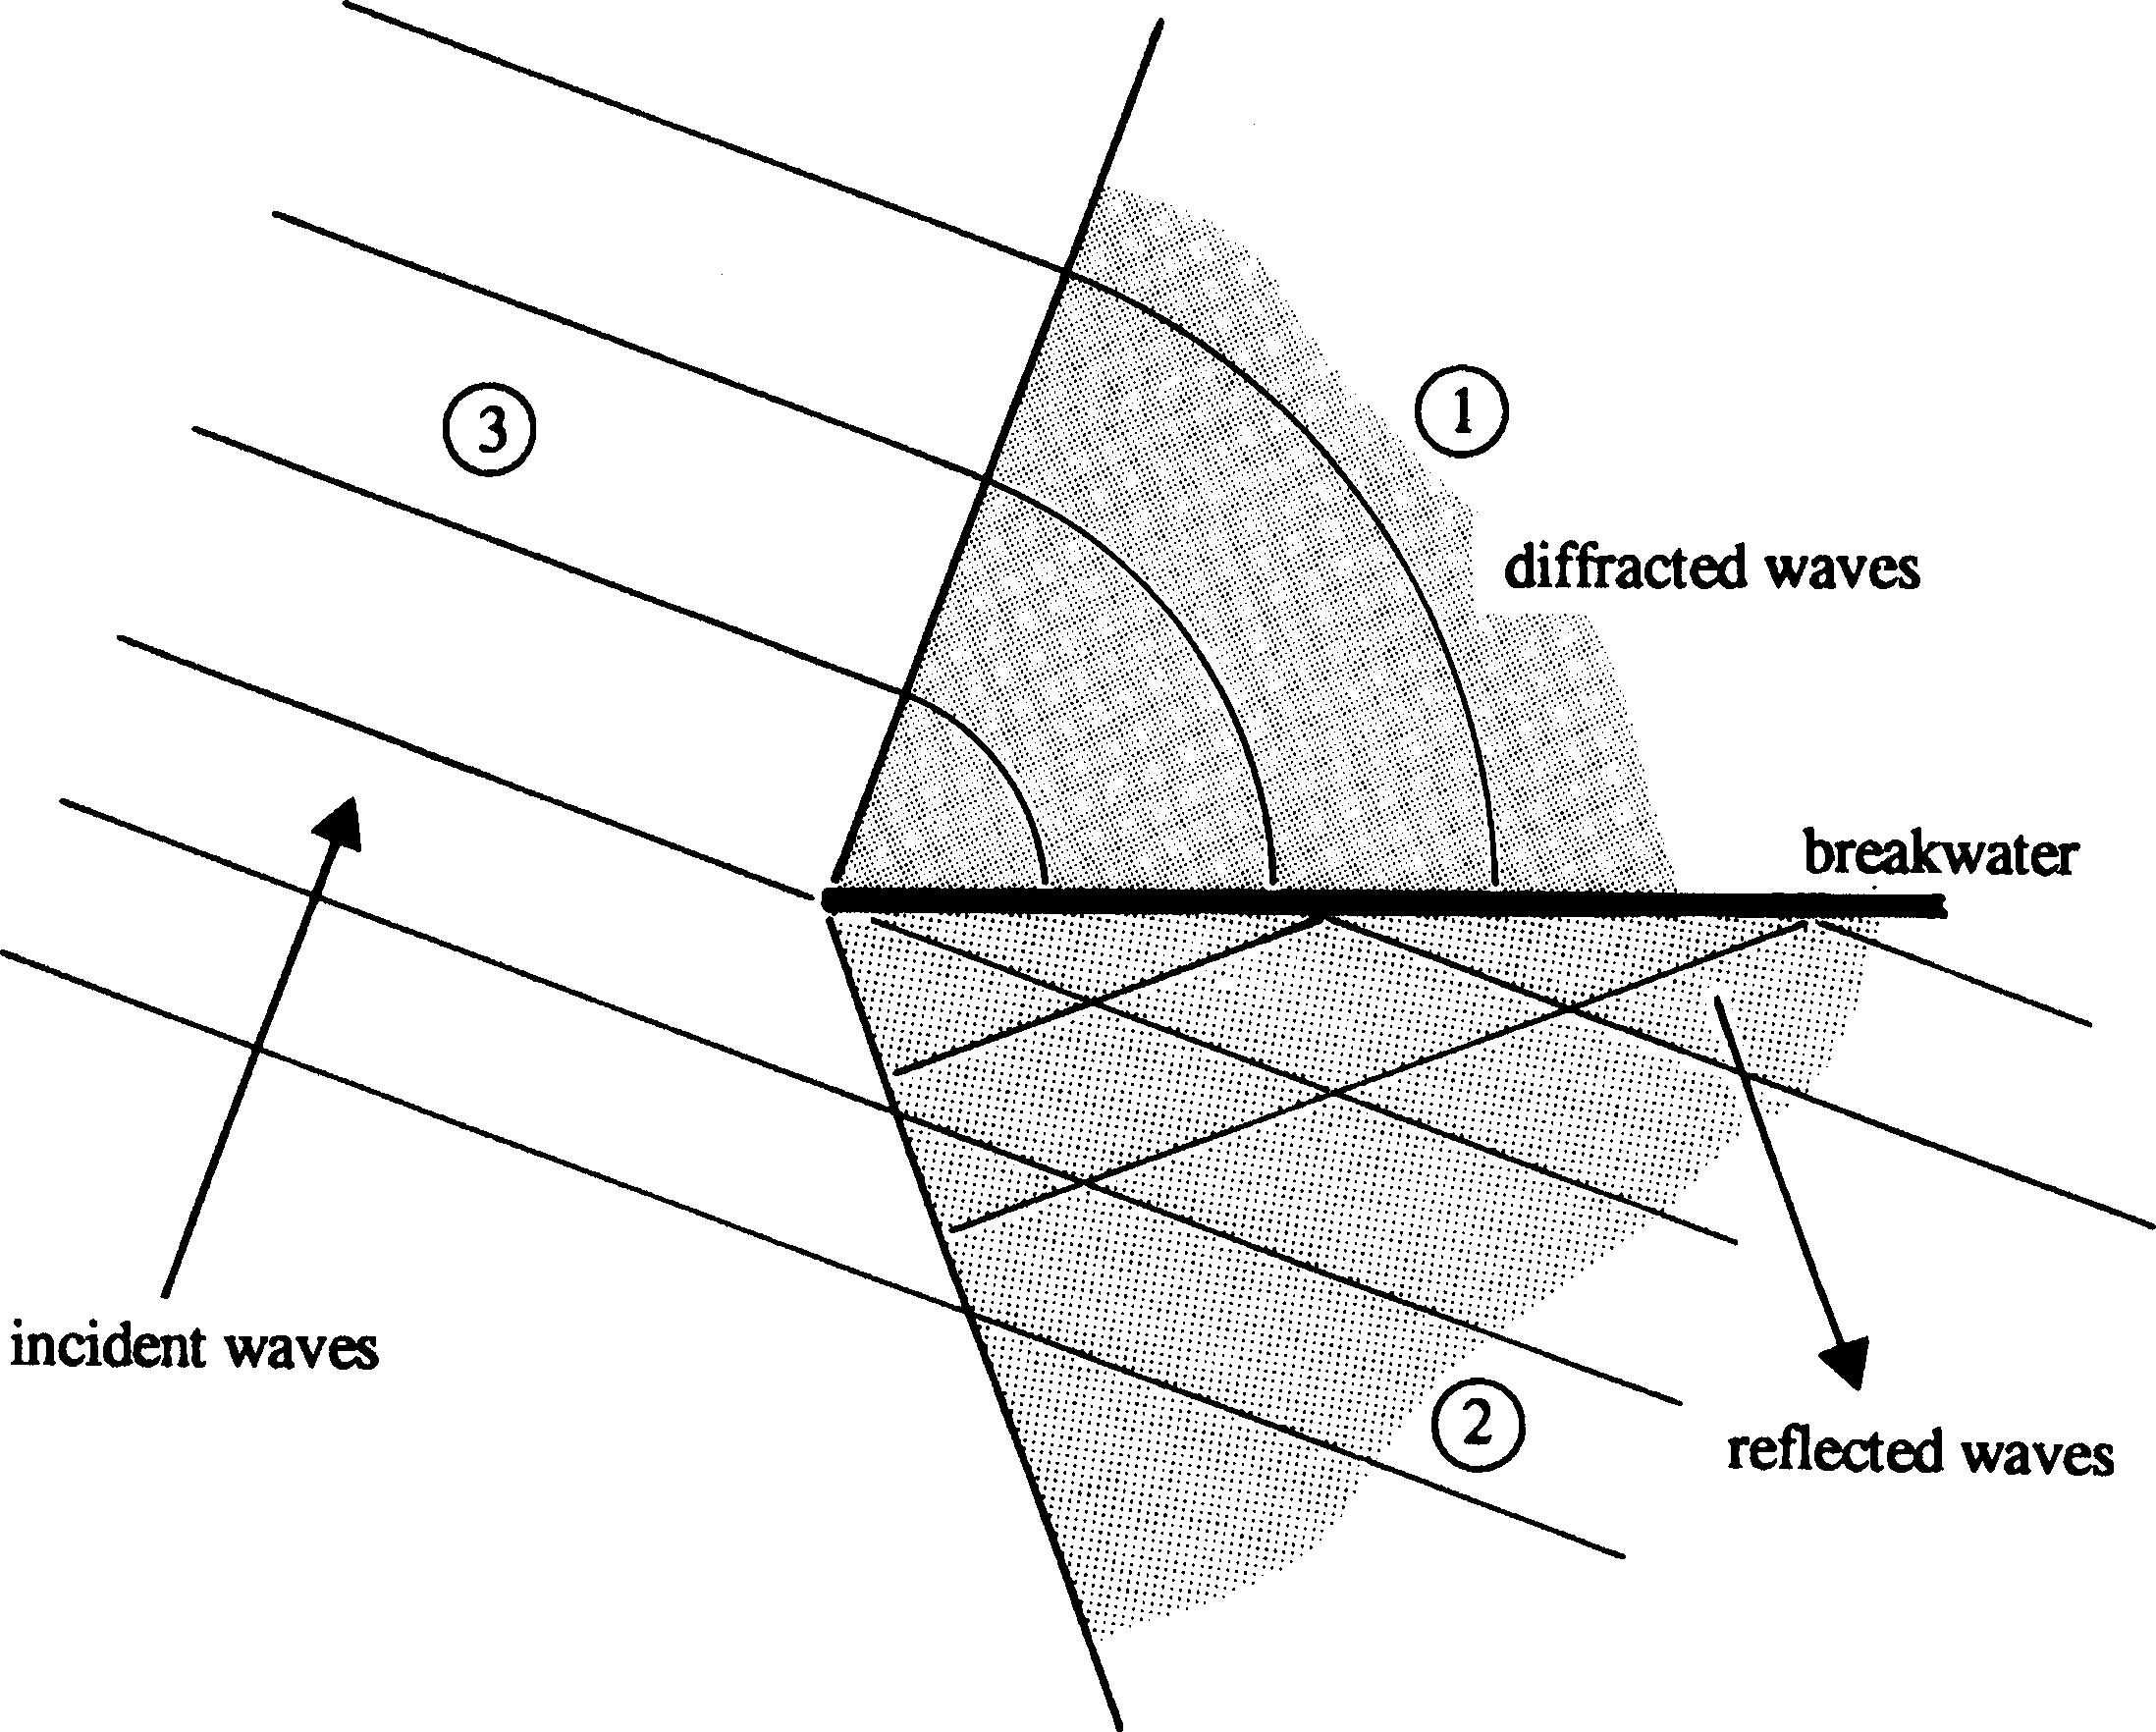
613 KB | Idealised wave diffraction around an impermeable breakwater. | 1 |
| 10:02, 6 June 2017 | ChadwickFig14.jpg (file) |  |
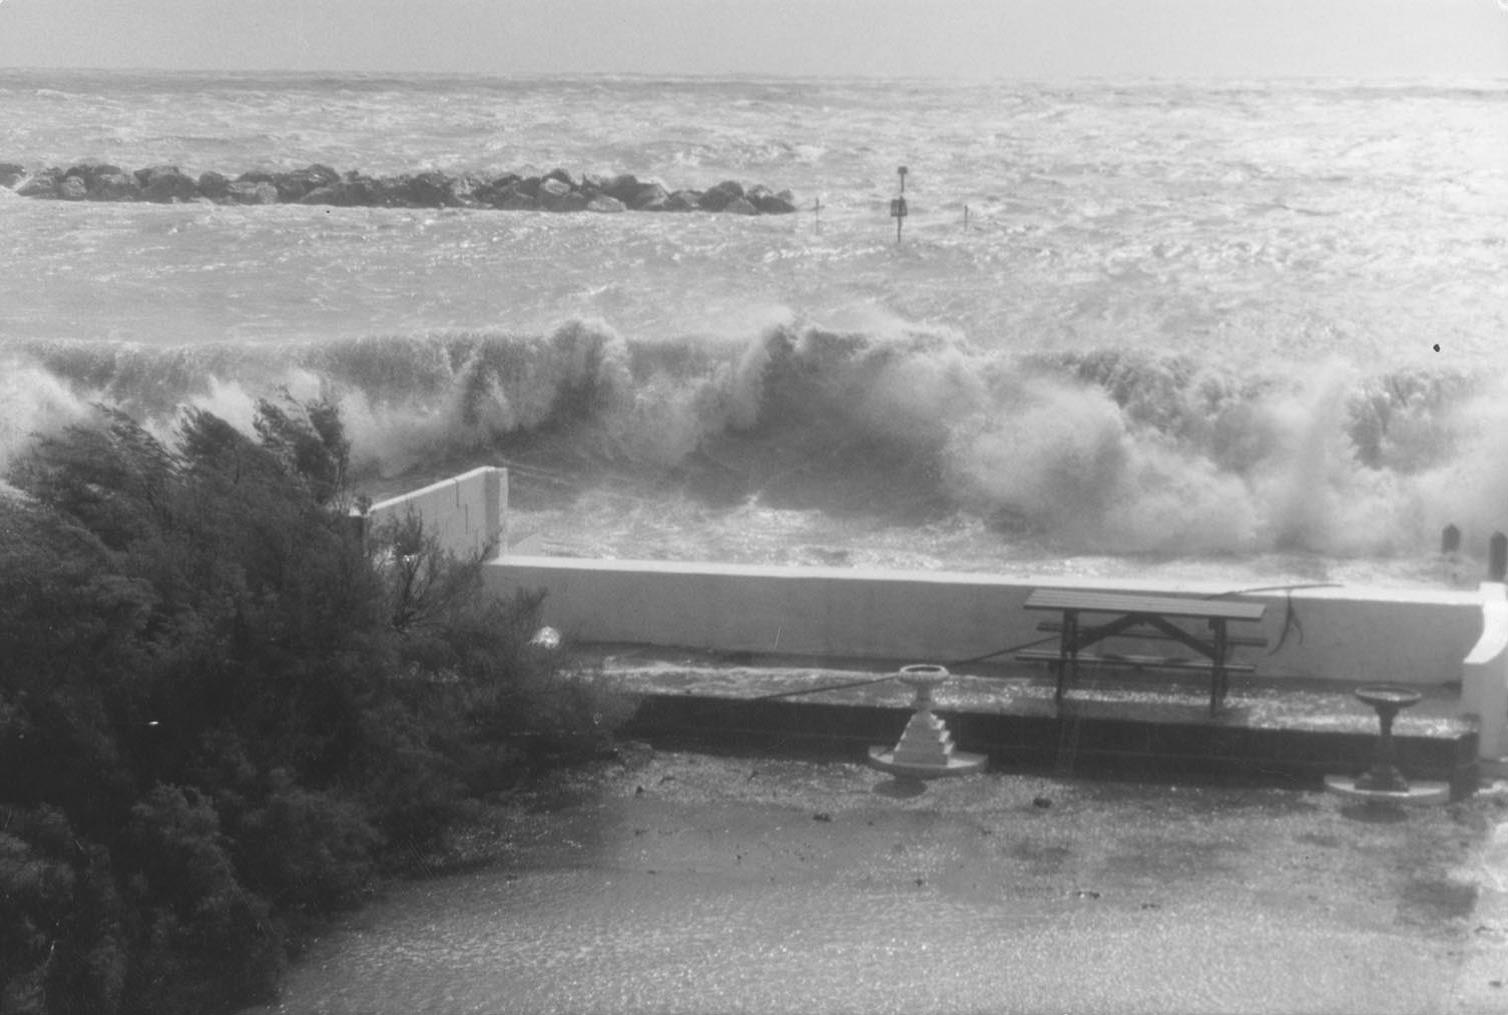
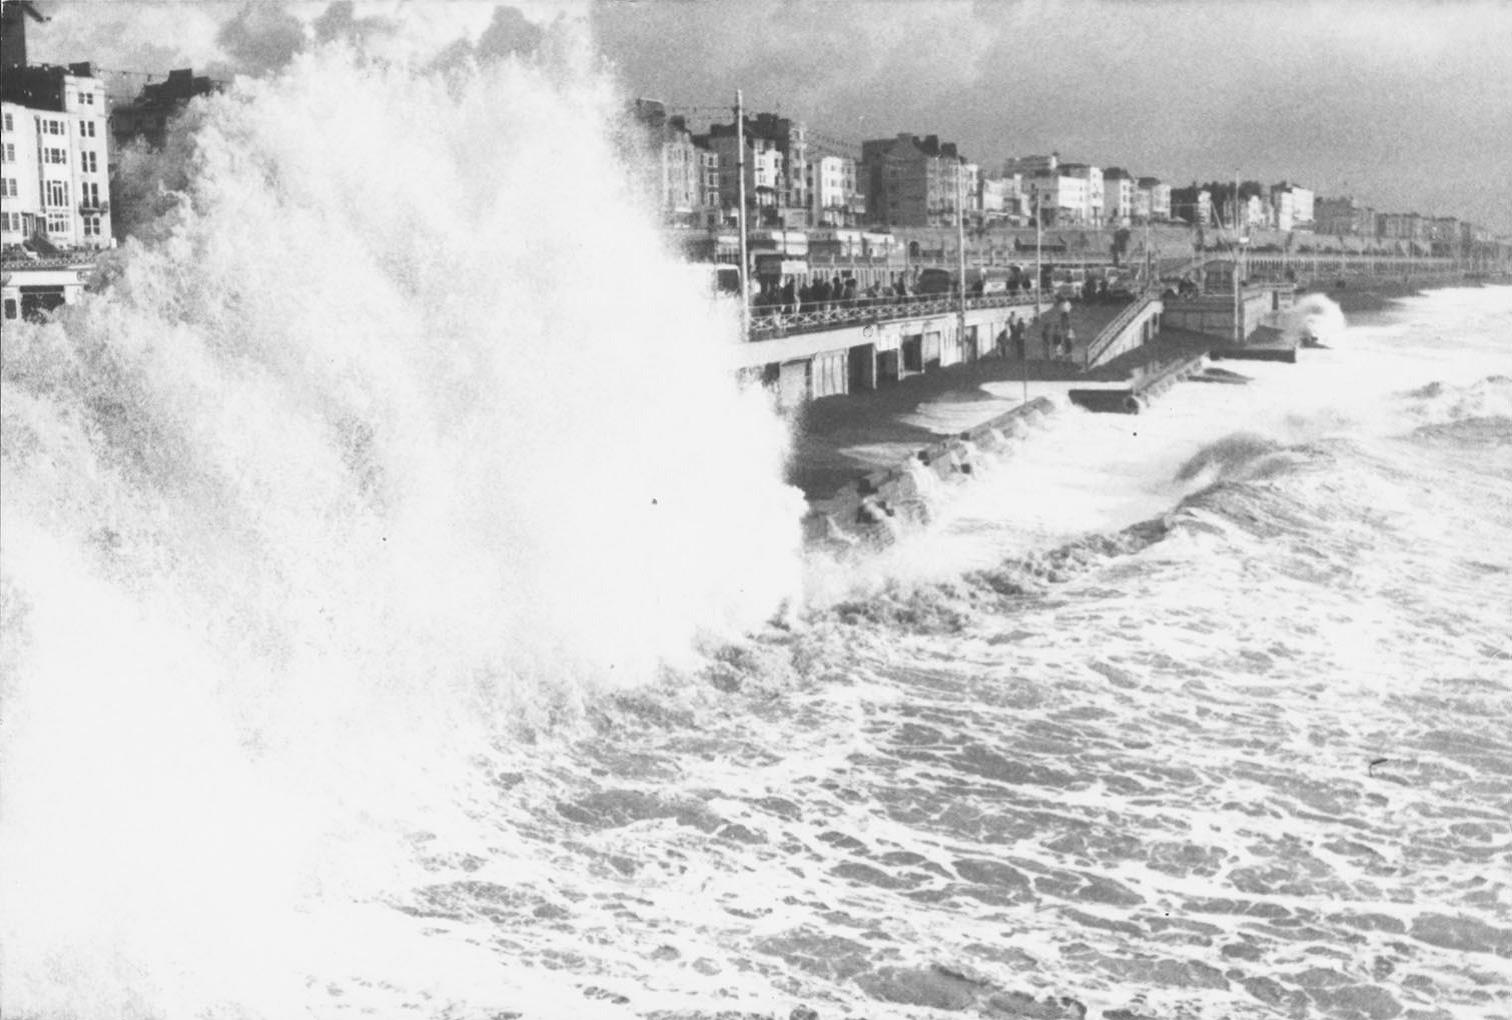
165 KB | Wave impact and reflection during a storm. | 1 |
| 10:02, 6 June 2017 | ChadwickFig13.jpg (file) |  |
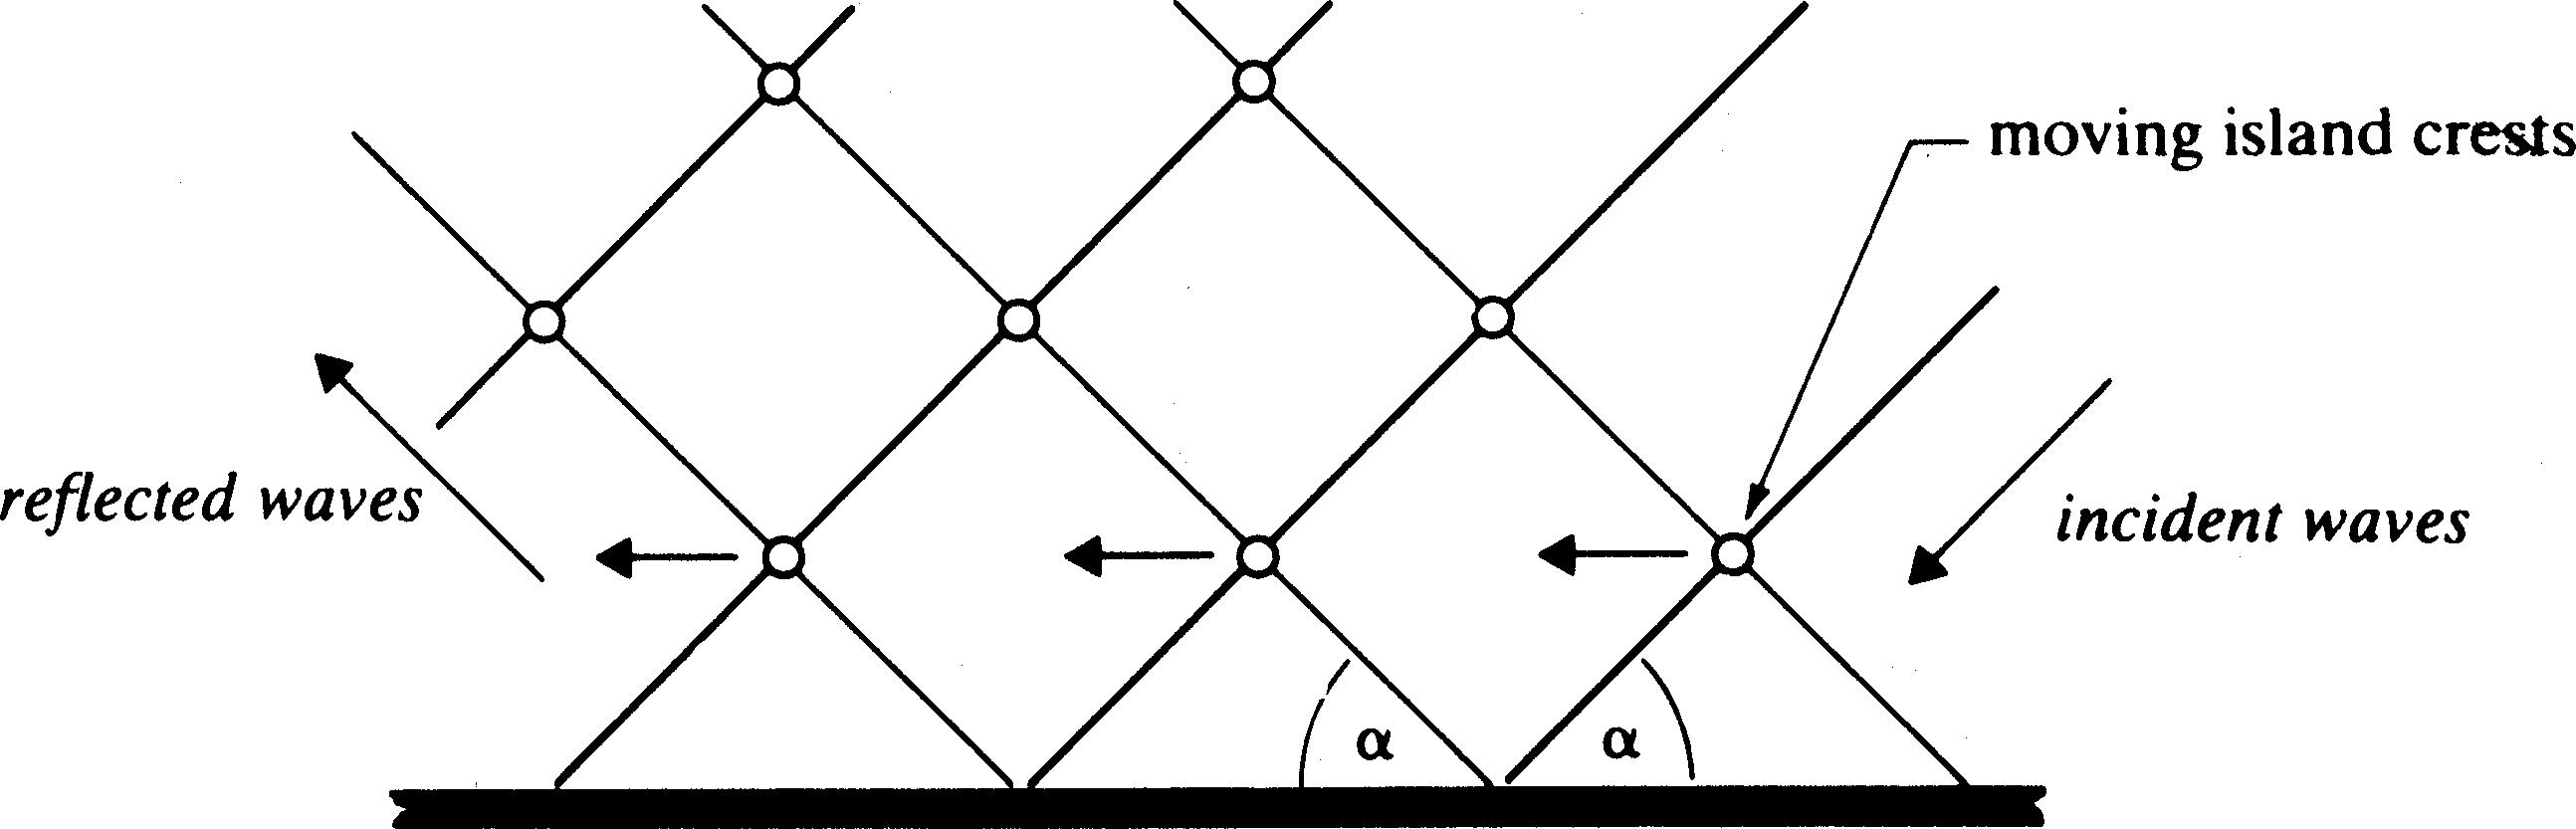
141 KB | Plan view of oblique wave reflection. | 1 |
| 10:01, 6 June 2017 | ChadwickFig12b.jpg (file) |  |
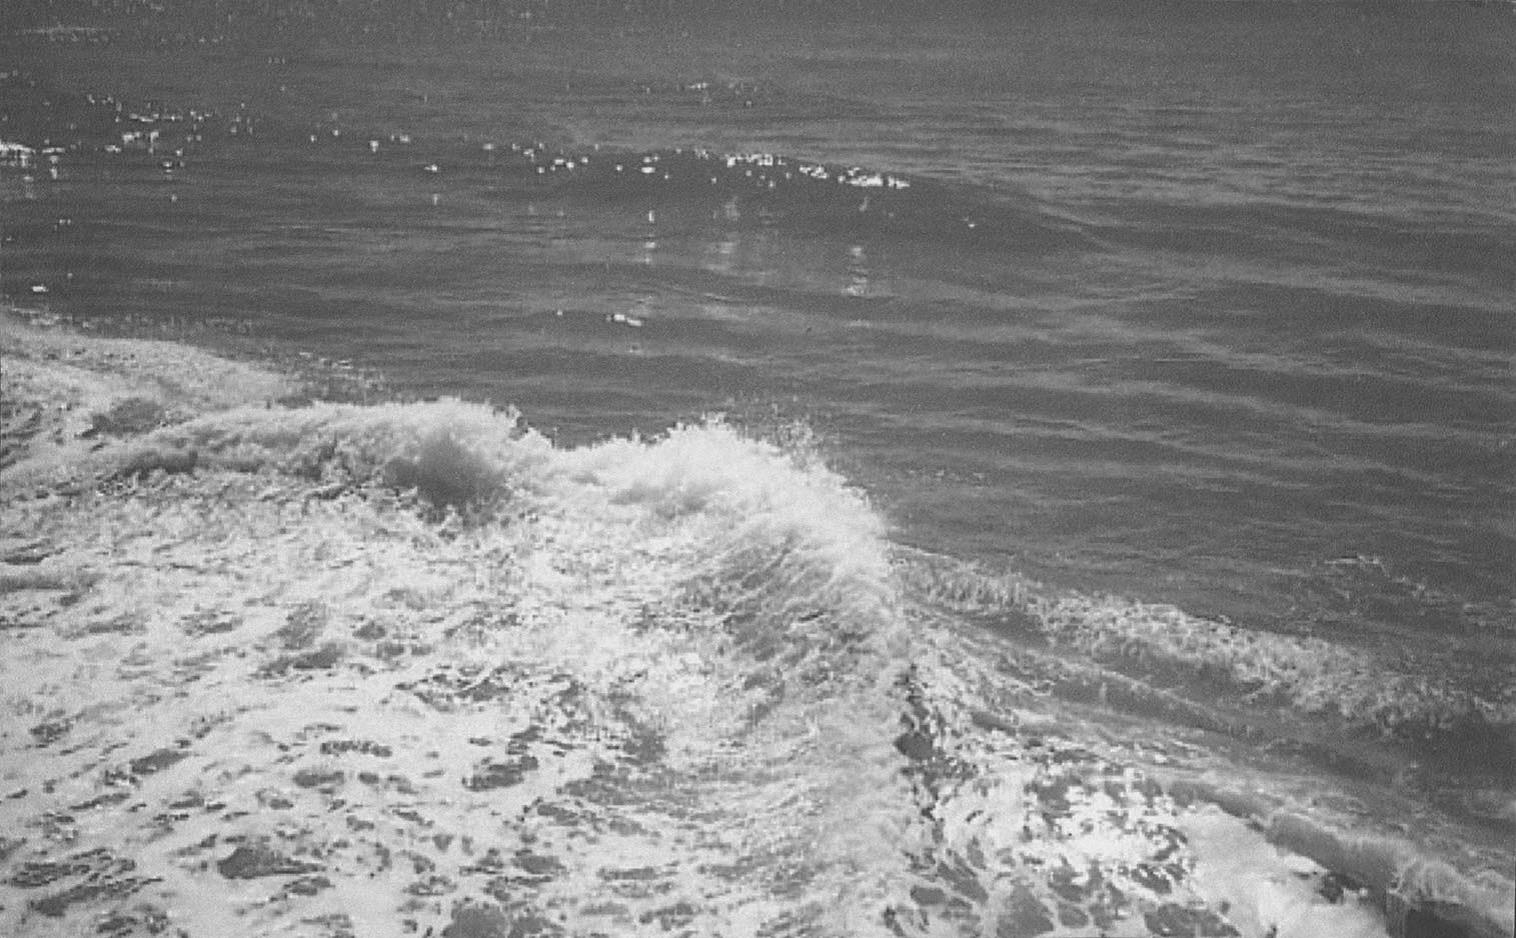
214 KB | Standing Waves, observed clapotis. | 1 |
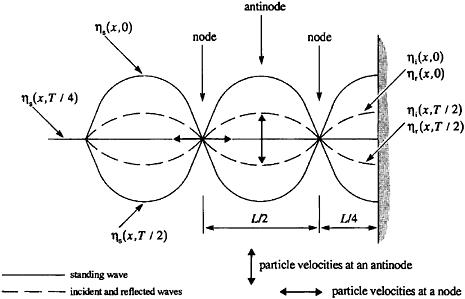
| 09:59, 6 June 2017 | ChadwickFig12a.jpg (file) |  |
22 KB | Standing Waves, idealised. | 1 |
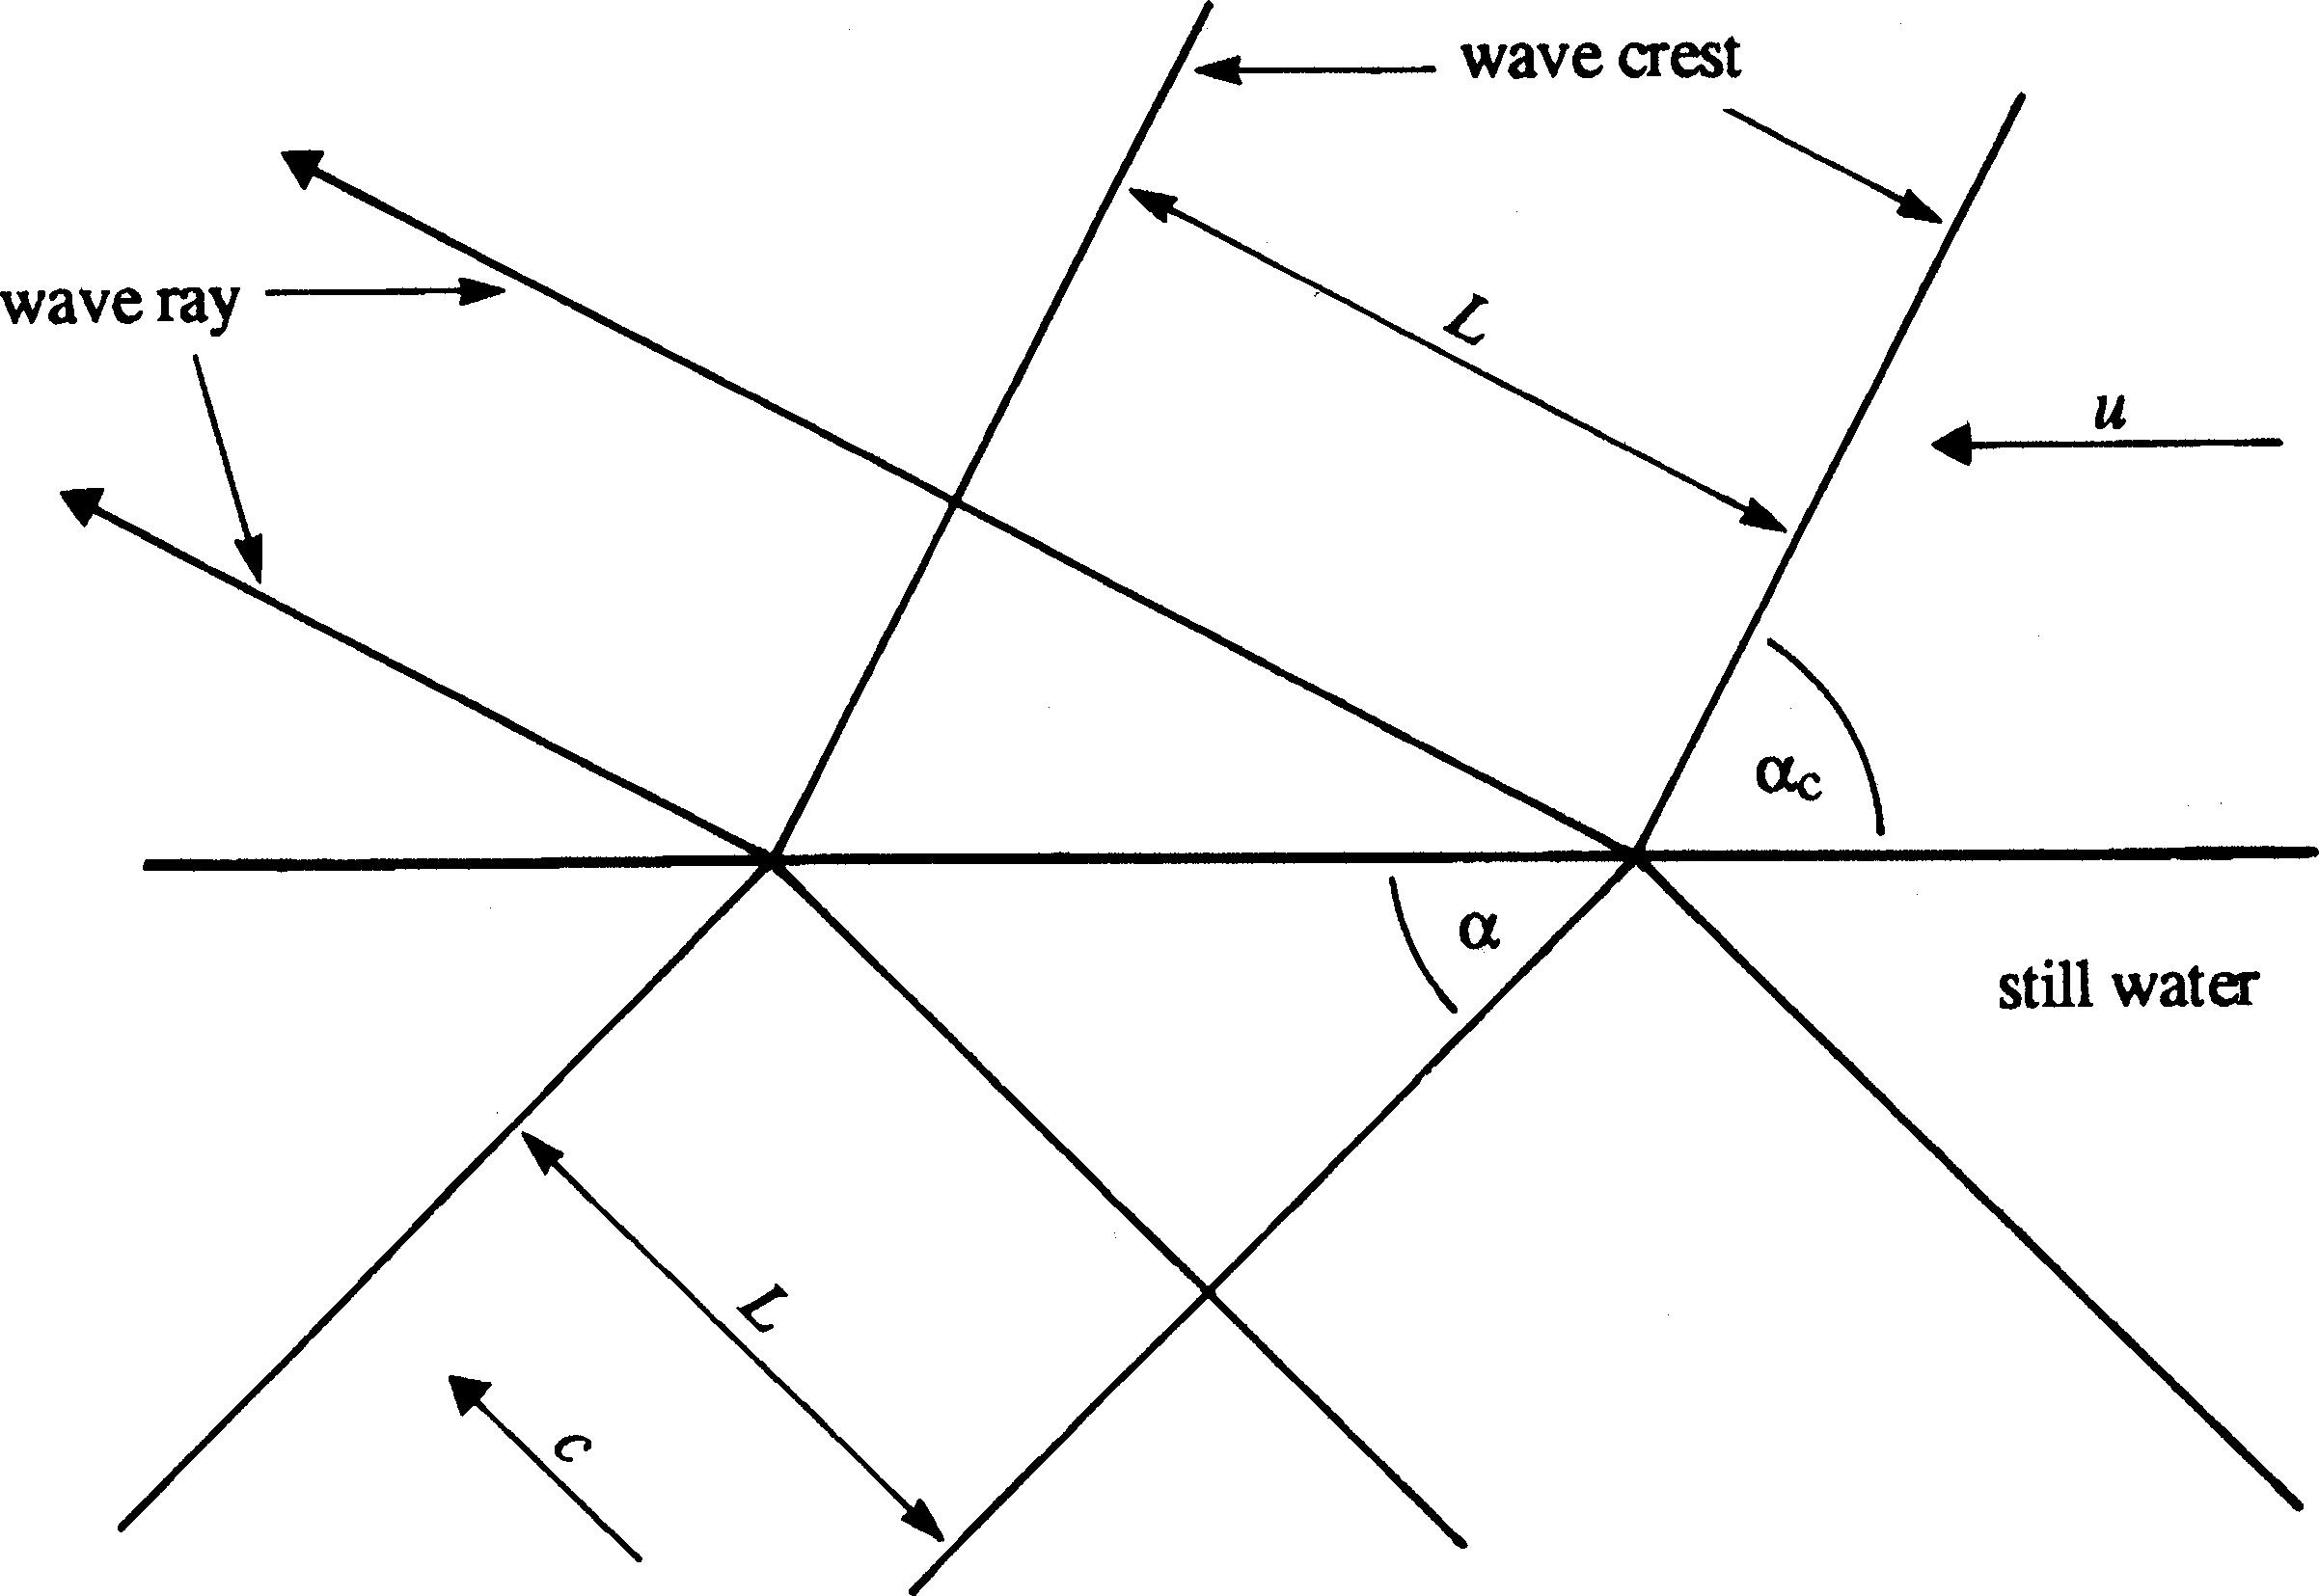
| 09:58, 6 June 2017 | ChadwickFig11.jpg (file) |  |
198 KB | Deep water wave refraction by a current. | 1 |
| 09:57, 6 June 2017 | ChadwickFig10.jpg (file) |  |
49 KB | Reproduced from Goda (2000) Figure 3.7. | 1 |
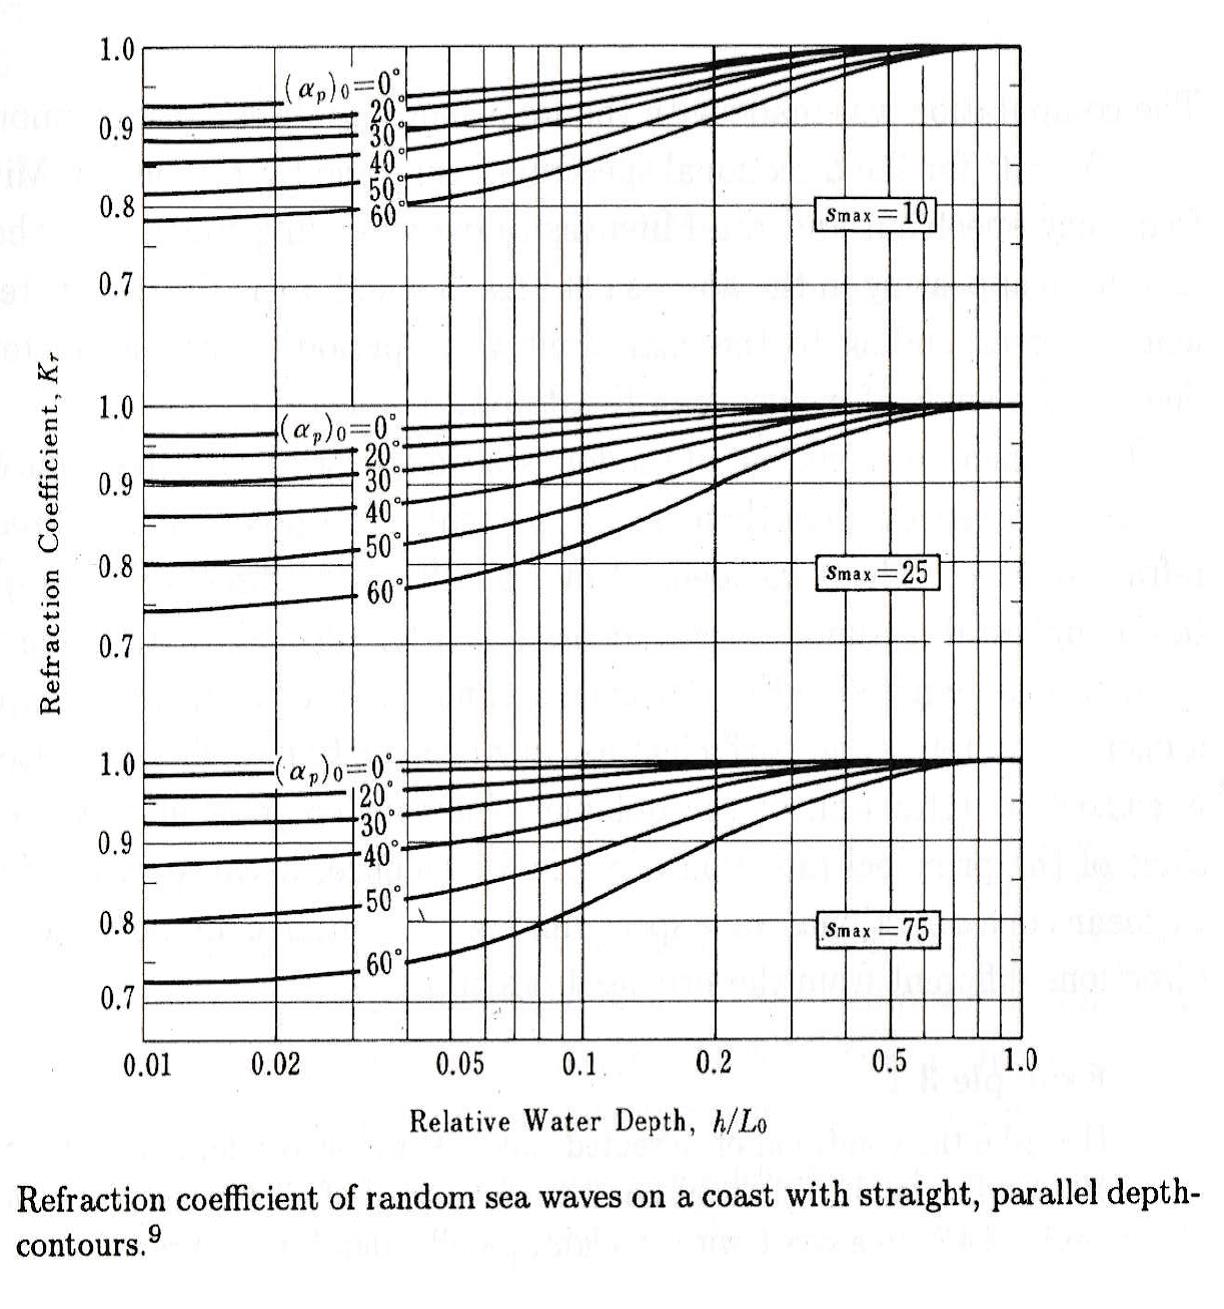
| 09:56, 6 June 2017 | ChadwickFig9.jpg (file) |  |
187 KB | Reproduced from Goda (2000) Figure 3.6. | 1 |
| 09:56, 6 June 2017 | ChadwickFig8.jpg (file) |  |
200 KB | Divergence of wave rays over parallel contours. | 1 |
| 09:55, 6 June 2017 | ChadwickFig7.jpg (file) |  |
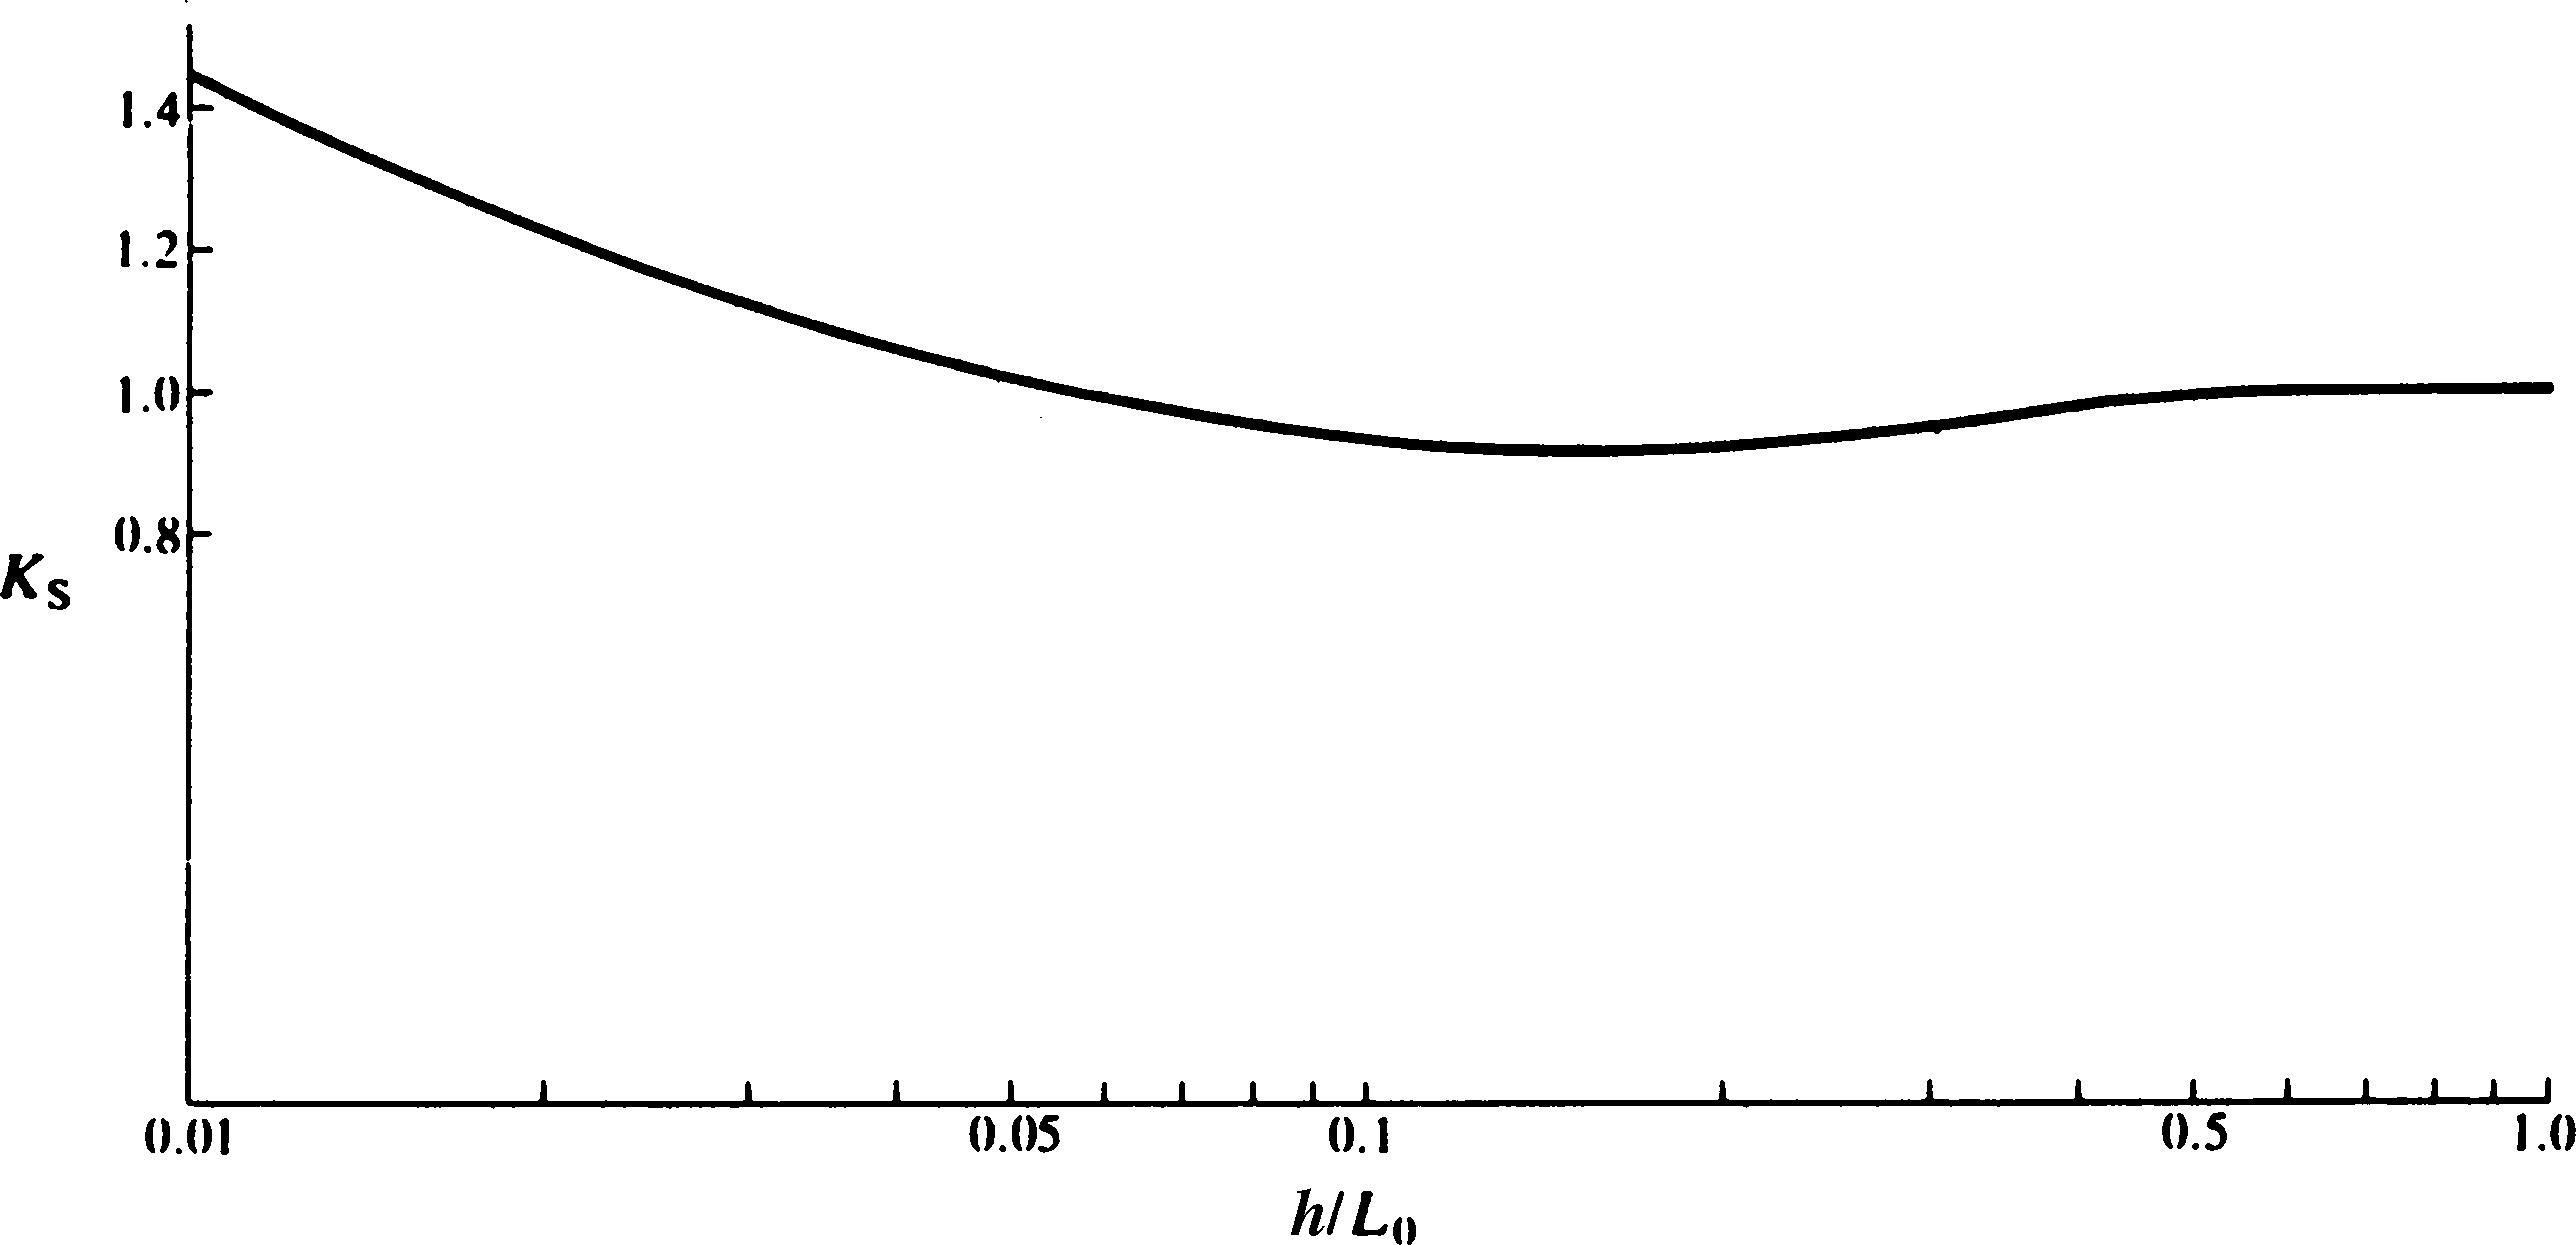
100 KB | Variation of the shoaling coefficient with depth. | 1 |
| 09:55, 6 June 2017 | ChadwickFig6.jpg (file) |  |
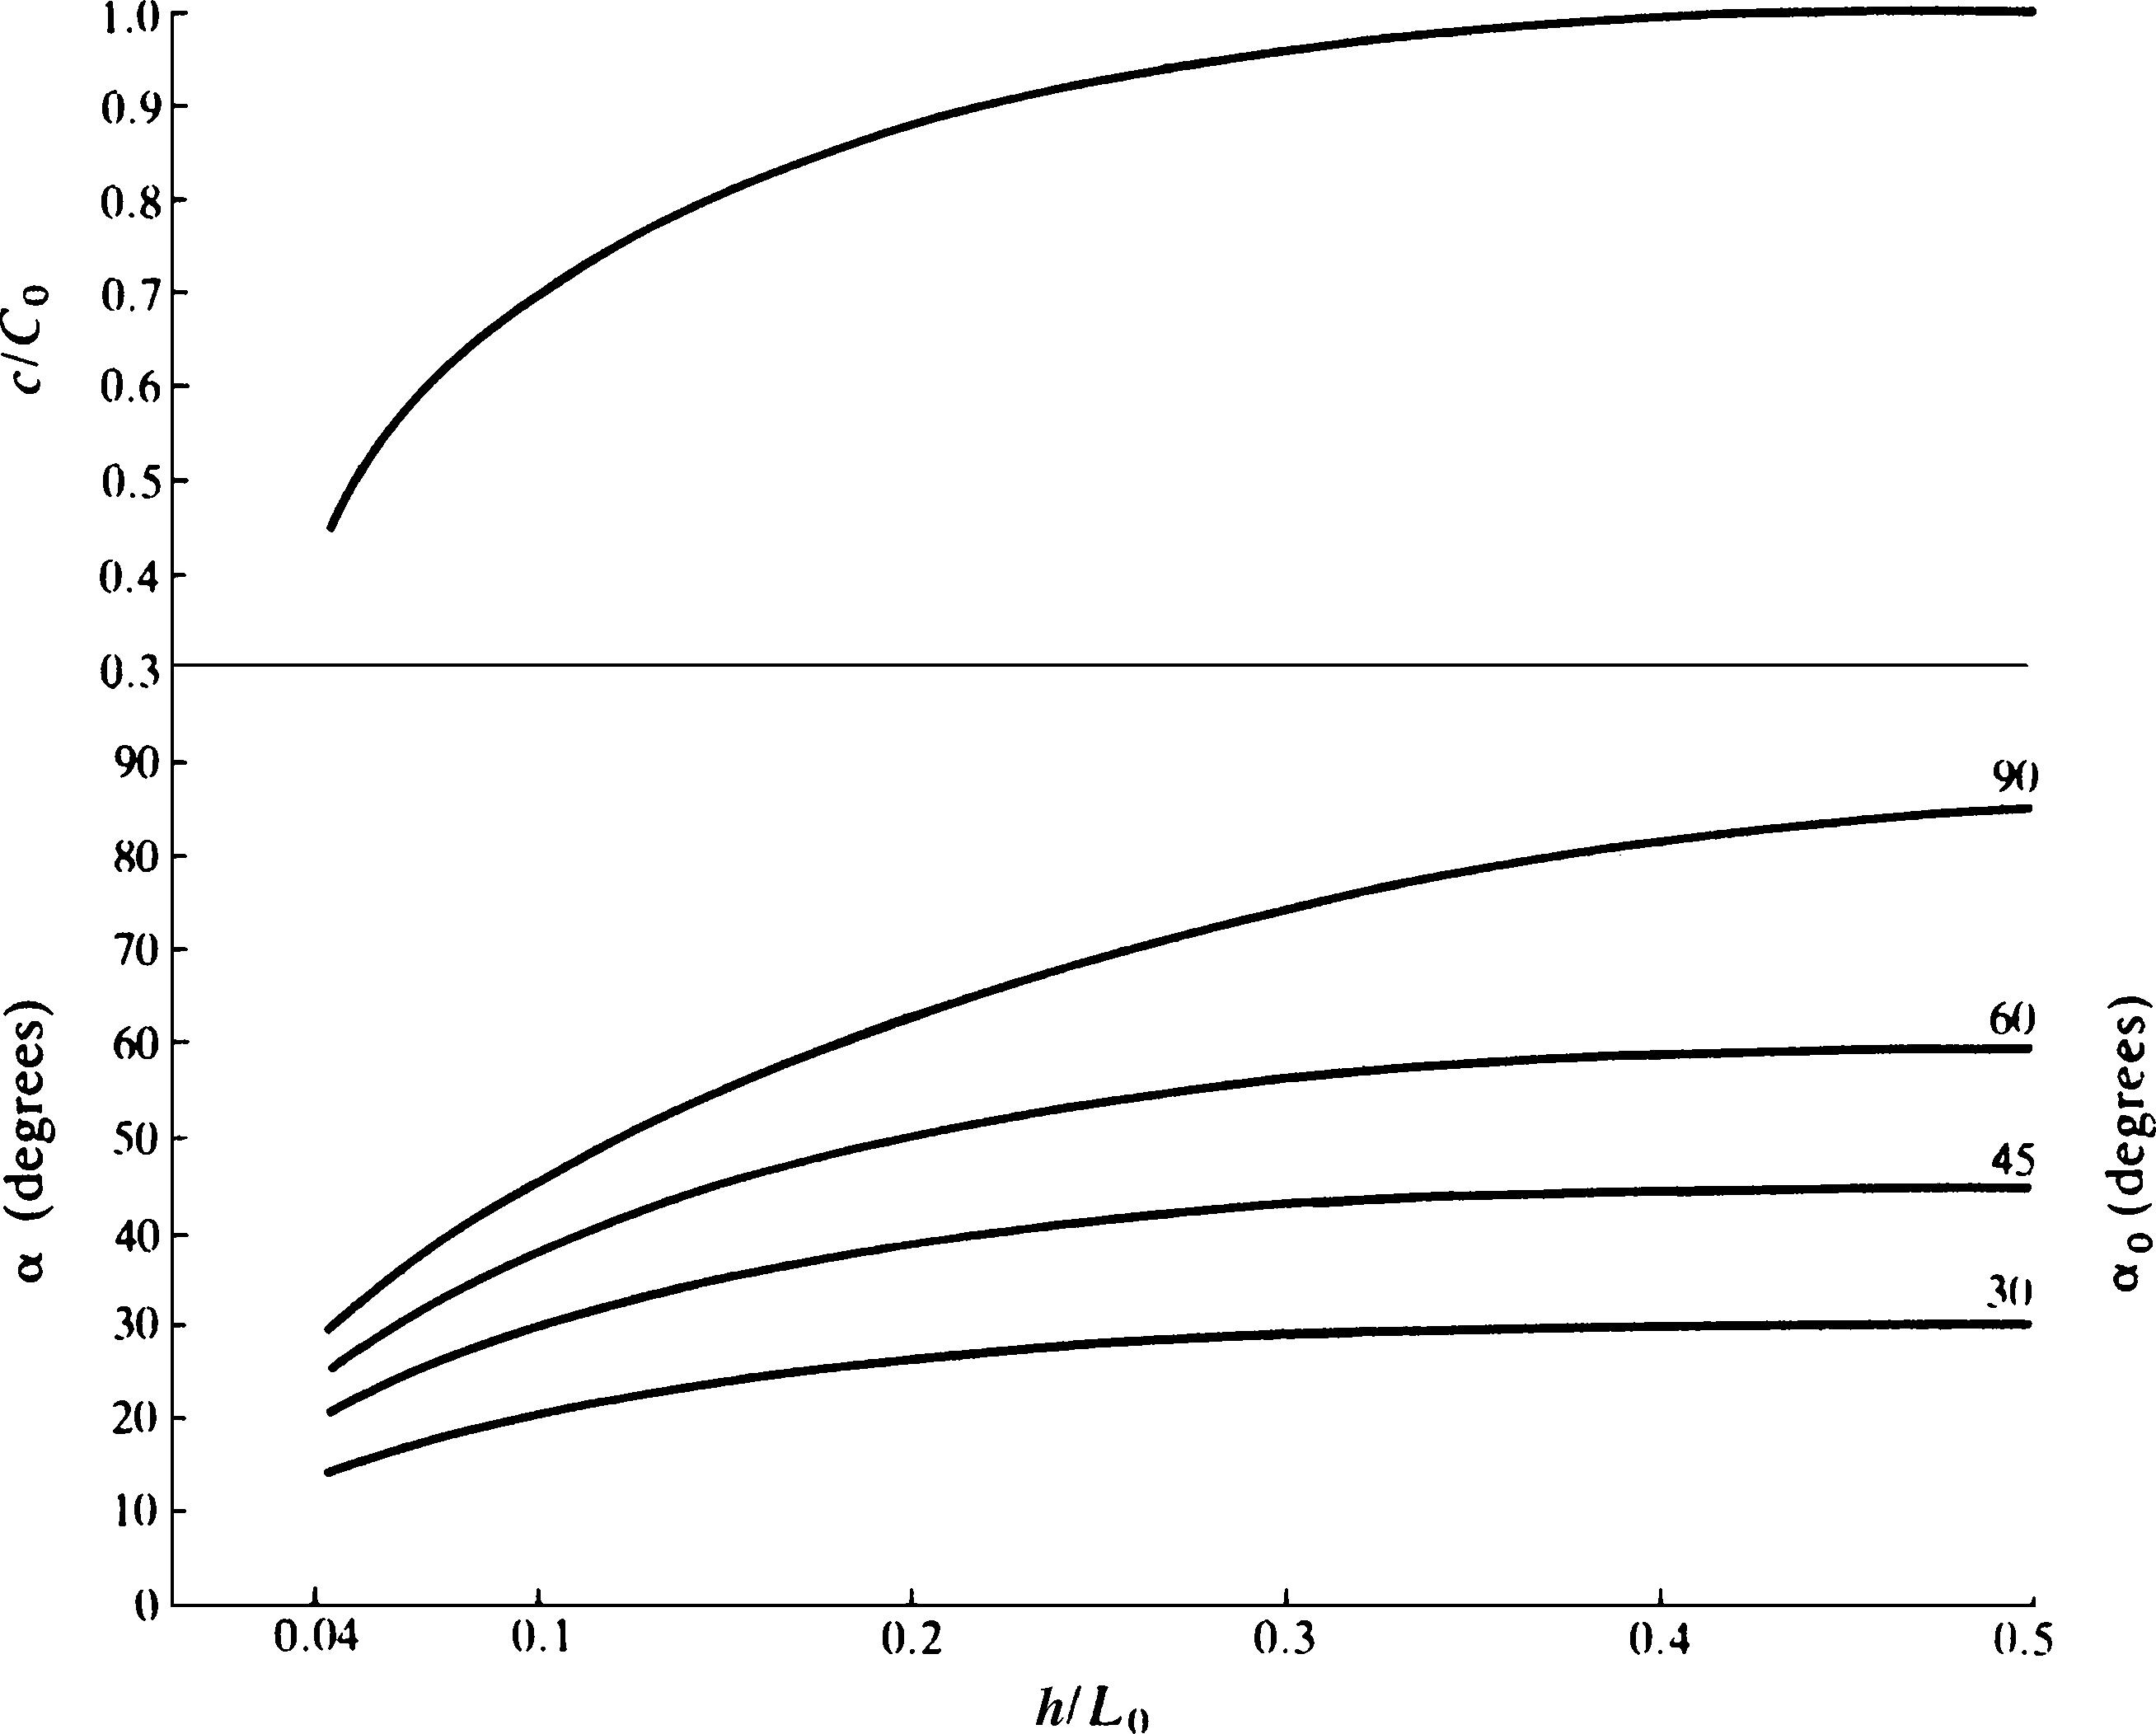
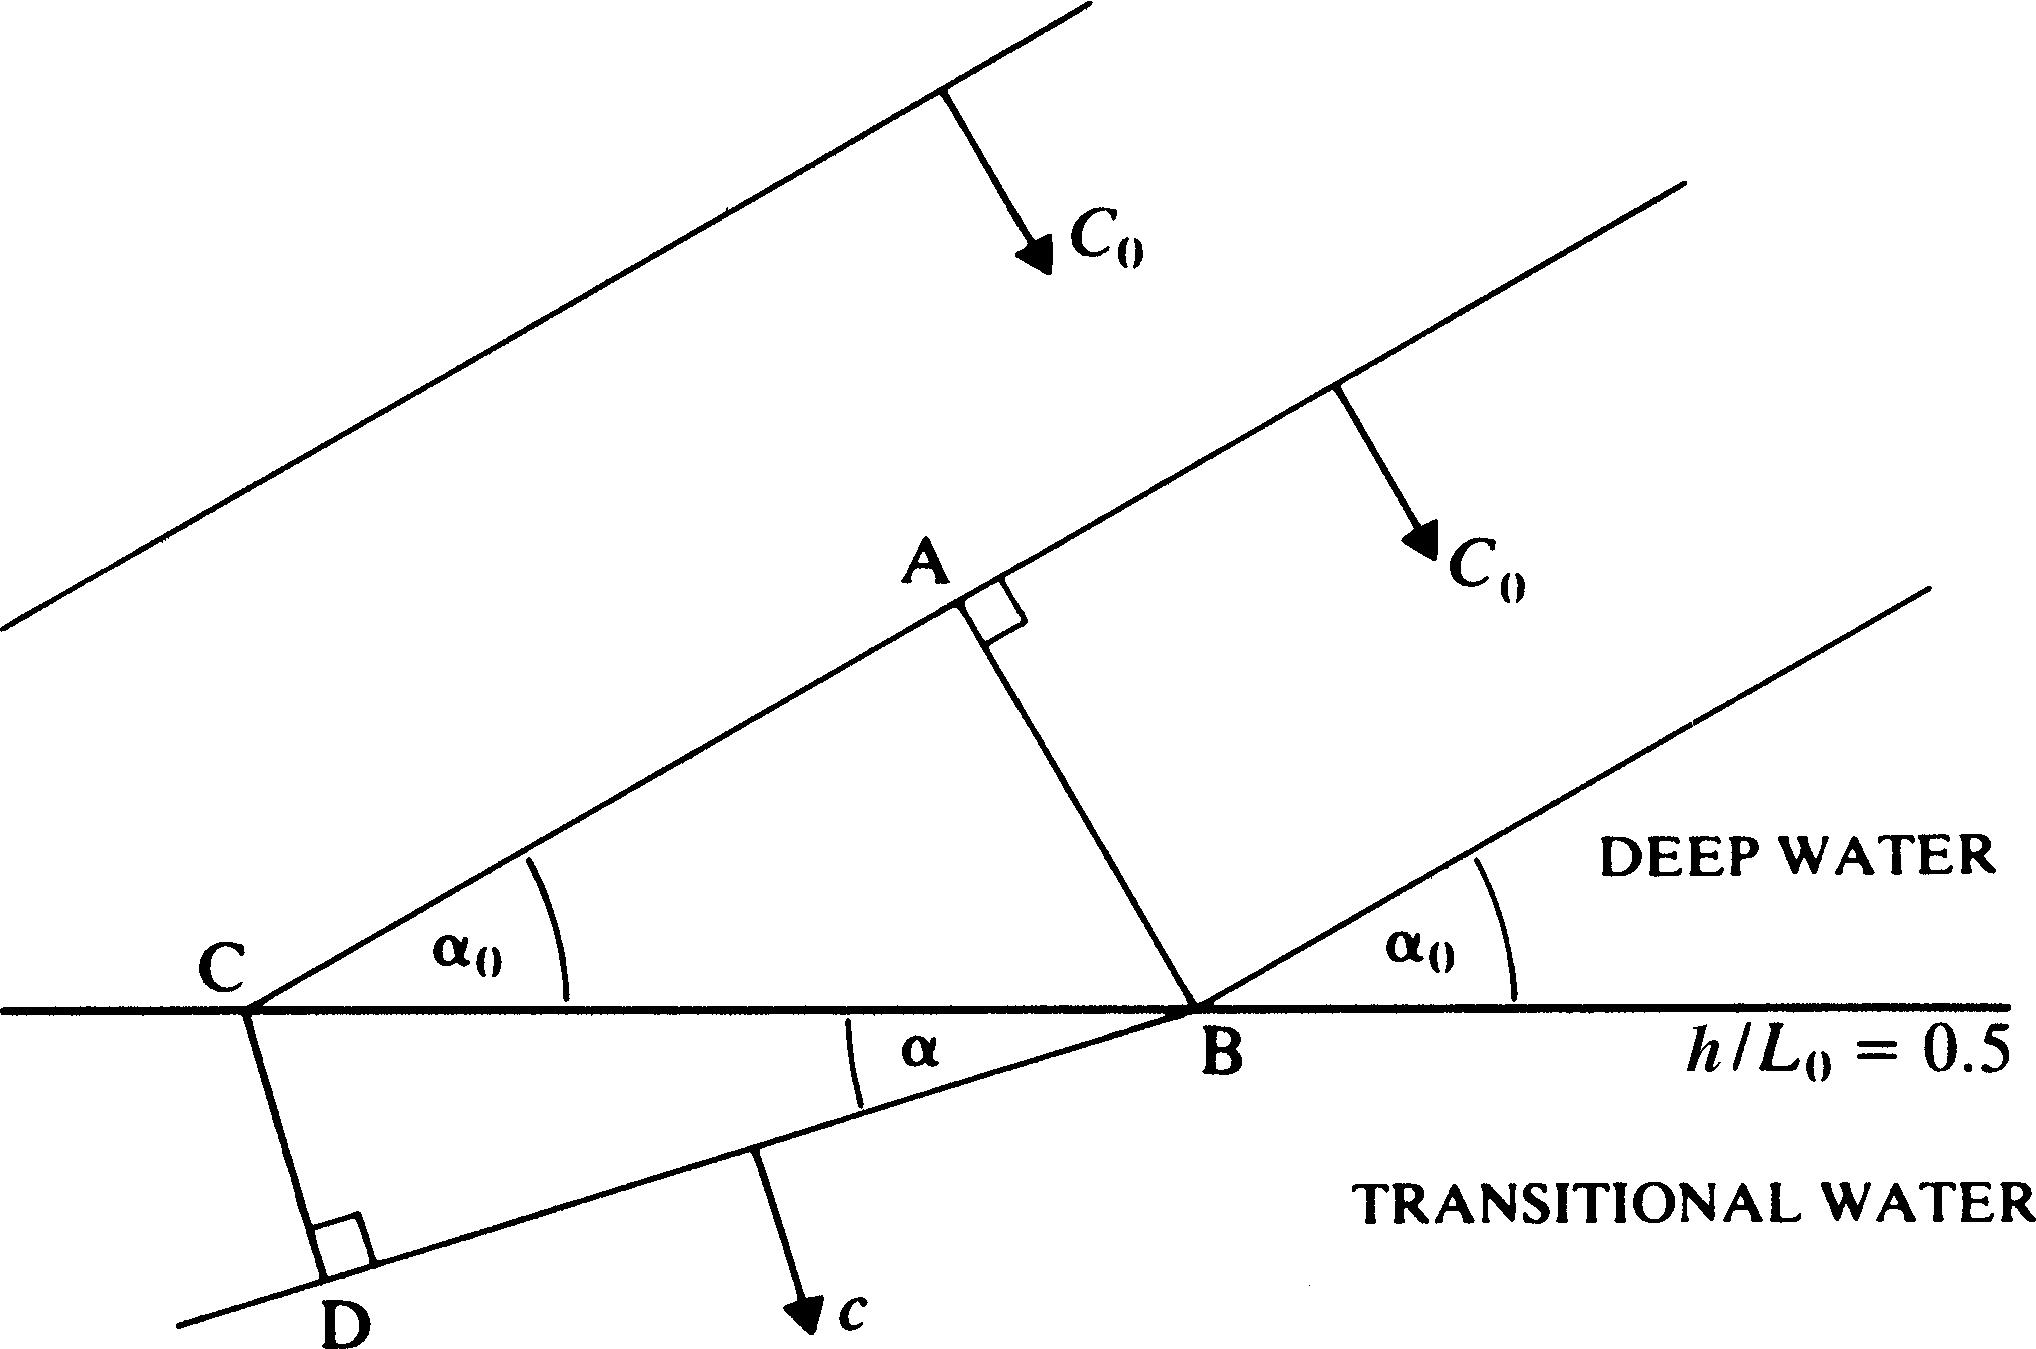
233 KB | Variations of wave celerity and angle with depth. | 1 |
| 09:54, 6 June 2017 | ChadwickFig5.jpg (file) |  |
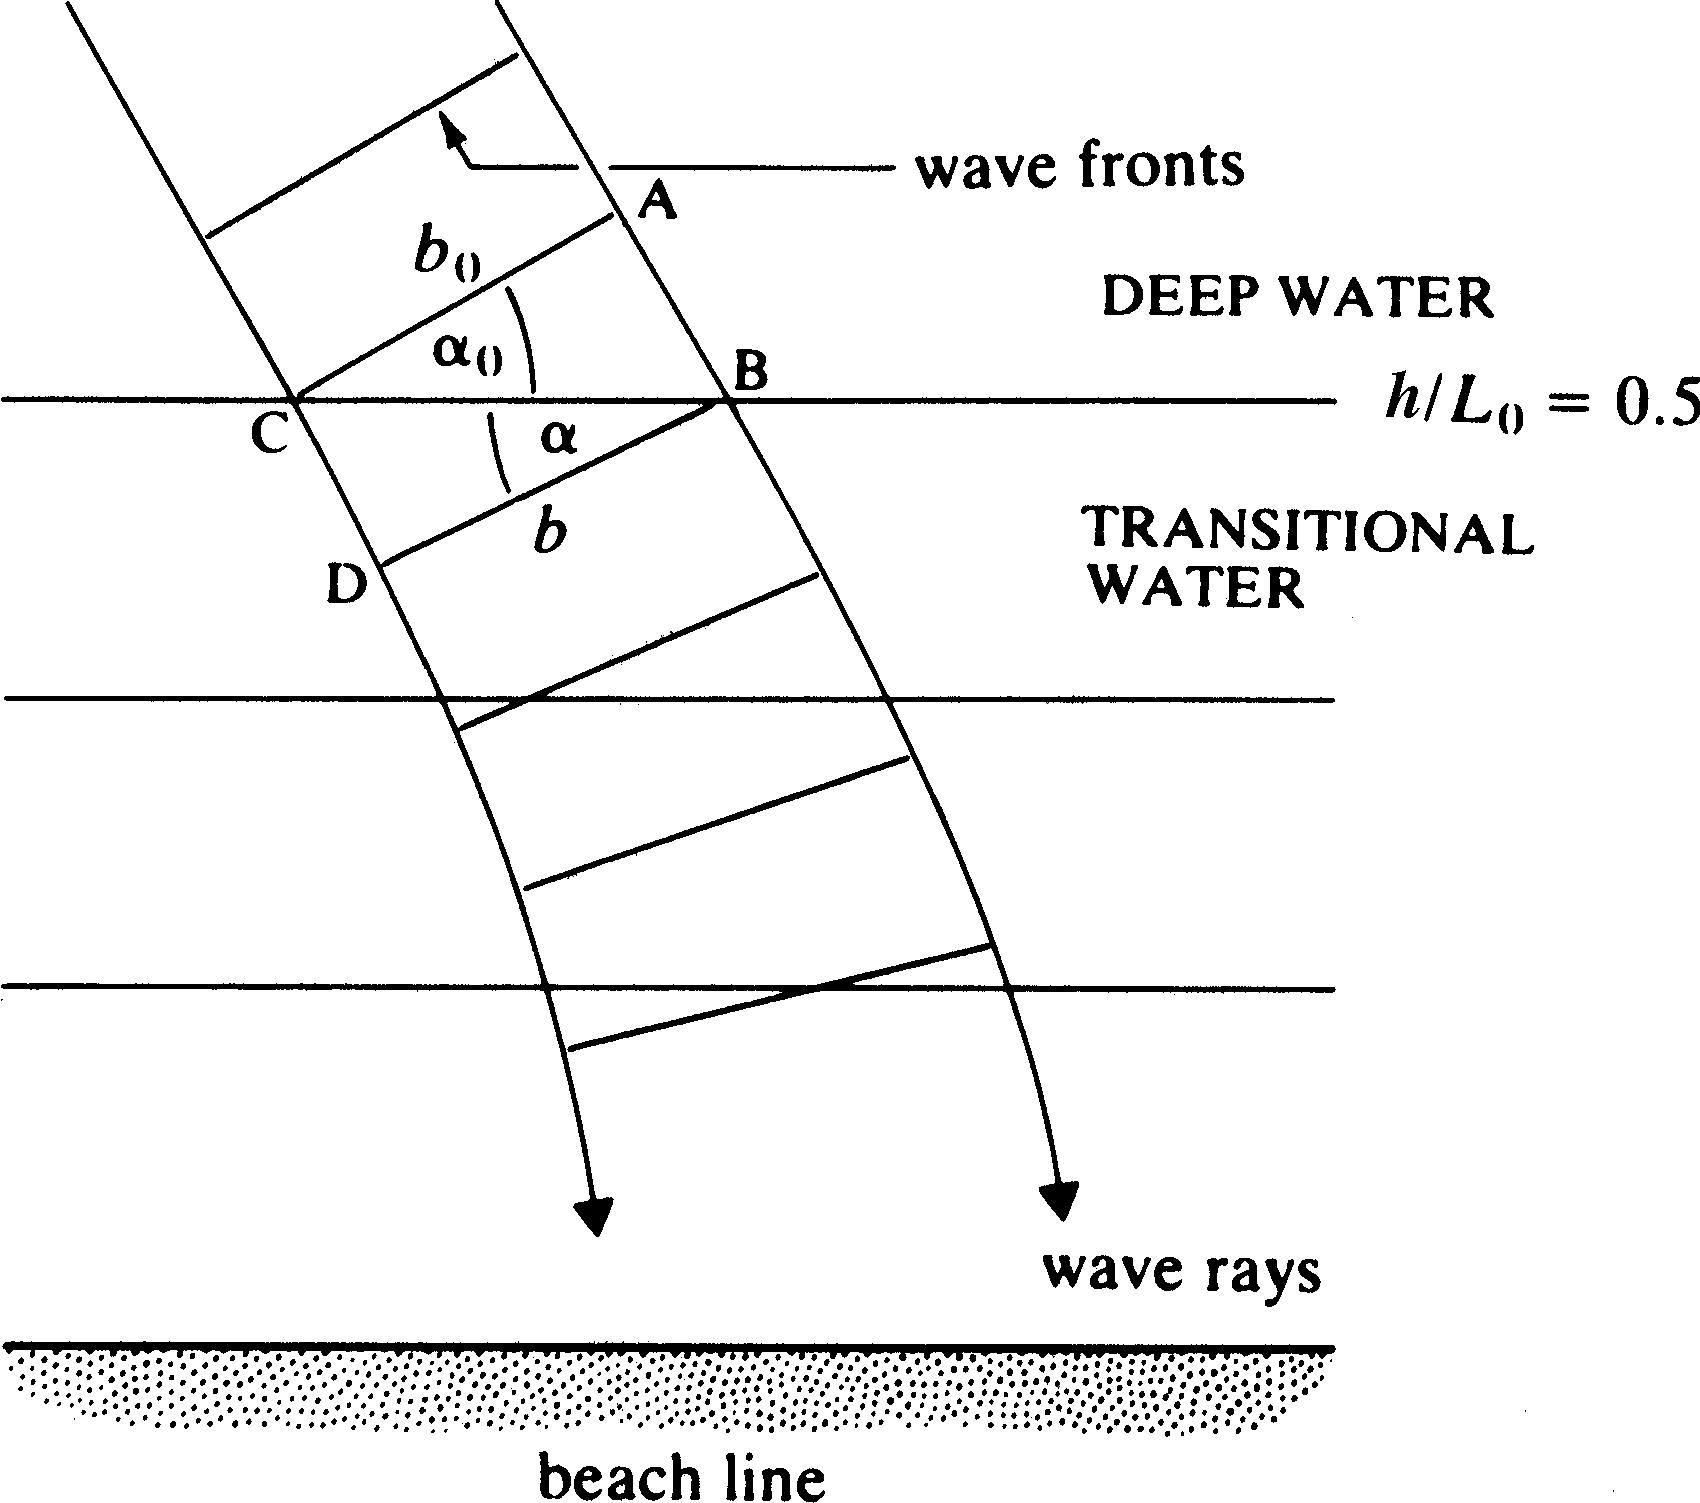
141 KB | Wave refraction. | 1 |
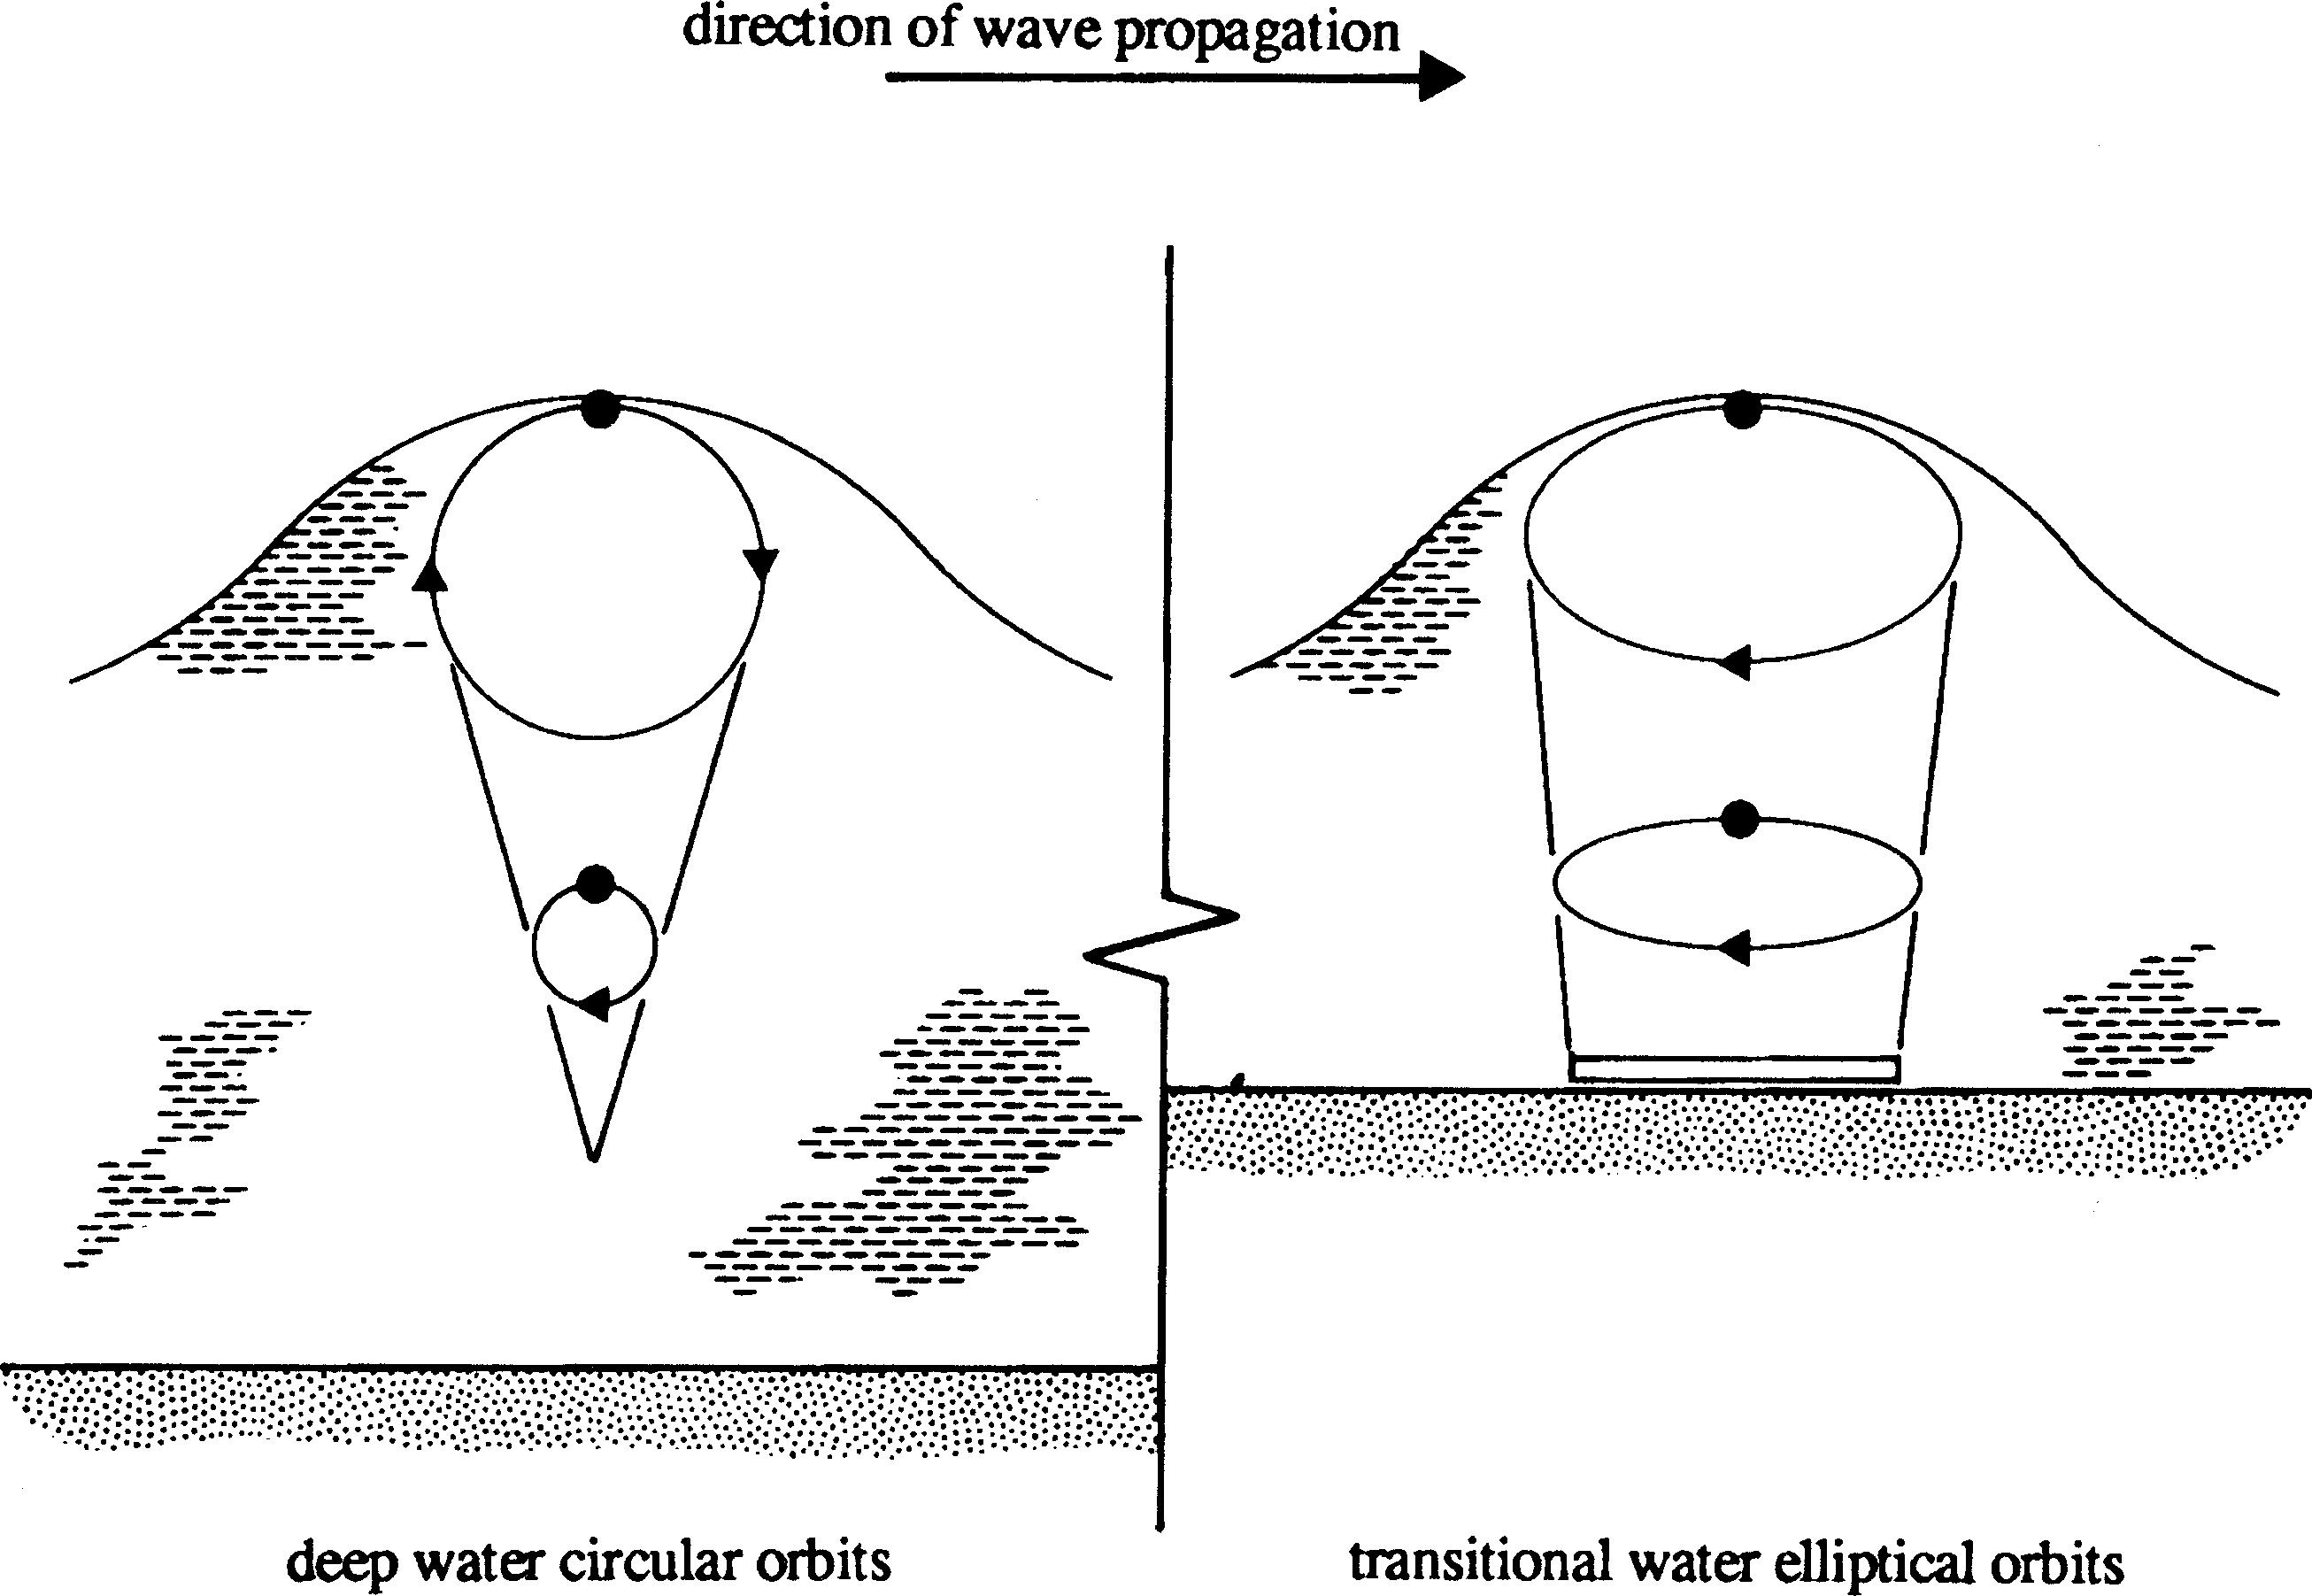
| 09:53, 6 June 2017 | ChadwickFig4.jpg (file) |  |
407 KB | Particle displacements for deep and transitional waves. | 1 |
| 09:52, 6 June 2017 | ChadwickFig3.jpg (file) |  |
11 KB | Definition sketch for a sinusoidal wave. | 1 |
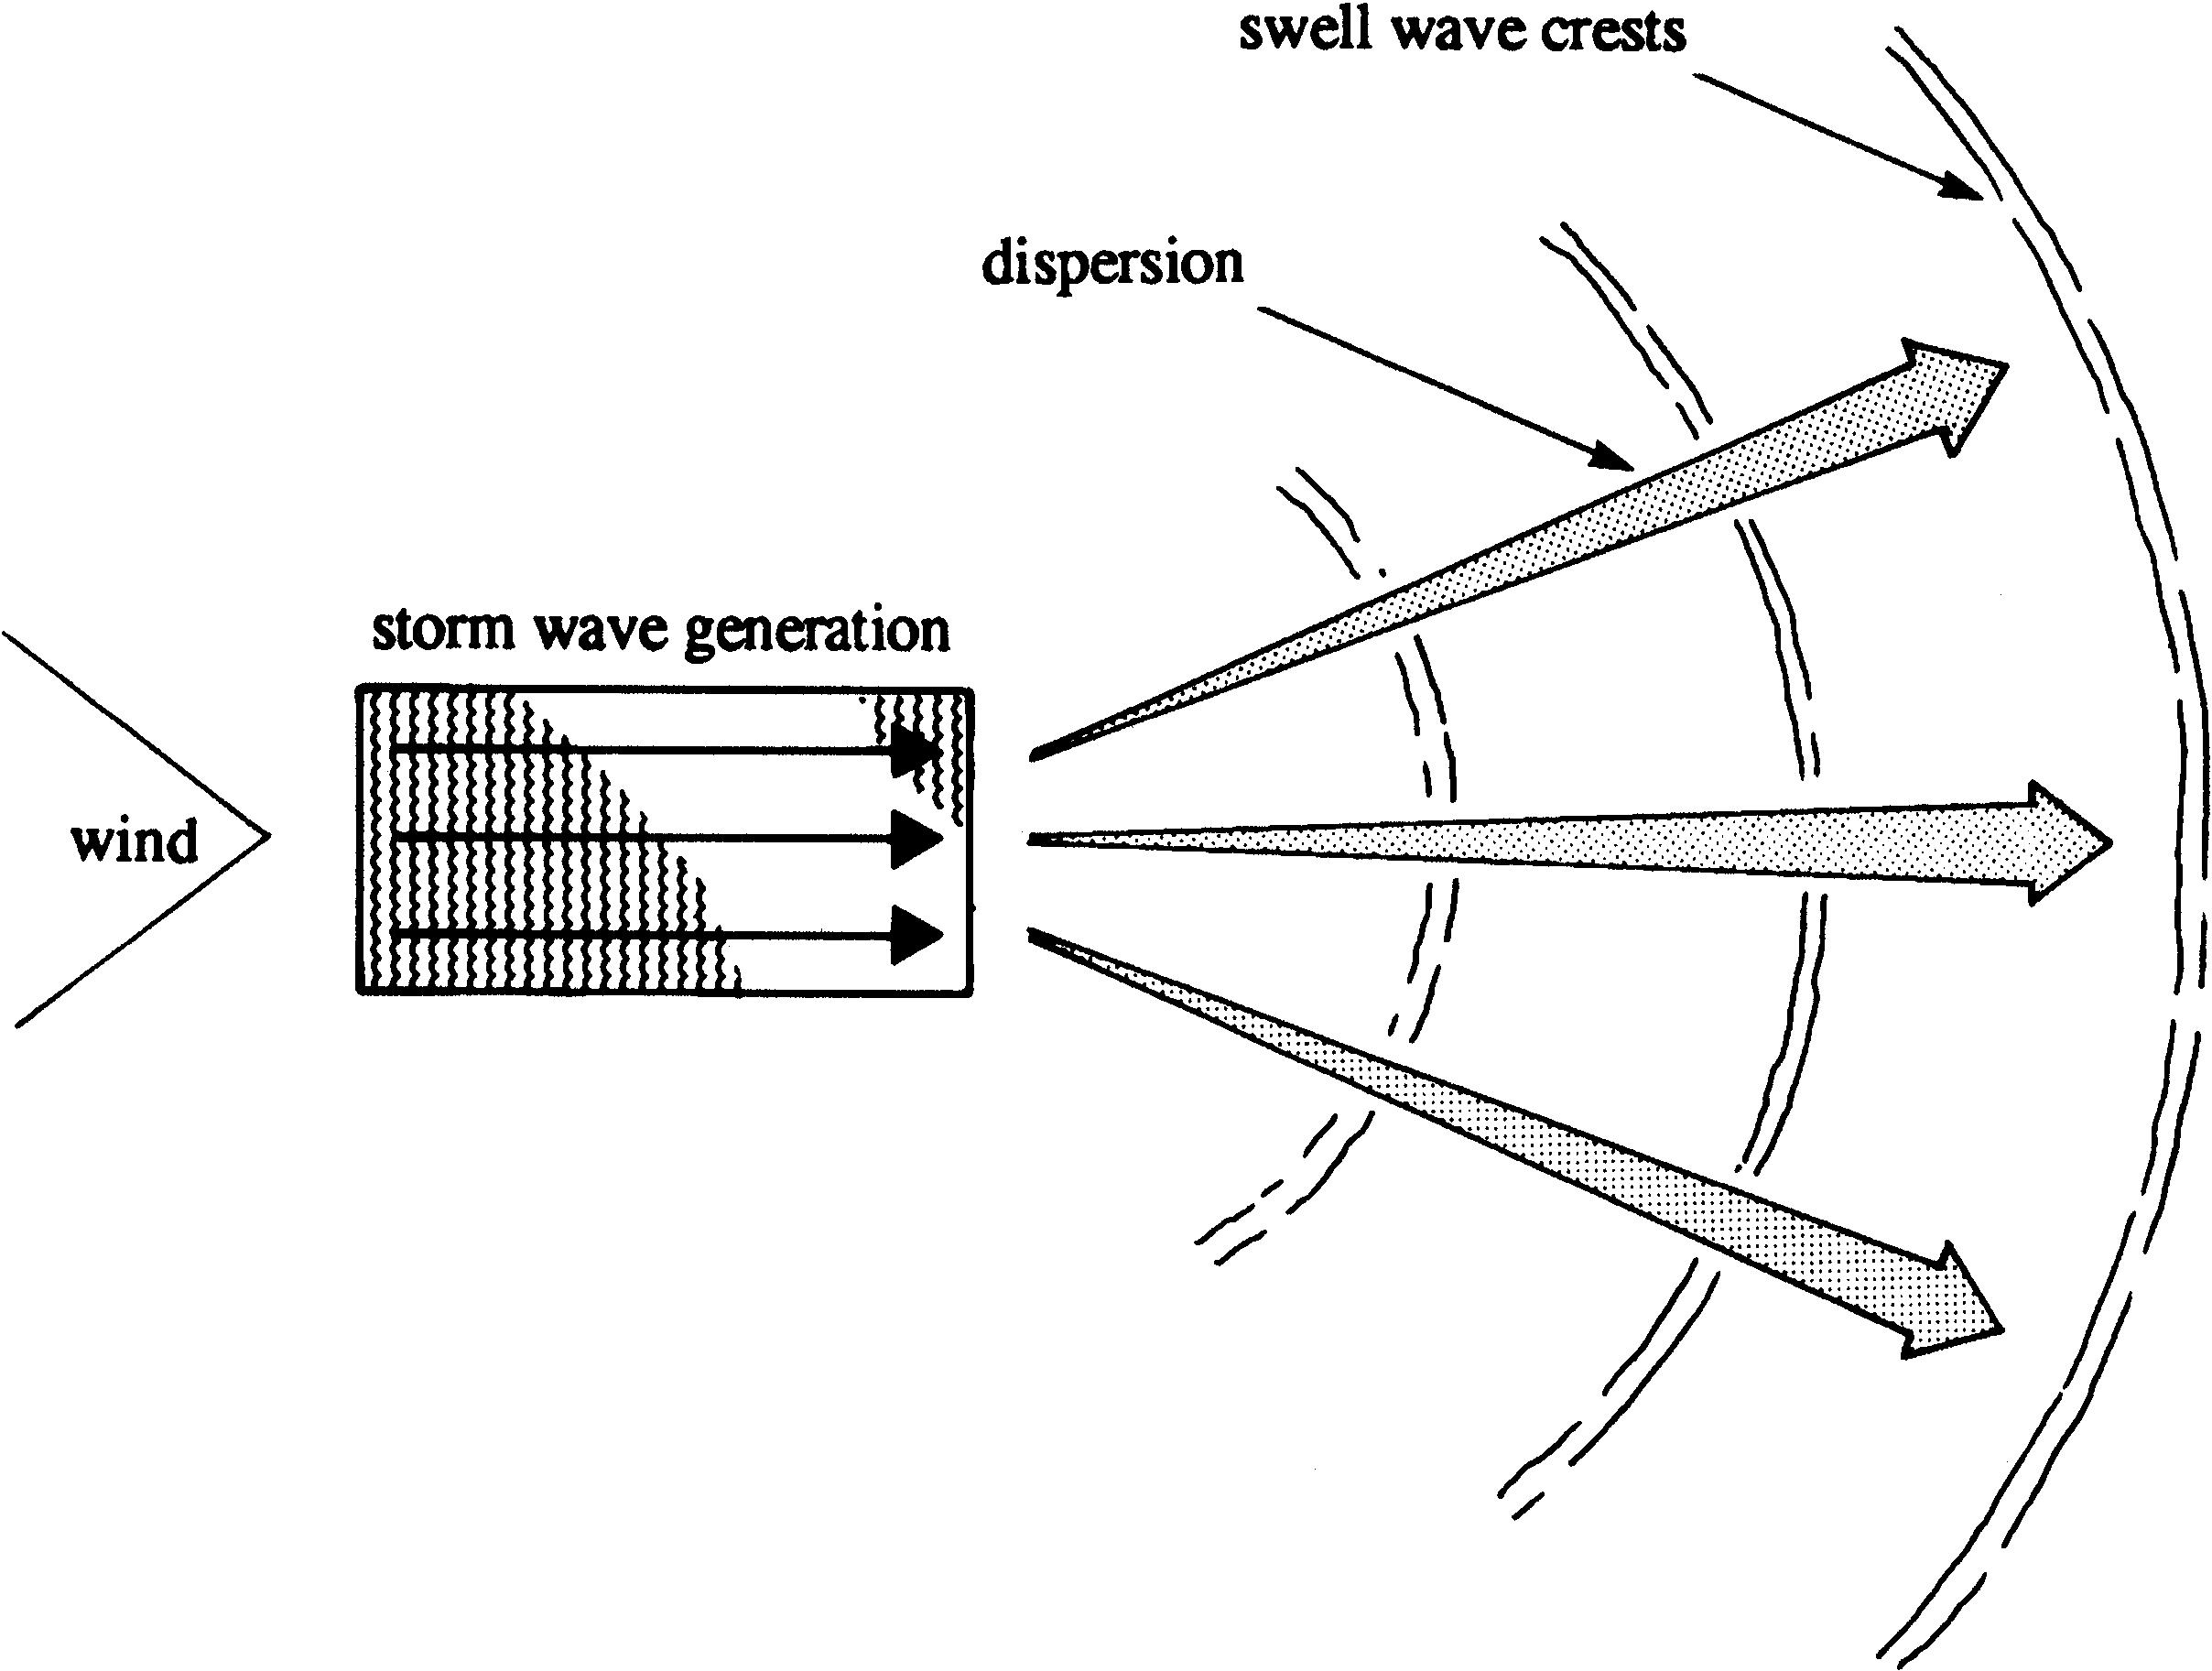
| 09:52, 6 June 2017 | ChadwickFig2b.jpg (file) |  |
1.12 MB | Wave generation and dispersion. | 1 |
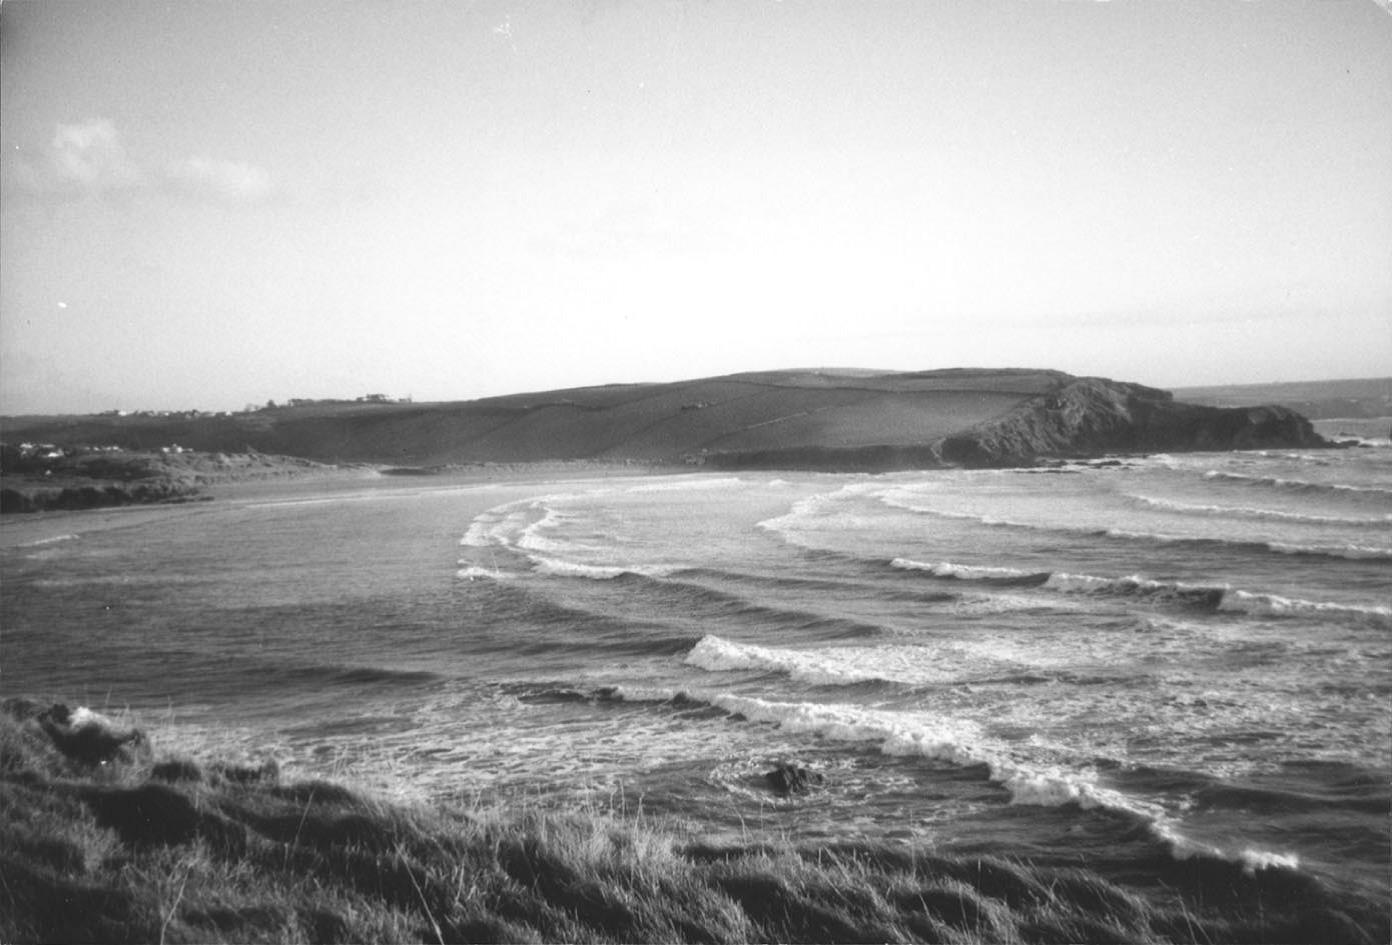
| 09:51, 6 June 2017 | ChadwickFig2a.jpg (file) |  |
133 KB | Wave transformations at Bigbury bay, Devon, England. Photograph courtesy of Dr S M White. | 1 |
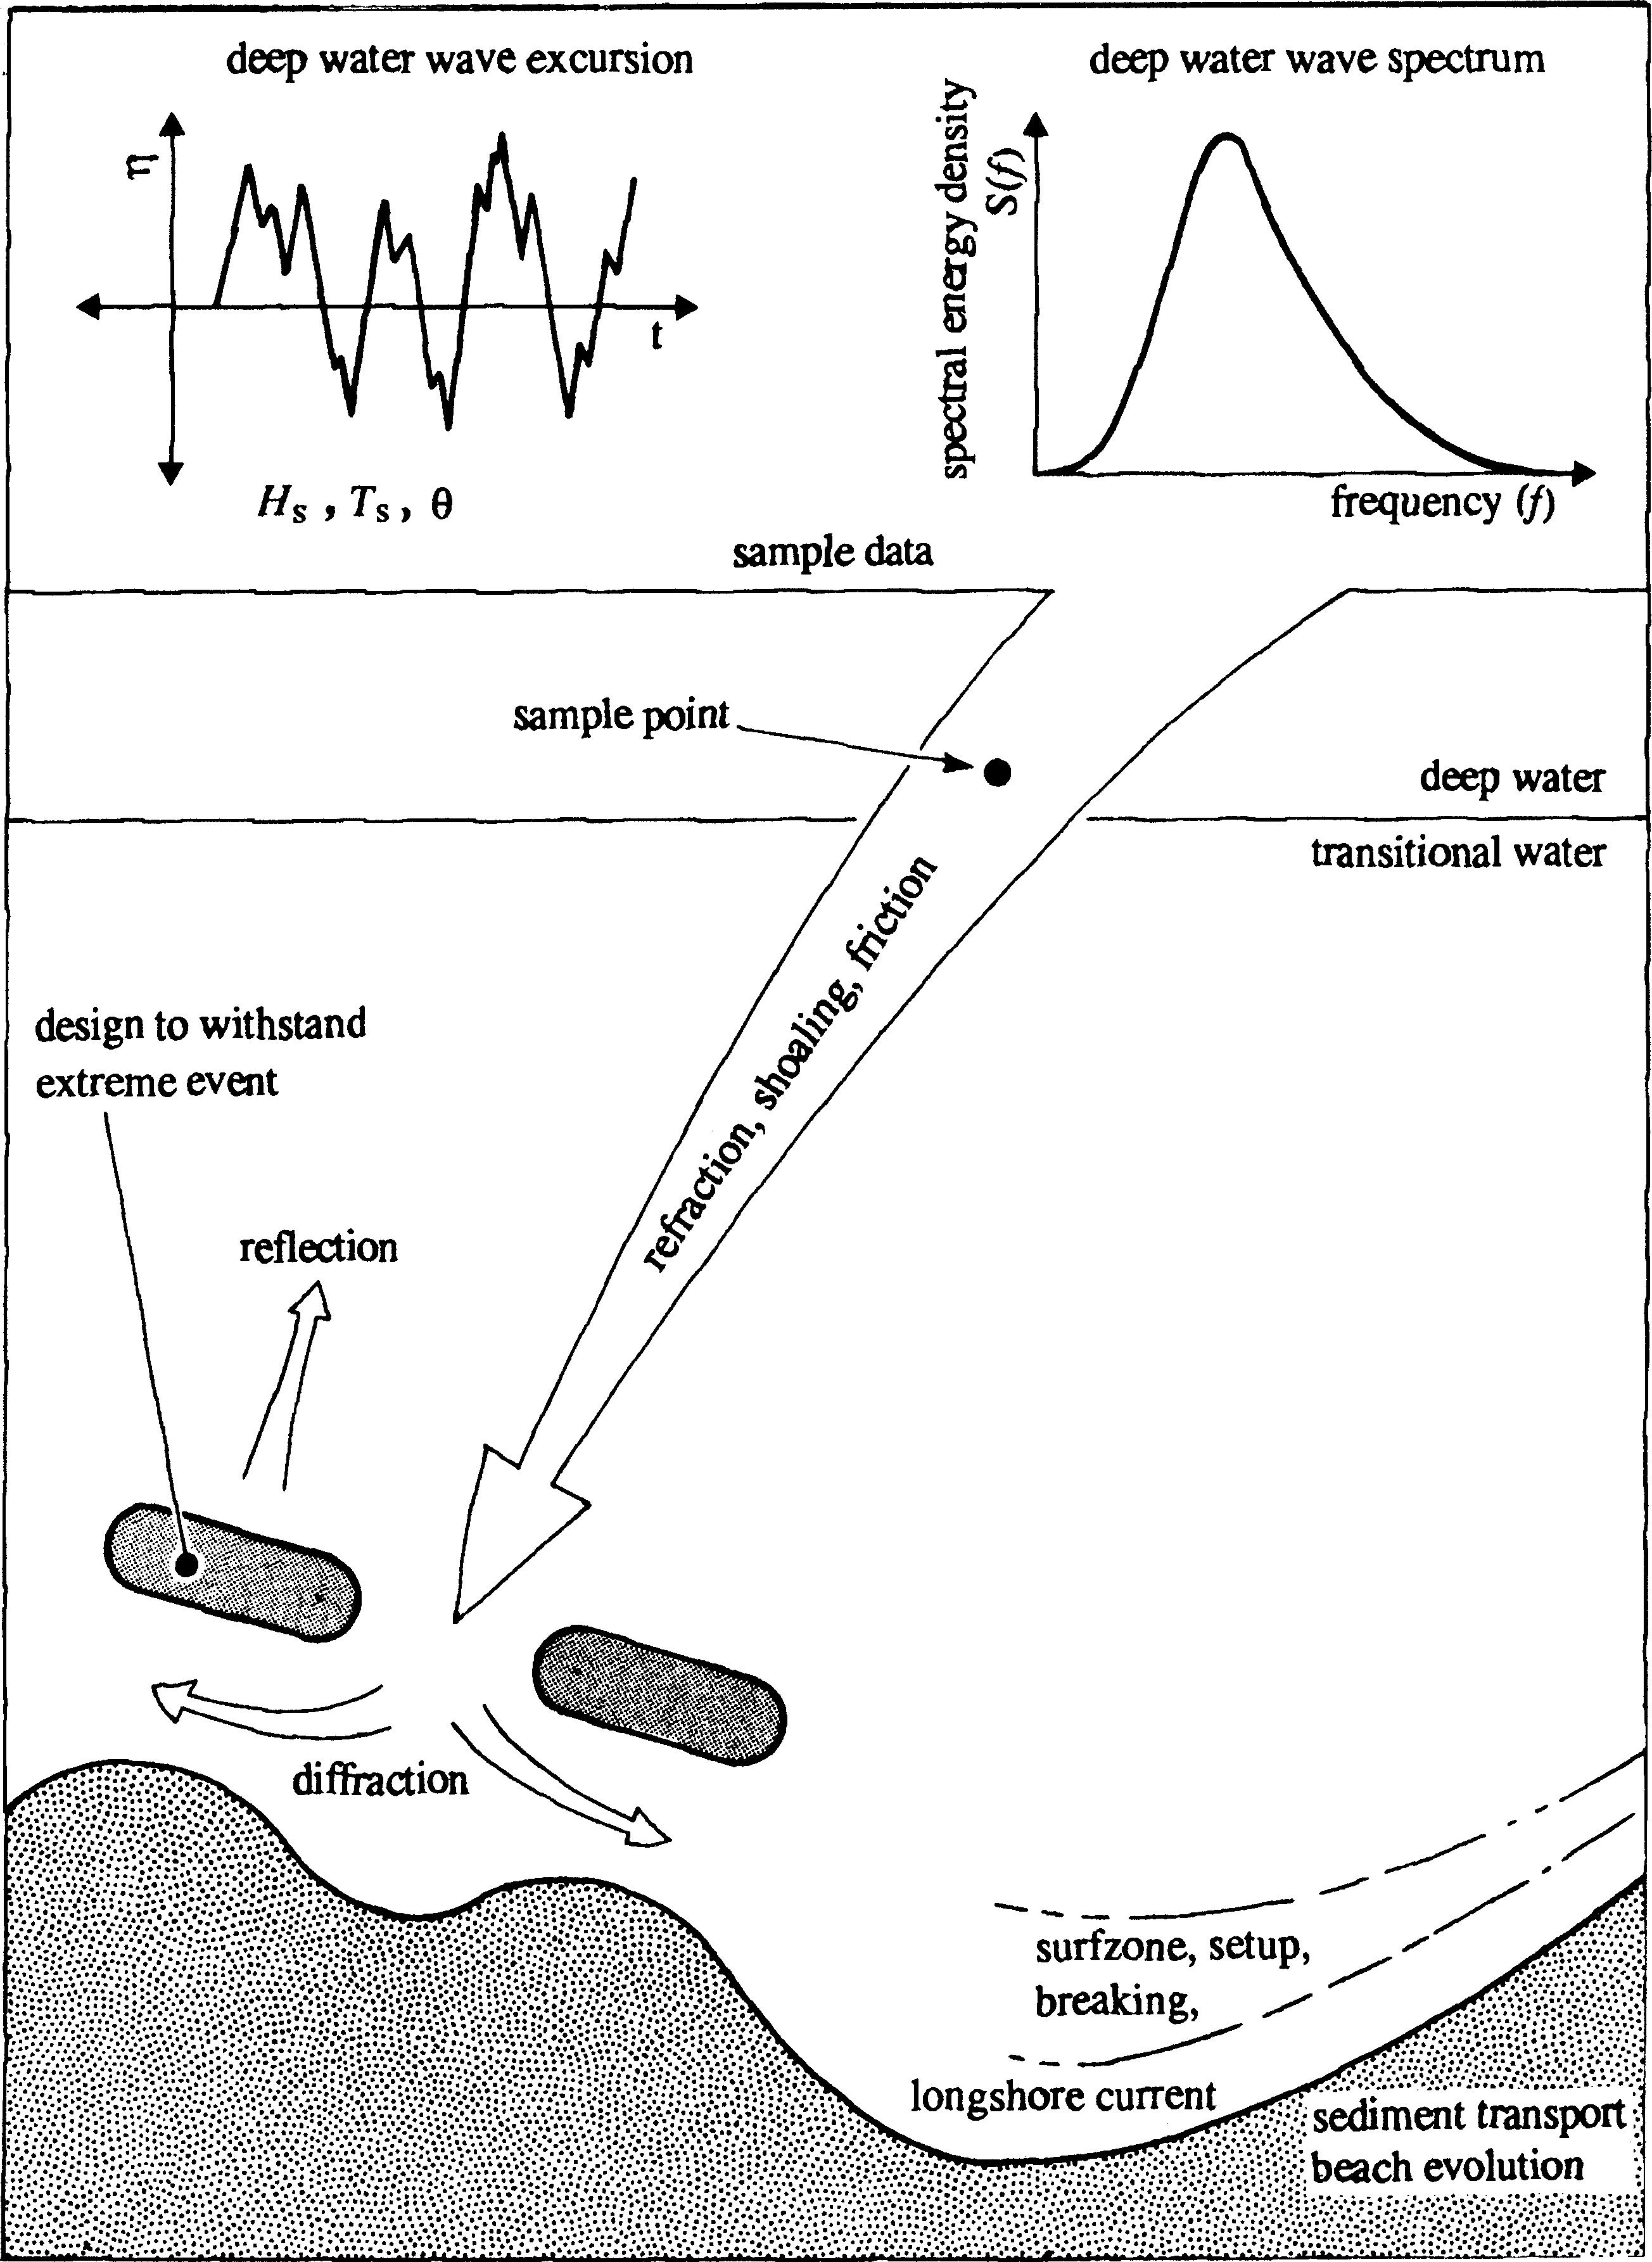
| 09:50, 6 June 2017 | ChadwickFig1.jpg (file) |  |
339 KB | Wave generation and dispersion. | 1 |
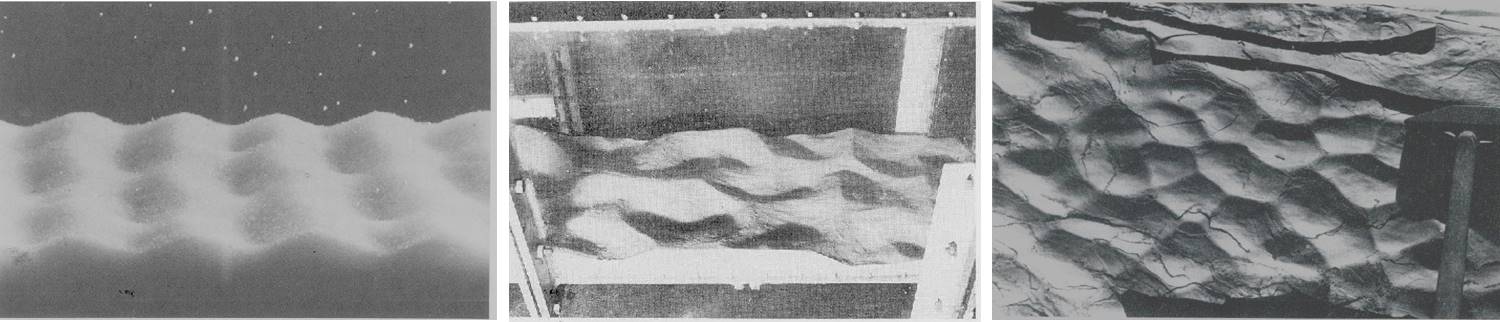
| 20:58, 5 June 2017 | BlondeauxFig7abc.jpg (file) | 70 KB | Left: 7a. Brick-pattern ripples observed during a laboratory experiment. Centre: 7b. Three-dimensional vortex ripples observed during a laboratory experiment (7a and 7b courtesy of John F.A. Sleath).Right: 7c. Tile ripples (adapted from Allen<ref name=... | 1 | |
| 14:32, 5 June 2017 | BlondeauxFig10.jpg (file) |  |
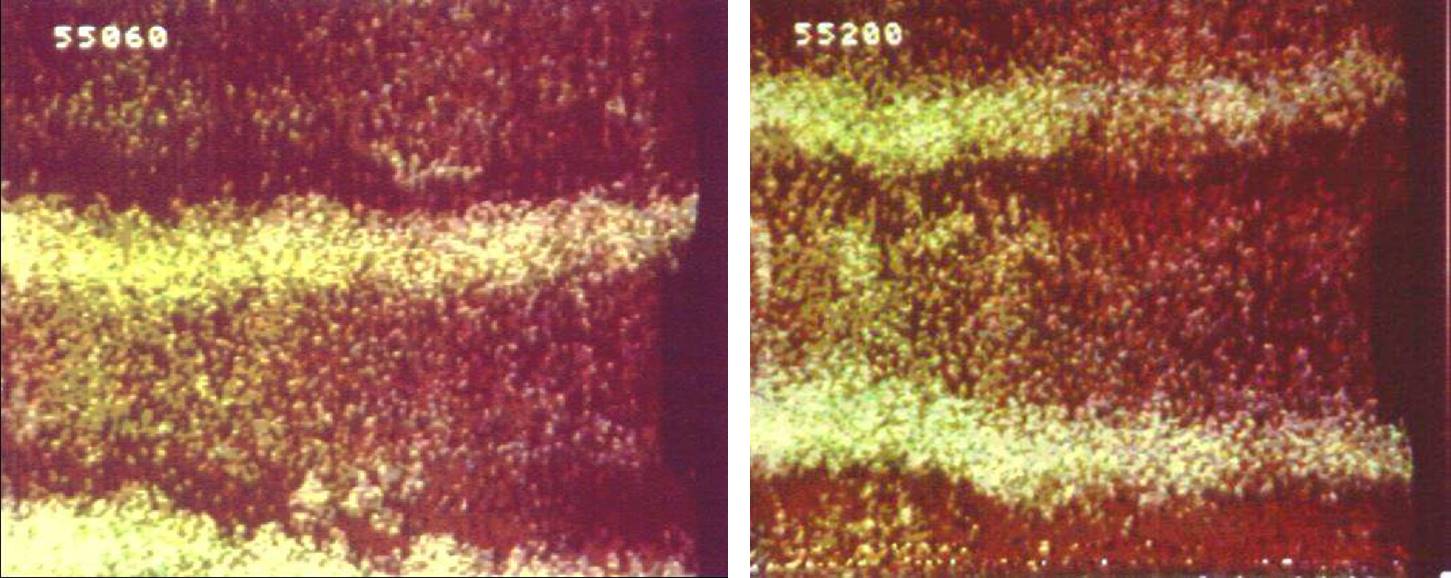
121 KB | The yellow sediment grains are coarser that the red sediments and pile up at the crests of the ripples which are generated in a U-tube by an oscillatory flow. The figure shows a top view of the bottom at two different phases of the cycle (adapted from... | 1 |
| 14:30, 5 June 2017 | BlondeauxFig9.jpg (file) |  |
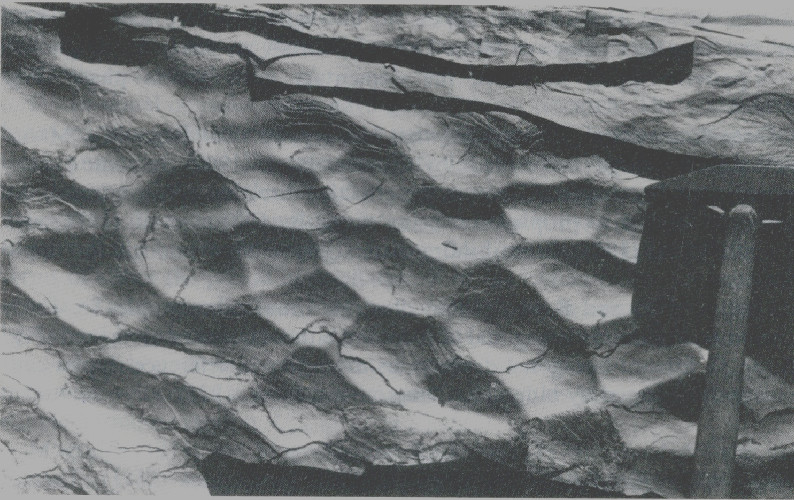
139 KB | Tile ripples. Reproduced from Allen J.R.L. (1984). Sedimentary structures, their character and physical basis. Elsevier, figure 11.12. | 1 |
| 14:28, 5 June 2017 | BlondeauxFig8.jpg (file) |  |
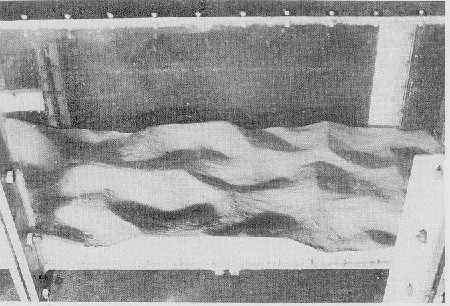
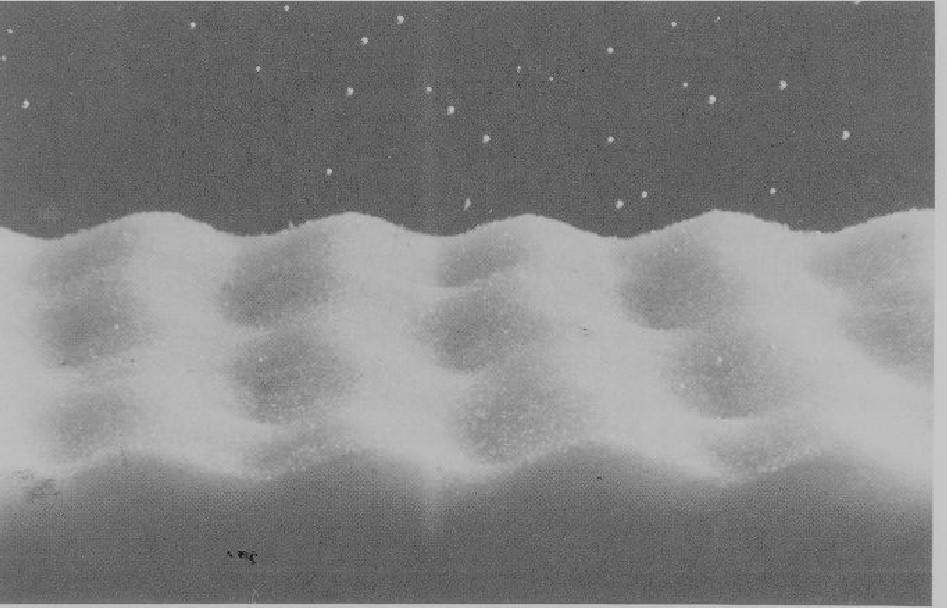
57 KB | Three-dimensional vortex ripples observed during a laboratory experiment (courtesy of John F.A. Sleath). | 1 |
| 14:27, 5 June 2017 | BlondeauxFig7.jpg (file) |  |
128 KB | Brick-pattern ripples observed during a laboratory experiment (courtesy of John F.A. Sleath). | 1 |
| 14:26, 5 June 2017 | BlondeauxFig6.jpg (file) |  |
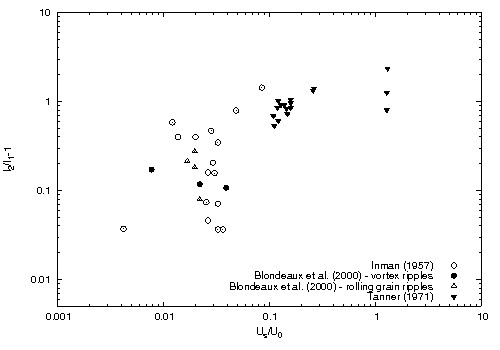
20 KB | Ripple symmetry index plotted versus the ratio between the mass-transport velocity and the maximum near-bed orbital velocity. | 1 |
| 14:25, 5 June 2017 | BlondeauxFig5.jpg (file) |  |
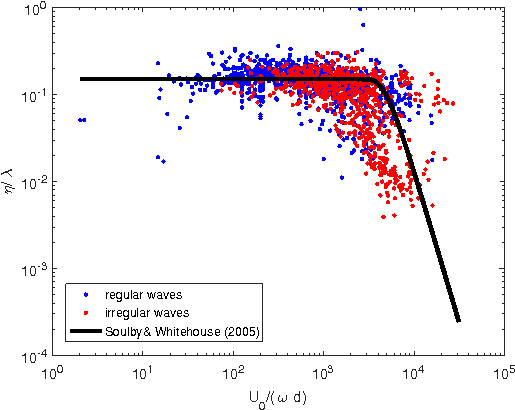
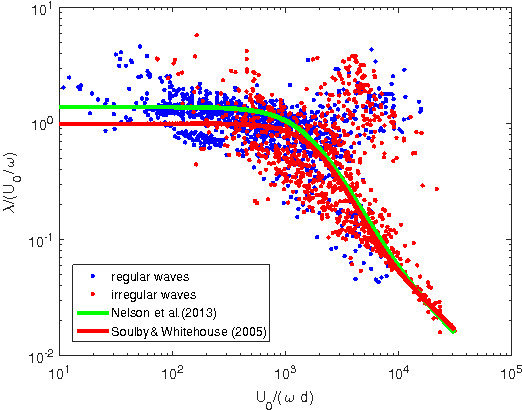
55 KB | Comparison between predicted (line) and observed (points) ripple steepnesses. | 1 |
| 14:25, 5 June 2017 | BlondeauxFig4.jpg (file) |  |
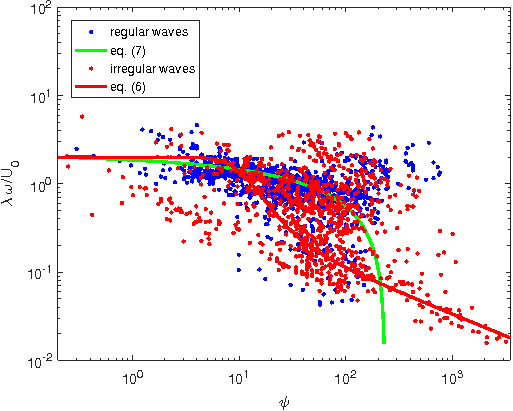
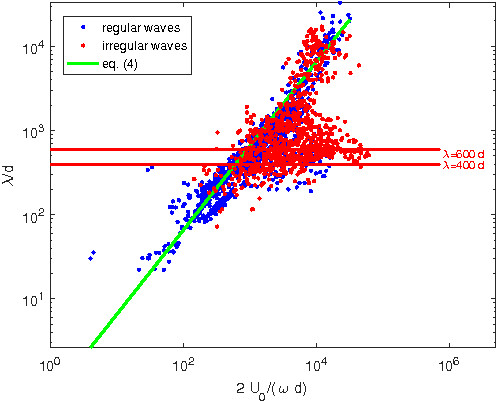
76 KB | Comparison between predicted (lines) and observed (points) ripple wavelengths. | 1 |
| 14:24, 5 June 2017 | BlondeauxFig3.jpg (file) |  |
51 KB | Comparison between predicted (lines) and observed (points) ripple wavelengths. | 1 |
| 14:24, 5 June 2017 | BlondeauxFig2.jpg (file) |  |
78 KB | Comparison between predicted (lines) and observed (points) ripple wavelengths. | 1 |
| 14:23, 5 June 2017 | BlondeauxFig1.jpg (file) |  |
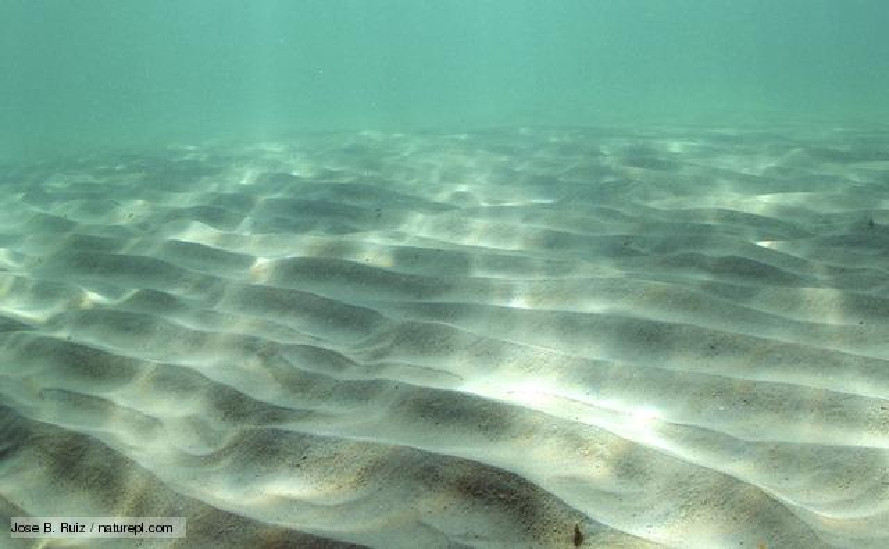
94 KB | Ripple marks in the Mediterranean Sea. Courtesy of José B. Ruiz. | 1 |
| 10:14, 31 May 2017 | BaldockFig3NEW2.jpg (file) |  |
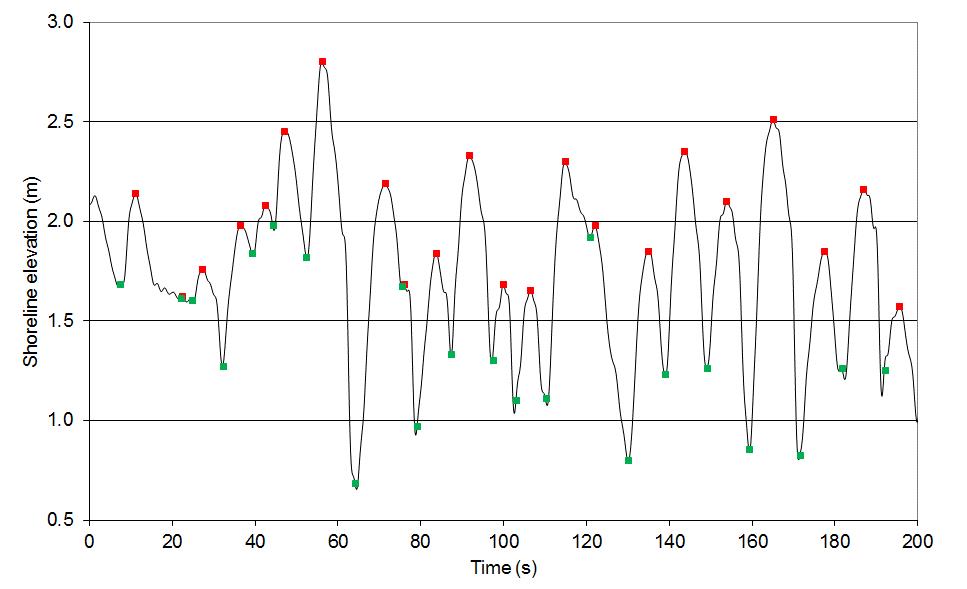
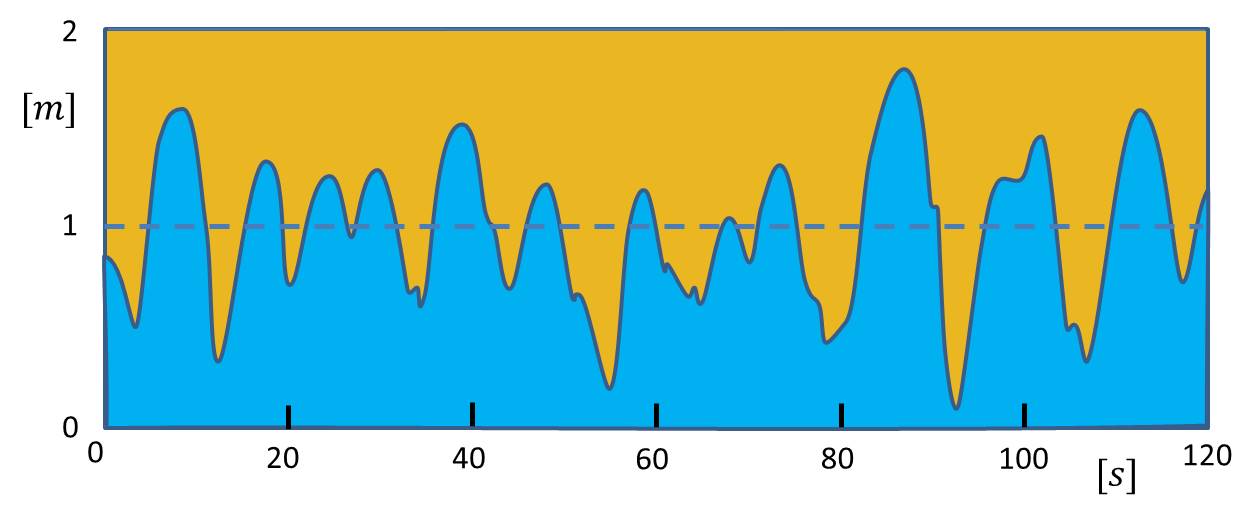
50 KB | Typical pattern of bore-driven swash oscillations (vertical component). Data show shoreline elevation versus time at Avoca Beach, NSW. Red and green squares indicate maxima and minima of individual swash events. Data courtesy of Dr Michael Hughes, NSW... | 1 |
| 22:26, 30 May 2017 | BaldockFig3NEW.jpg (file) |  |
42 KB | Typical pattern of vertical shoreline oscillations (in metres) as a function of time (seconds). Redrawn from Stockdon, H. F., Holman, R. A., Howd, P. A. and Sallenger JR, A. H. 2006. Empirical parameterization of setup, swash, and runup. Coastal Engine... | 1 |
| 15:05, 30 May 2017 | BaldockFig7NEW.jpg (file) |  |
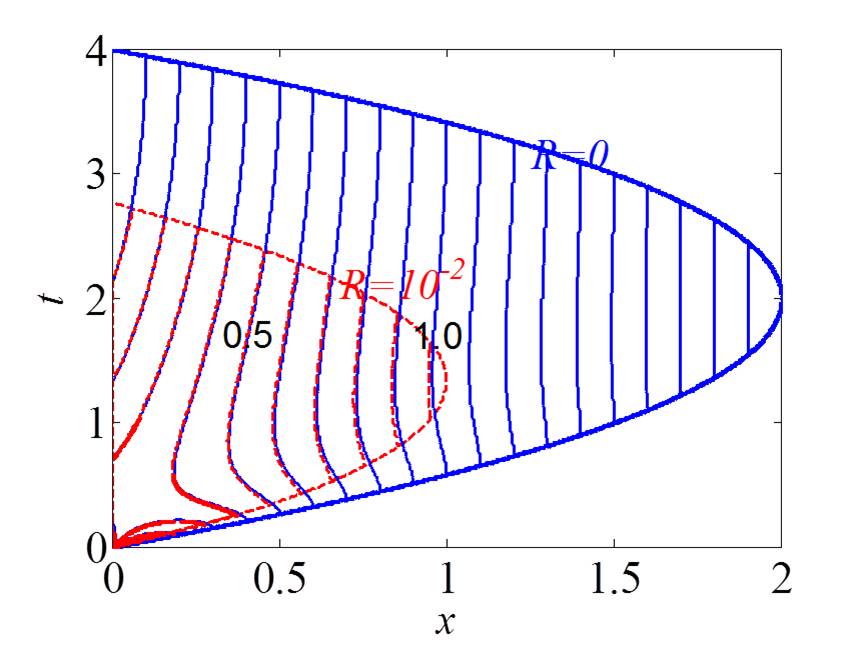
60 KB | Contours of surface elevation with two different resistance coefficients, R=0 (blue lines) and R=0.01 (red dashed lines) in non-dimensional coordinates. From: Deng, X., H. Liu, Z. Jiang and T. E. Baldock, 2016. Swash flow properties with bottom resista... | 1 |
| 09:22, 30 May 2017 | BaldockFig10.jpg (file) |  |
333 KB | A LIDAR system mounted above the swash zone, together with ultrasonic distance point sensors. Photo: Dr Chris Blenkinsopp, University of Bath, UK. | 1 |
| 09:21, 30 May 2017 | BaldockFig9.jpg (file) |  |
56 KB | Measured normalized suspended sediment concentration indicated by colours mapped onto the normalised x*-t* plane representing the swash excursion and duration. From: Hughes, M. G., T. Aagaard and T. E. Baldock, 2007. Suspended sediment in the swash zon... | 1 |
| 09:19, 30 May 2017 | BaldockFig8.jpg (file) |  |
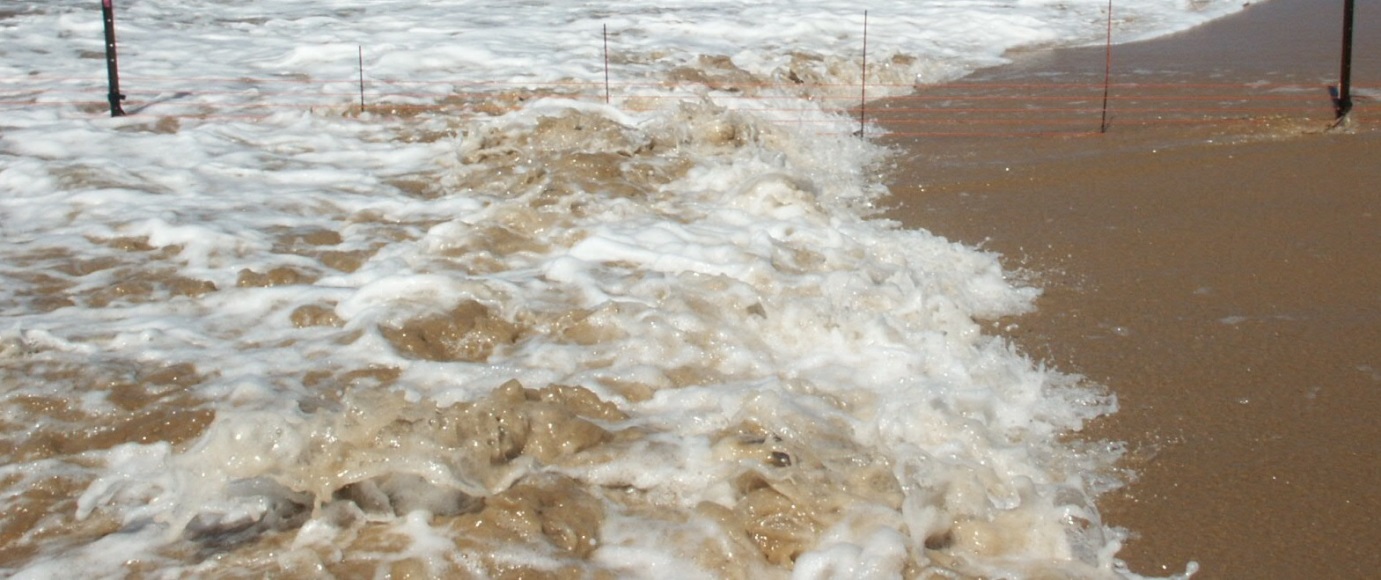
220 KB | A turbulent bore containing entrained suspended sediment just prior to reaching the swash zone. Photo T. Baldock | 1 |