File list
This special page shows all uploaded files.
| Date | Name | Thumbnail | Size | Description | Versions |
|---|---|---|---|---|---|
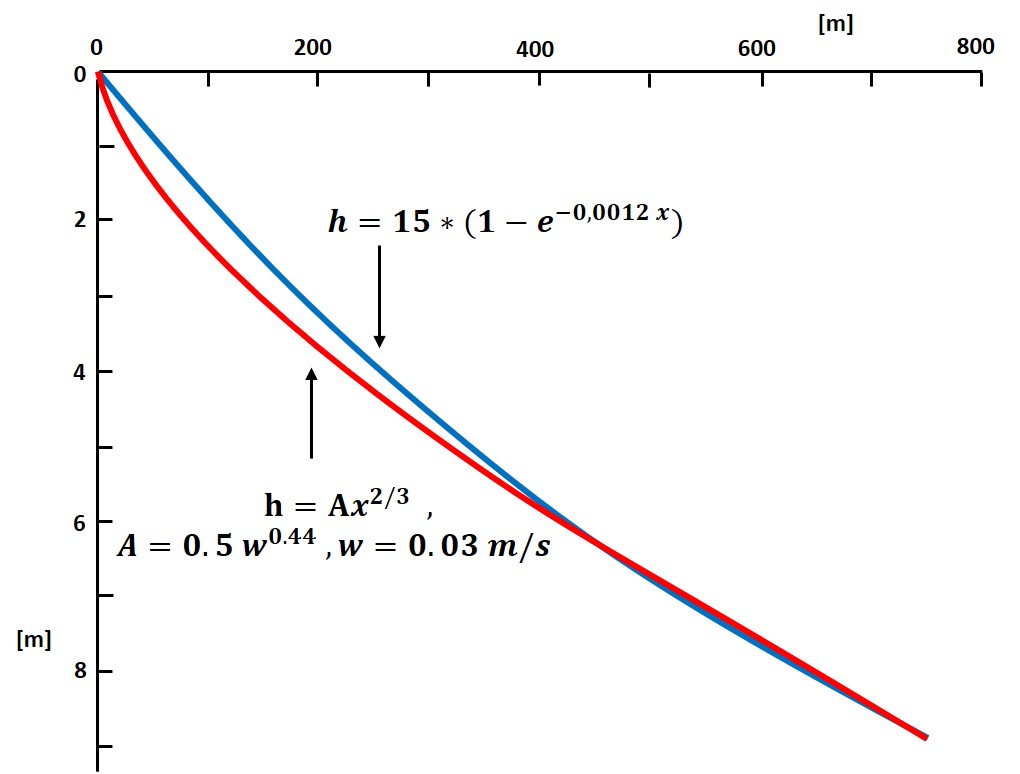
| 16:28, 18 September 2018 | DeanAndBodgeProfiles.jpg (file) |  |
62 KB | The Bruun/Dean shoreface profile and the equivalent Bodge profile. | 1 |
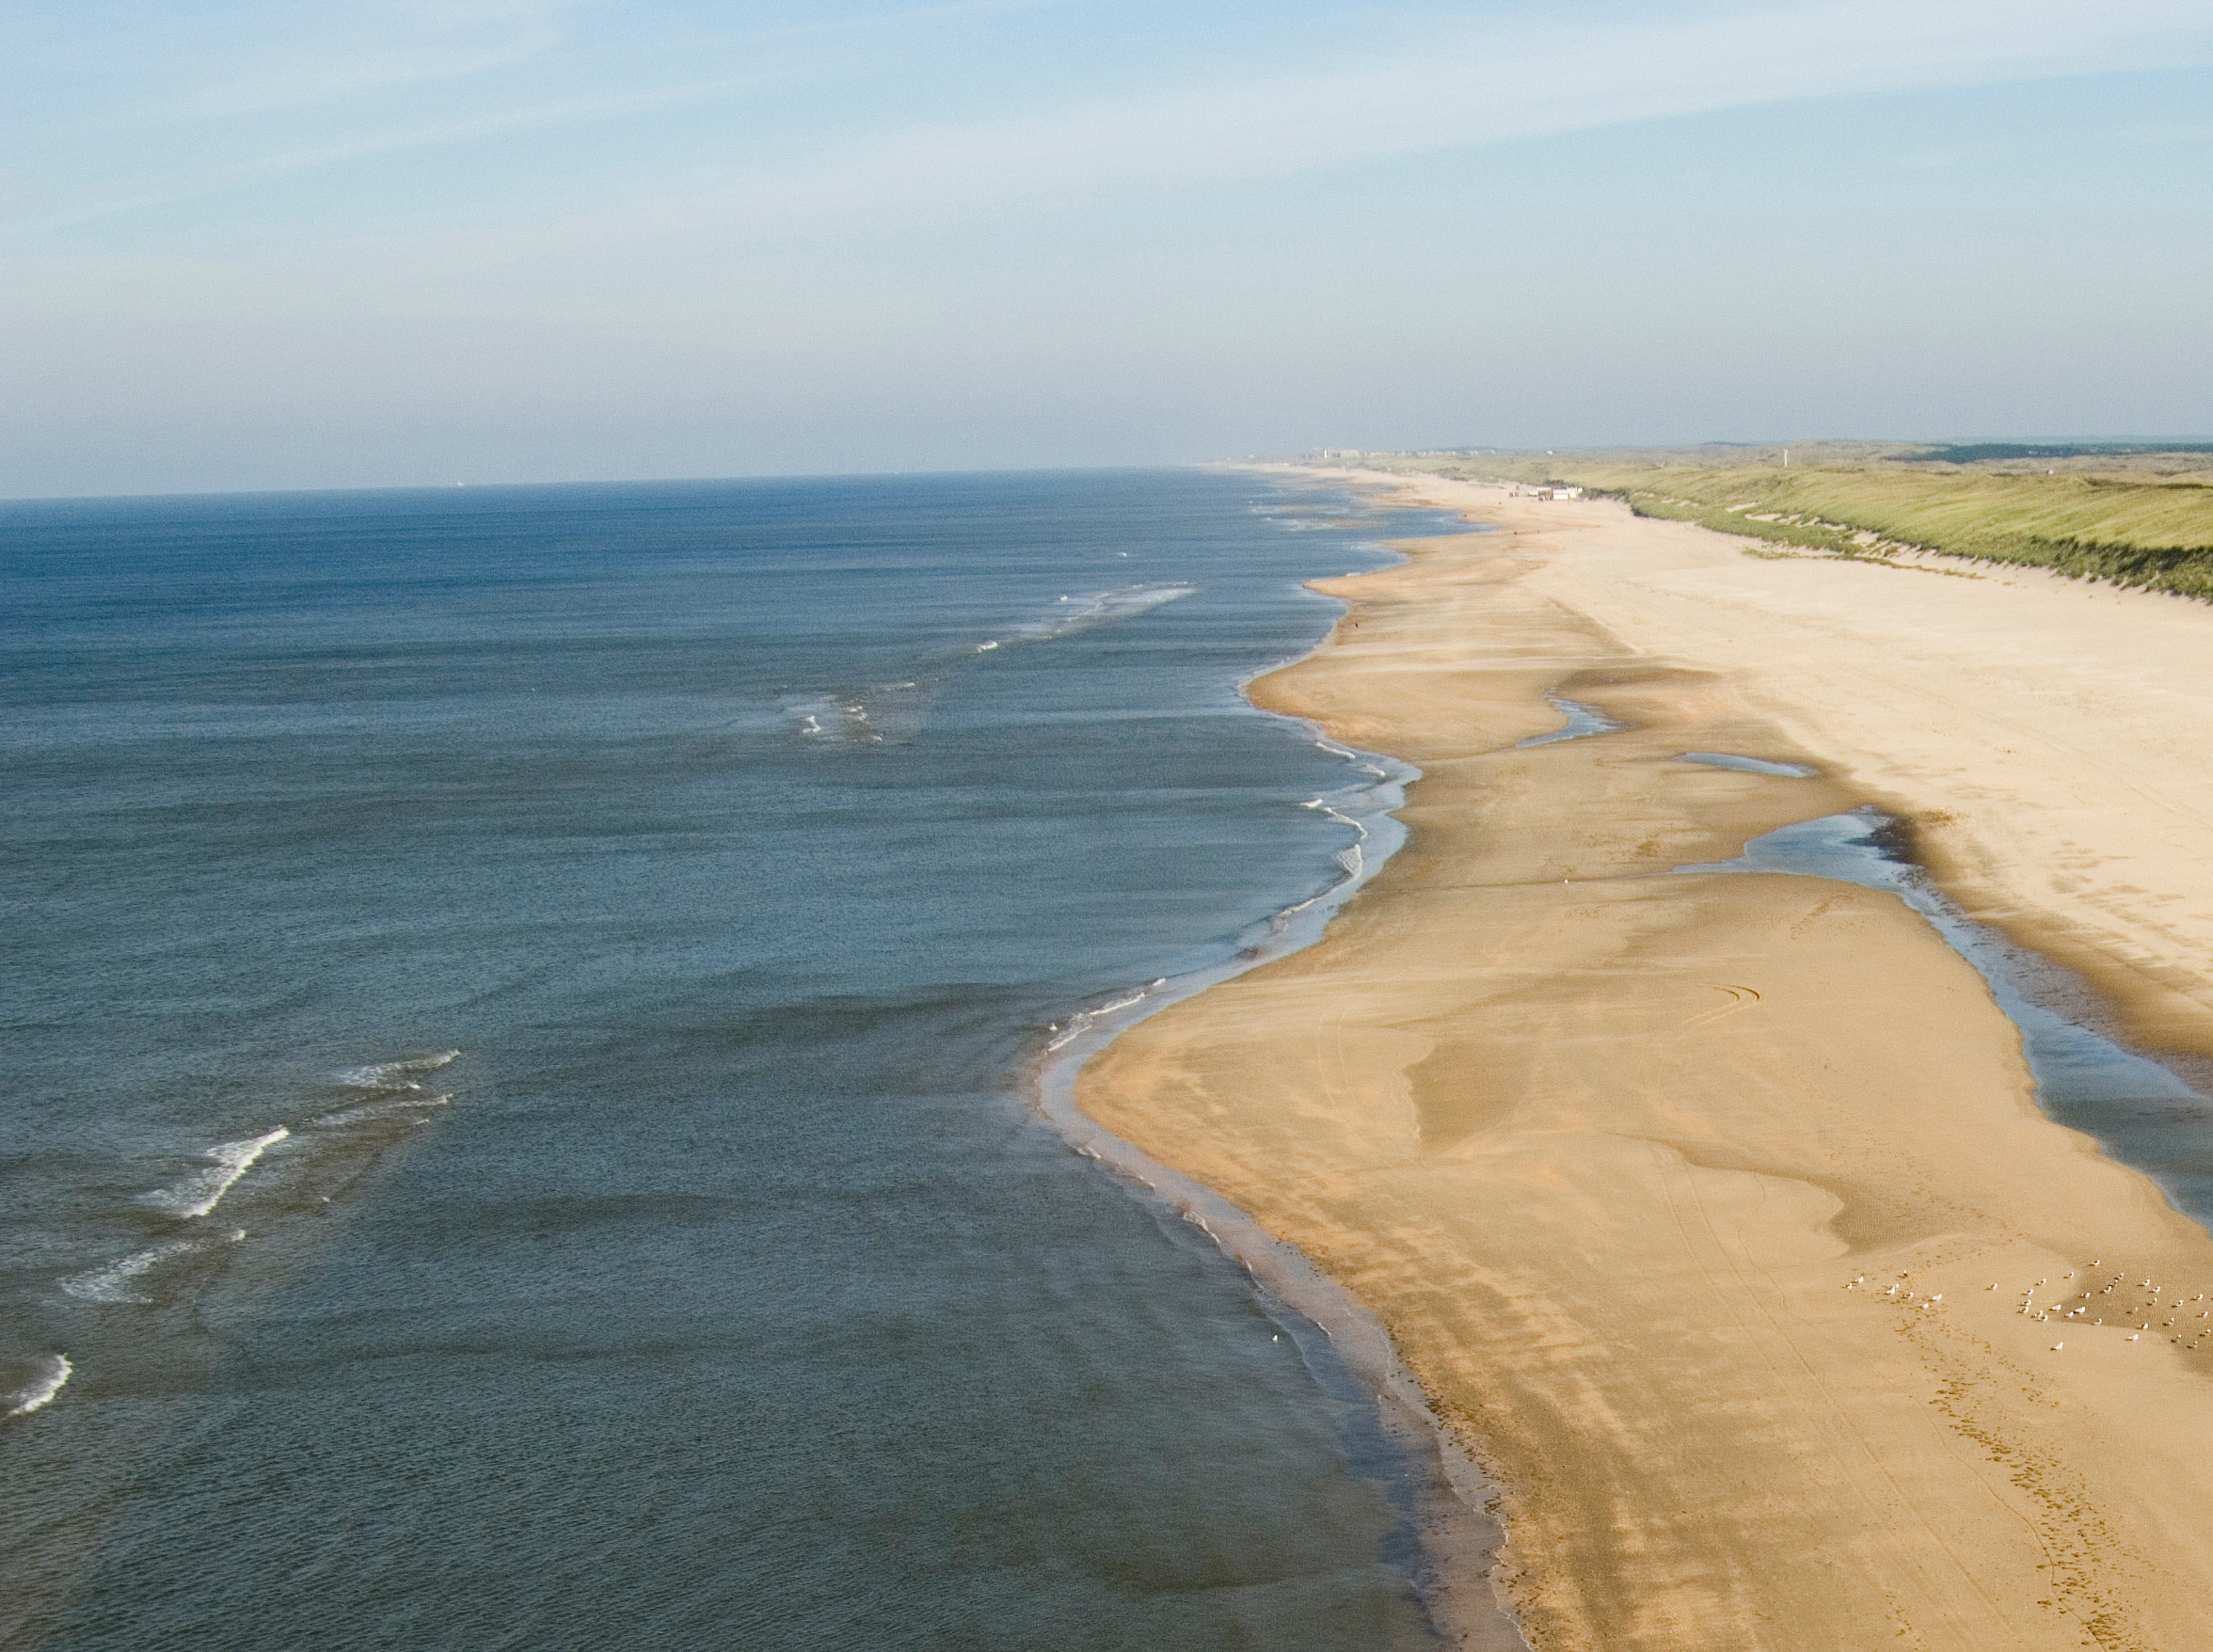
| 13:55, 18 September 2018 | DutchCoastNorthHolland.jpg (file) |  |
1.02 MB | The barred coast of North Holland, The Netherlands. https://beeldbank.rws.nl, Rijkswaterstaat / Rens Jacobs | 1 |
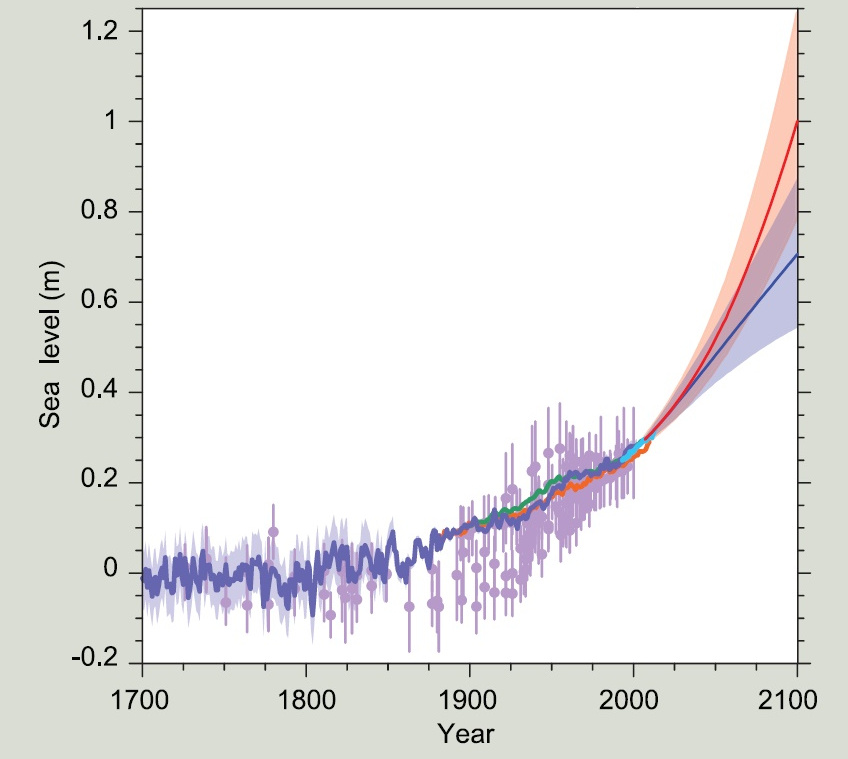
| 17:42, 14 September 2018 | SeaLevelRise IPCC AR5.jpg (file) |  |
87 KB | Compilation of sea level data derived from observations up till 2010 and model projections up till 2100, relative to pre-industrial values. From IPCC 5th Assessment report Technical Summary WG1. | 1 |
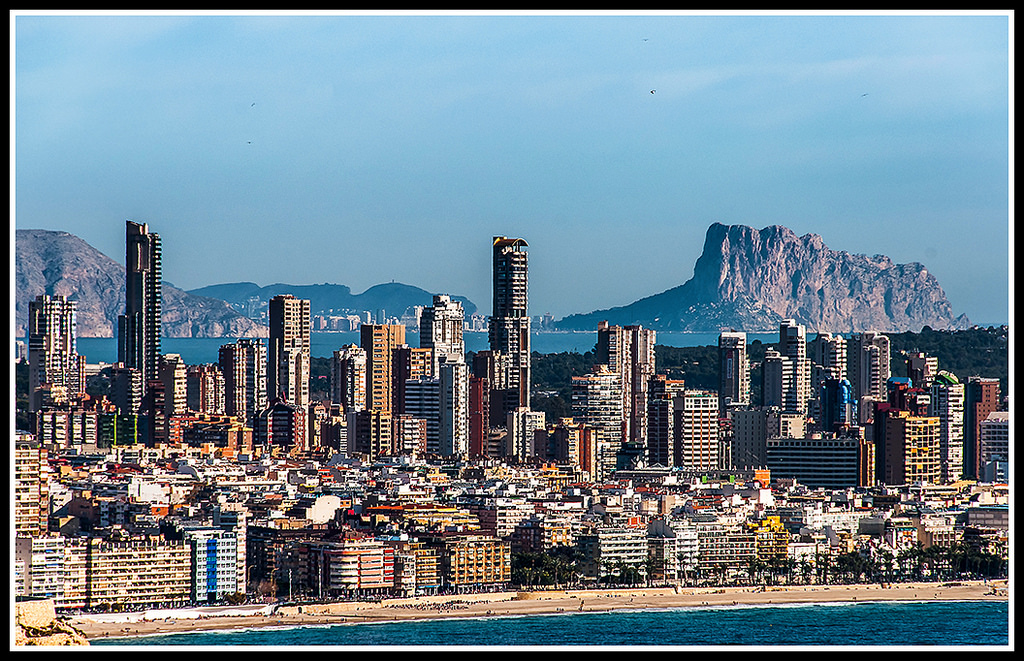
| 15:15, 21 June 2018 | Benidorm EnriqueDomingo jpg.jpg (file) |  |
499 KB | Tourist resort Benidorm on the Spanish Mediterranean coast. Photo credit Enrique Domingo [https://www.flickr.com/photos/edomingo/] | 1 |
| 15:14, 21 June 2018 | AmericanJackknifeClam jpmm.jpg (file) |  |
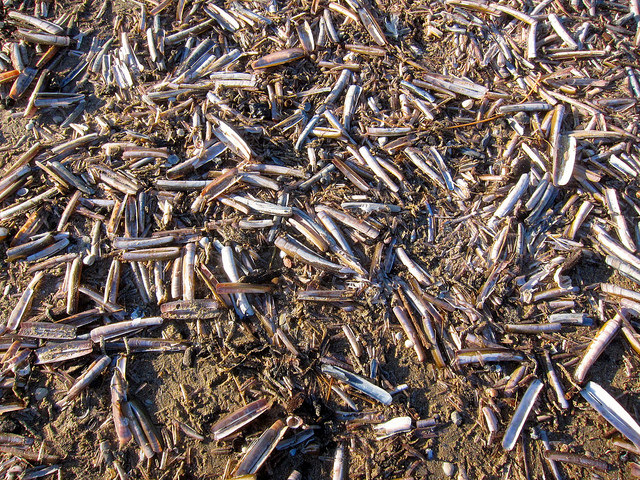
243 KB | The American jackknife clam ''Ensis Directus'' has colonized the beaches of NW Europe. Photo credit jpmm, [https://www.flickr.com/photos/jpmm/] | 1 |
| 15:13, 21 June 2018 | LookingDownTheNileFromTheAswanDam JorgeLascar.jpg (file) |  |
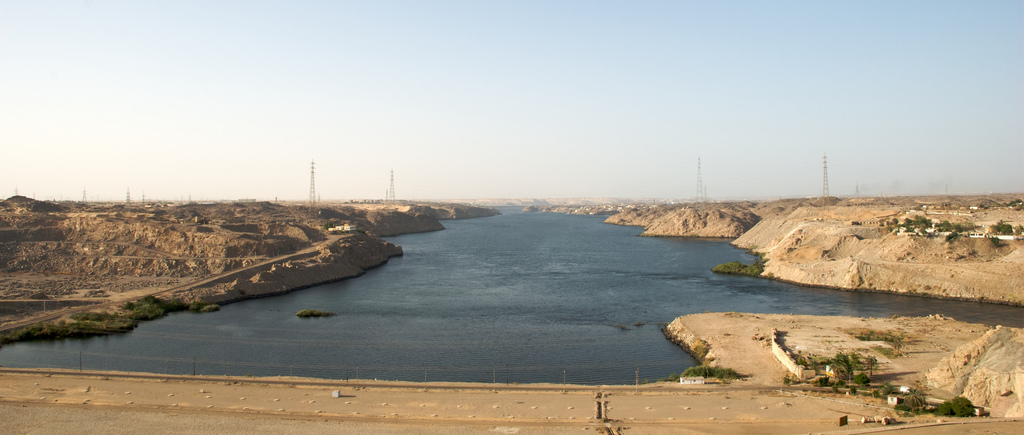
196 KB | Looking down the Nile from the Aswan Dam. Photo credit Jorge Lascar | 1 |
| 15:12, 21 June 2018 | DredgingMaasvlakte2.jpg (file) |  |
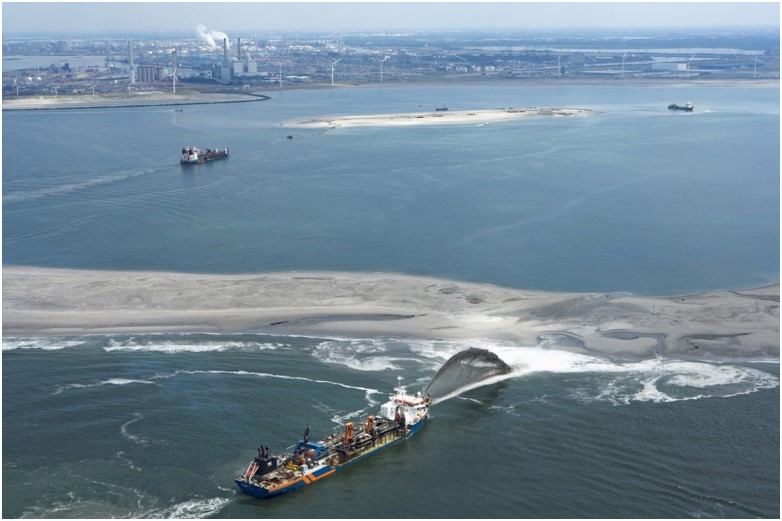
84 KB | Dredging for the construction of Rotterdam port extension Maasvlakte 2. Photo credit Port of Rotterdam. | 1 |
| 15:11, 21 June 2018 | LeHavrePort2000.jpg (file) |  |
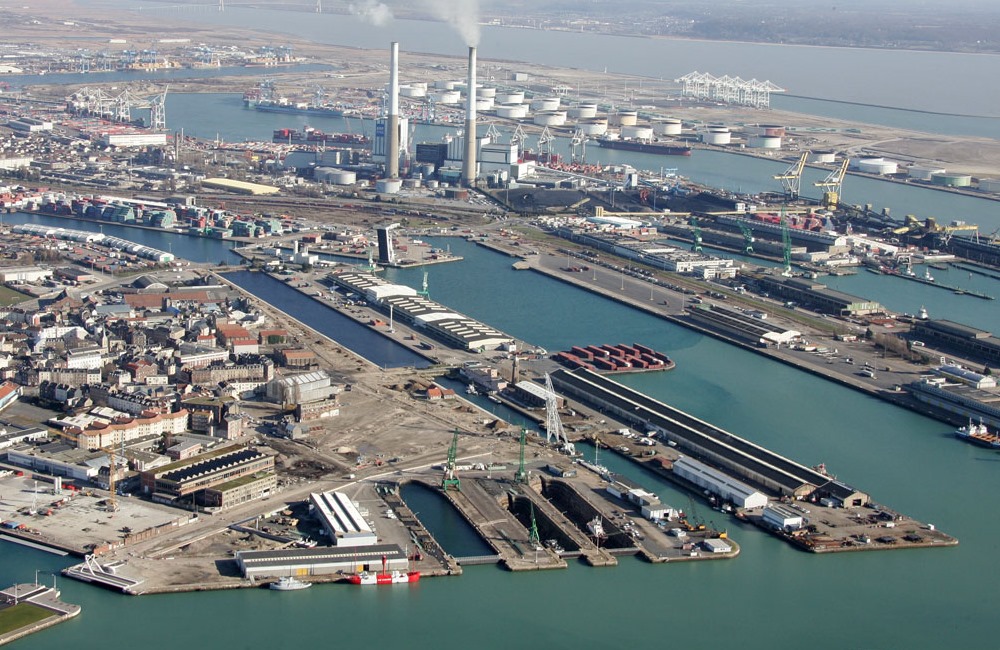
252 KB | The port of Le Havre at the mouth of the Seine River is surrounded by a nature reserve zone. Photo credit Port of Le Havre. | 1 |
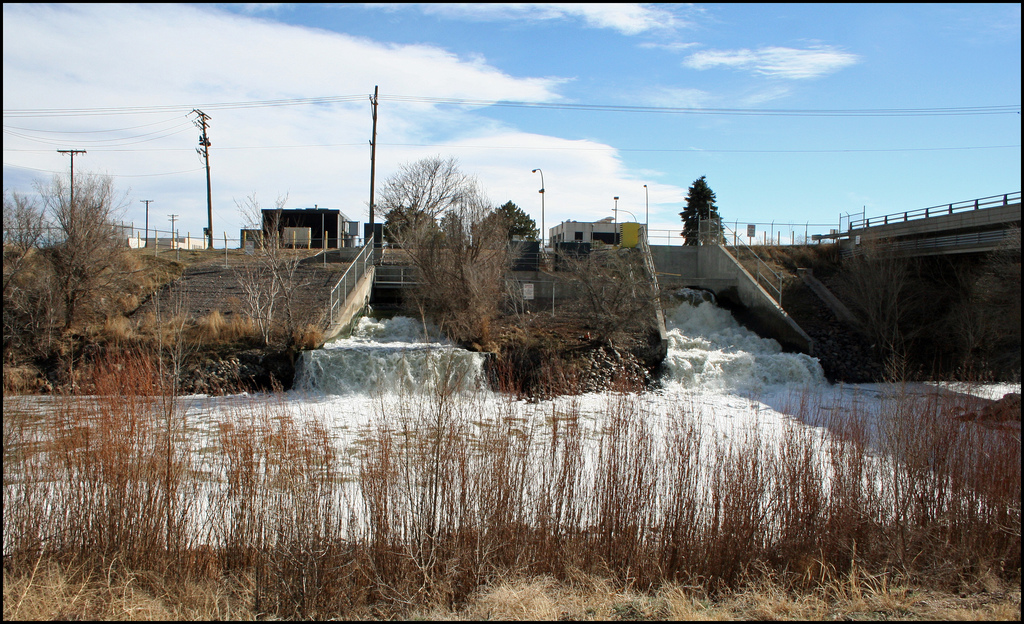
| 22:28, 10 June 2018 | SewageEffluentDenver.jpg (file) |  |
485 KB | Sewage effluent Denver in Platte River. Photo credit Jeffrey Beall (2008) | 1 |
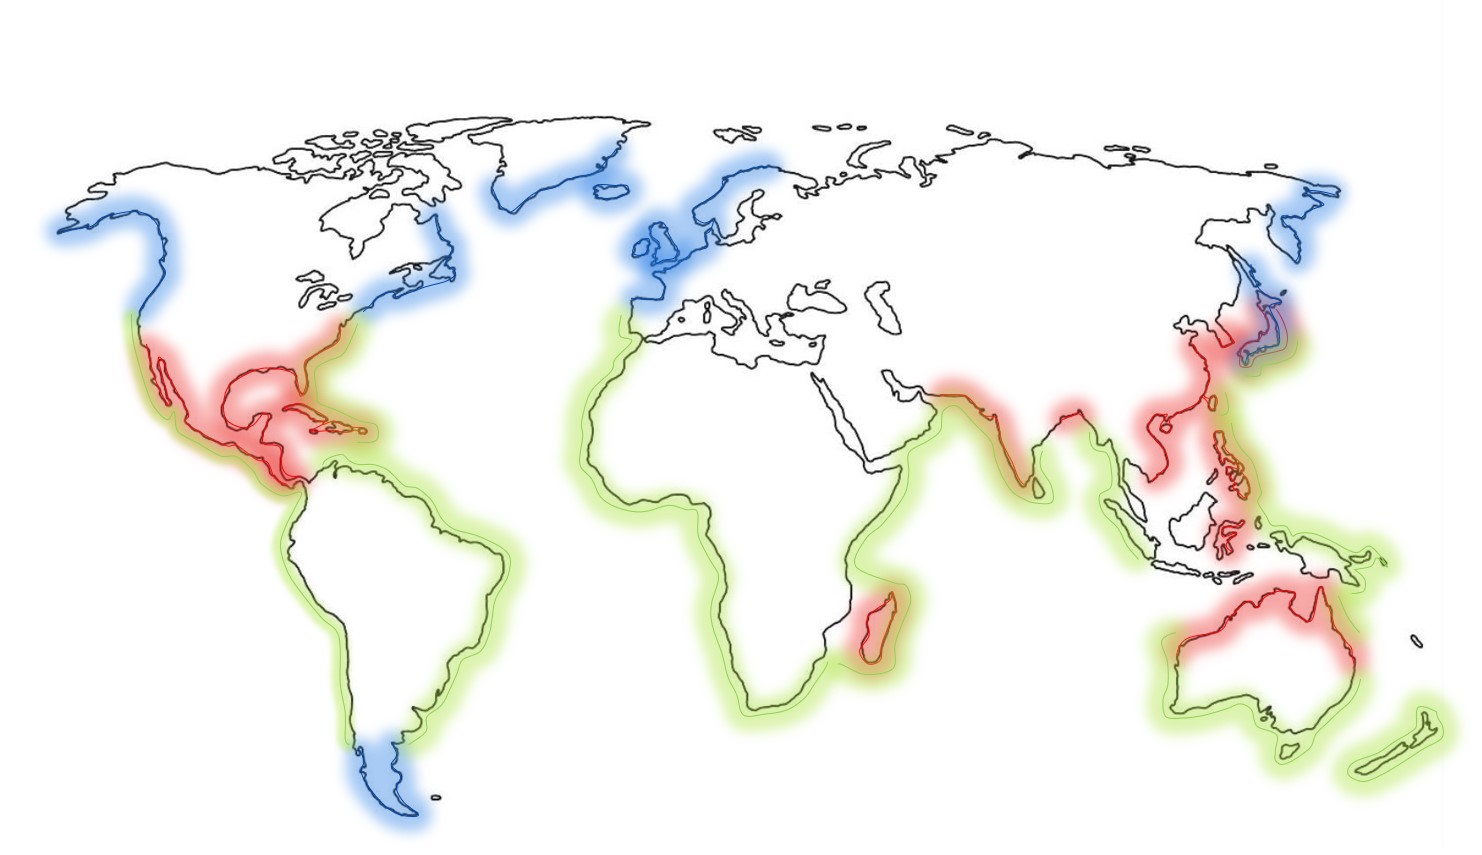
| 12:32, 8 June 2018 | CoastStormsWaves.jpg (file) |  |
129 KB | Global distribution of storm and wave climate. Blue: Coasts subjected to storm waves. Red: Coasts subjected to tropical storms. Green: Coasts subjected to ocean swell waves. Adapted from Davies (1973) | 2 |
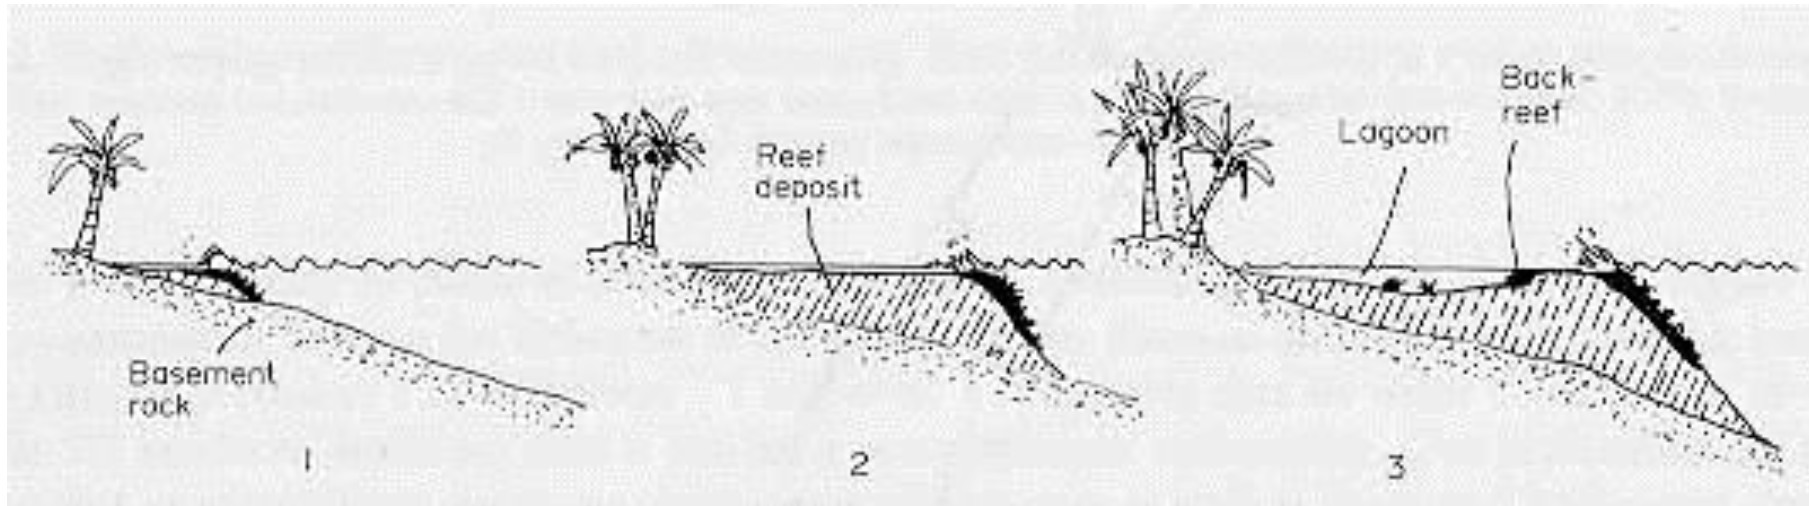
| 16:39, 7 June 2018 | FringingReefDevelopment.jpg (file) |  |
140 KB | Typical evolution stages of a fringing reef. Adapted from Mergner and Schuhmacher (1974) | 1 |
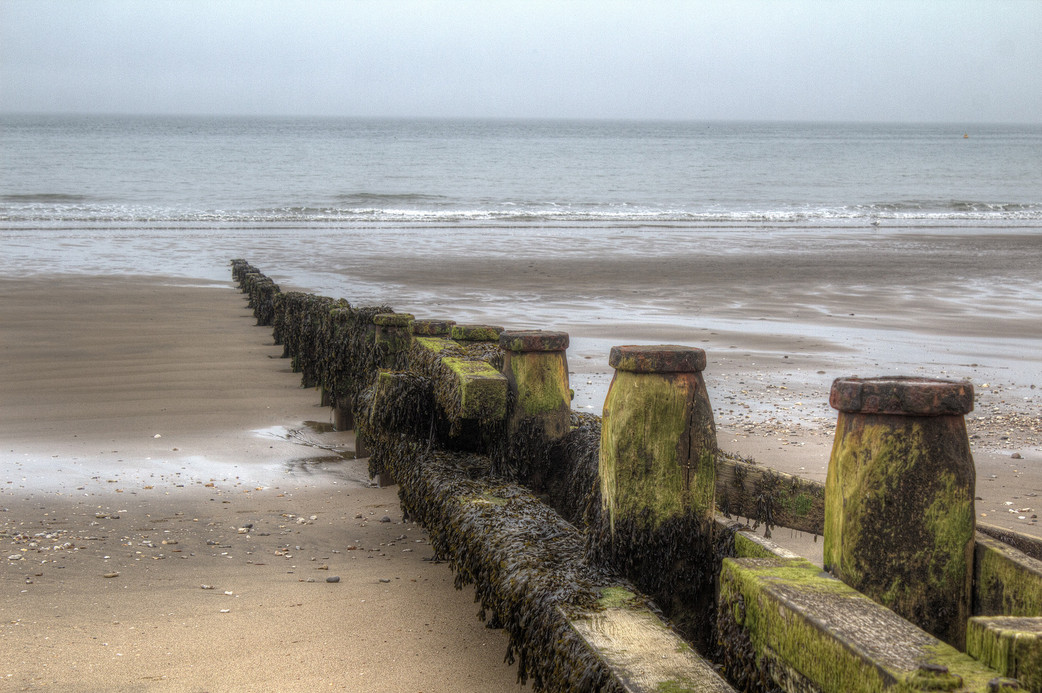
| 20:43, 21 May 2018 | Groyne.jpg (file) |  |
230 KB | Typical impact of a groyne on a littoral drift beach: accretion at the updrift side and erosion at the downdrift side. Photo credit: Dan Scutter. | 1 |
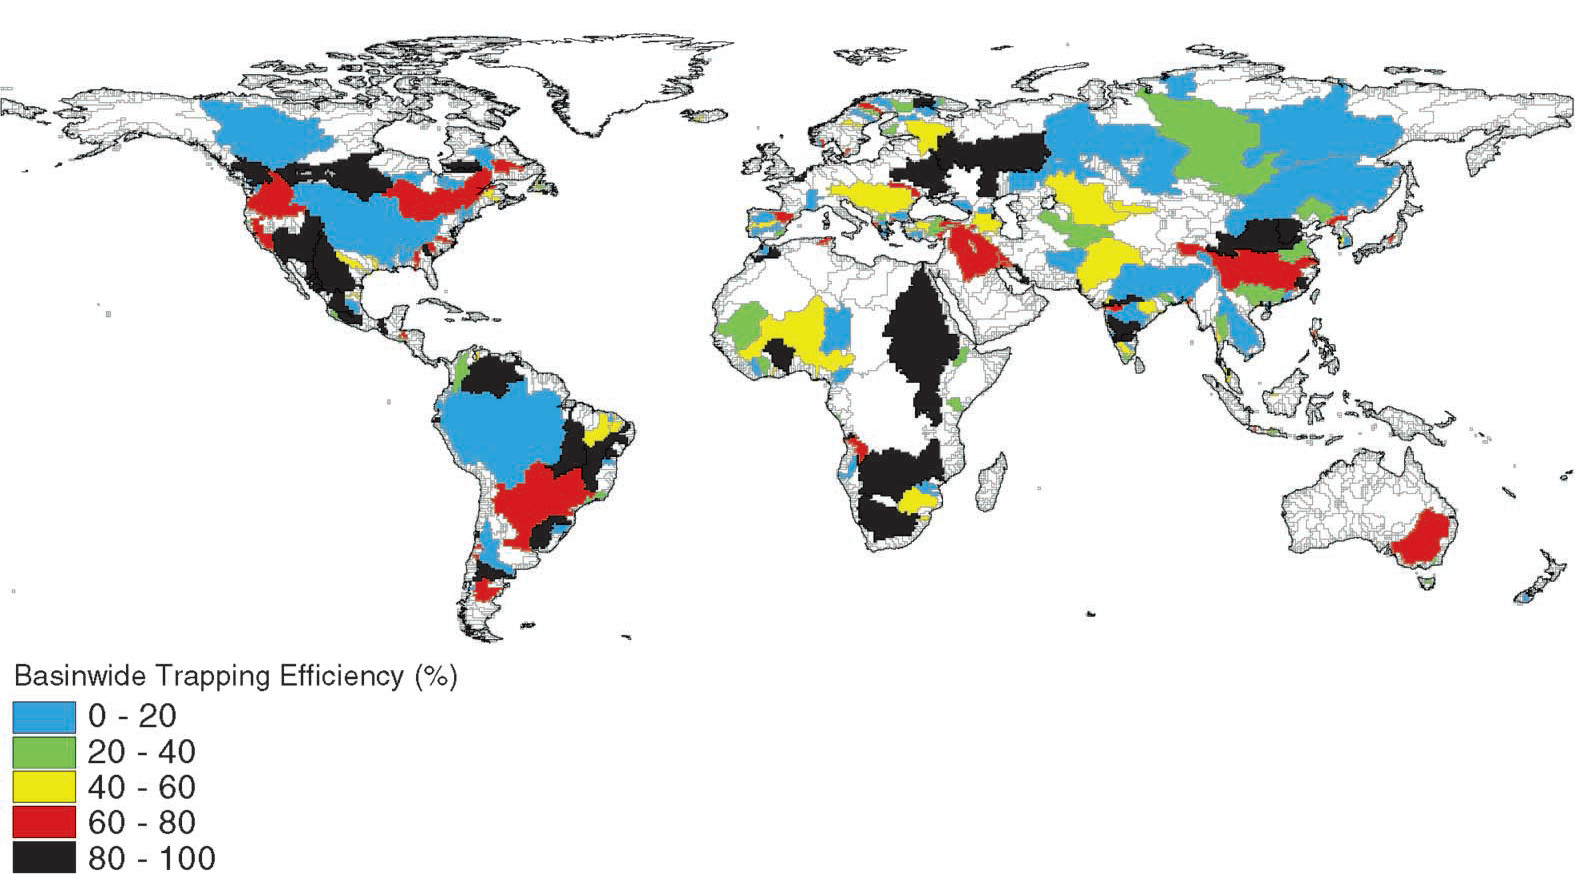
| 19:53, 21 May 2018 | SedimentRetentionRiverDams.jpg (file) |  |
224 KB | Catchment basins with percentage of sediment discharge retained in artificial reservoirs, image from Vorosmarty et al (2003). | 1 |
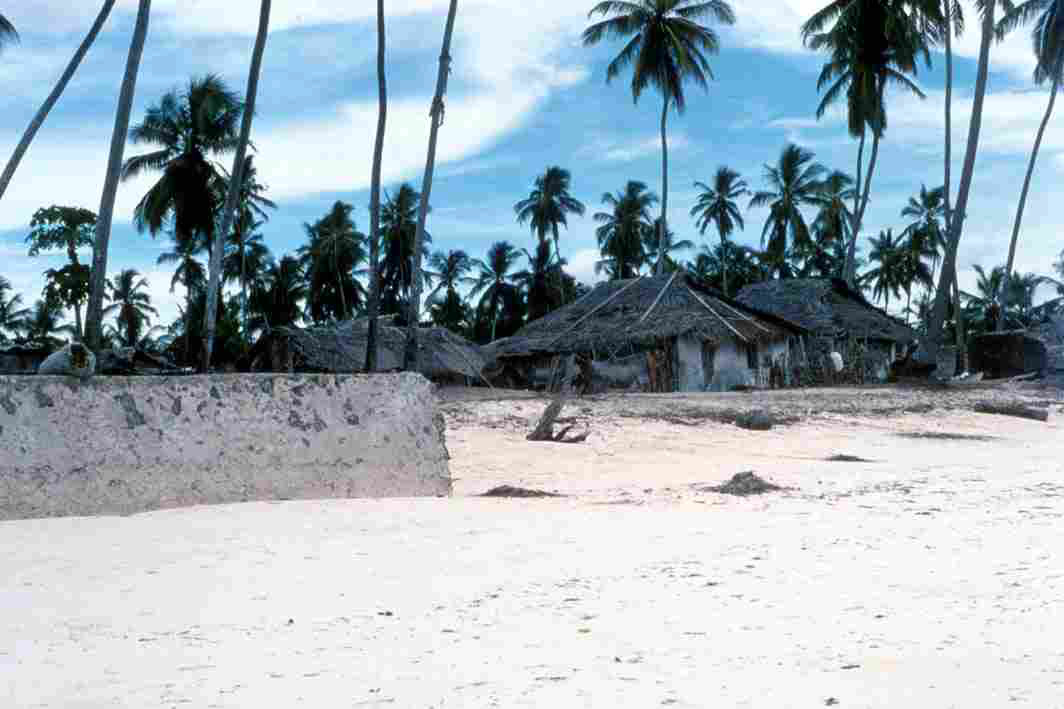
| 12:59, 21 May 2018 | SeawallDowndriftErosionZanzibar.jpg (file) |  |
81 KB | Beach erosion downdrift of a seawall at Zanzibar. | 1 |
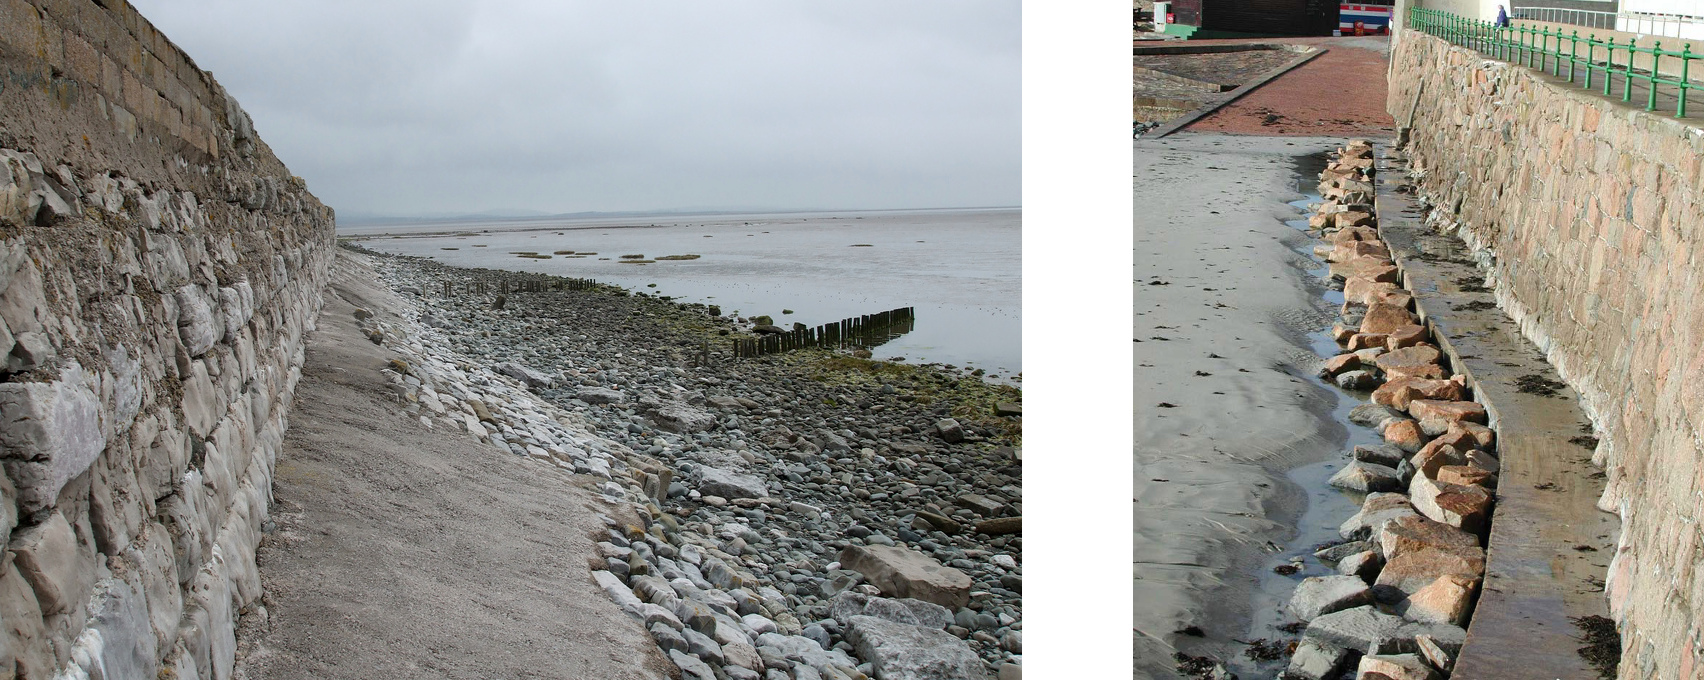
| 12:59, 21 May 2018 | SeawallToe.jpg (file) |  |
657 KB | Left: Low eroded beach at the Bardsea seawall, situated on the macrotidal Morecambe Bay (UK); Photo credit: Stephen Mackenzie. Right: Rock infill of a trench scoured at the toe of a seawall at Le Dicq (Island of Jersey): Photo credit: HR Wallingford. | 1 |
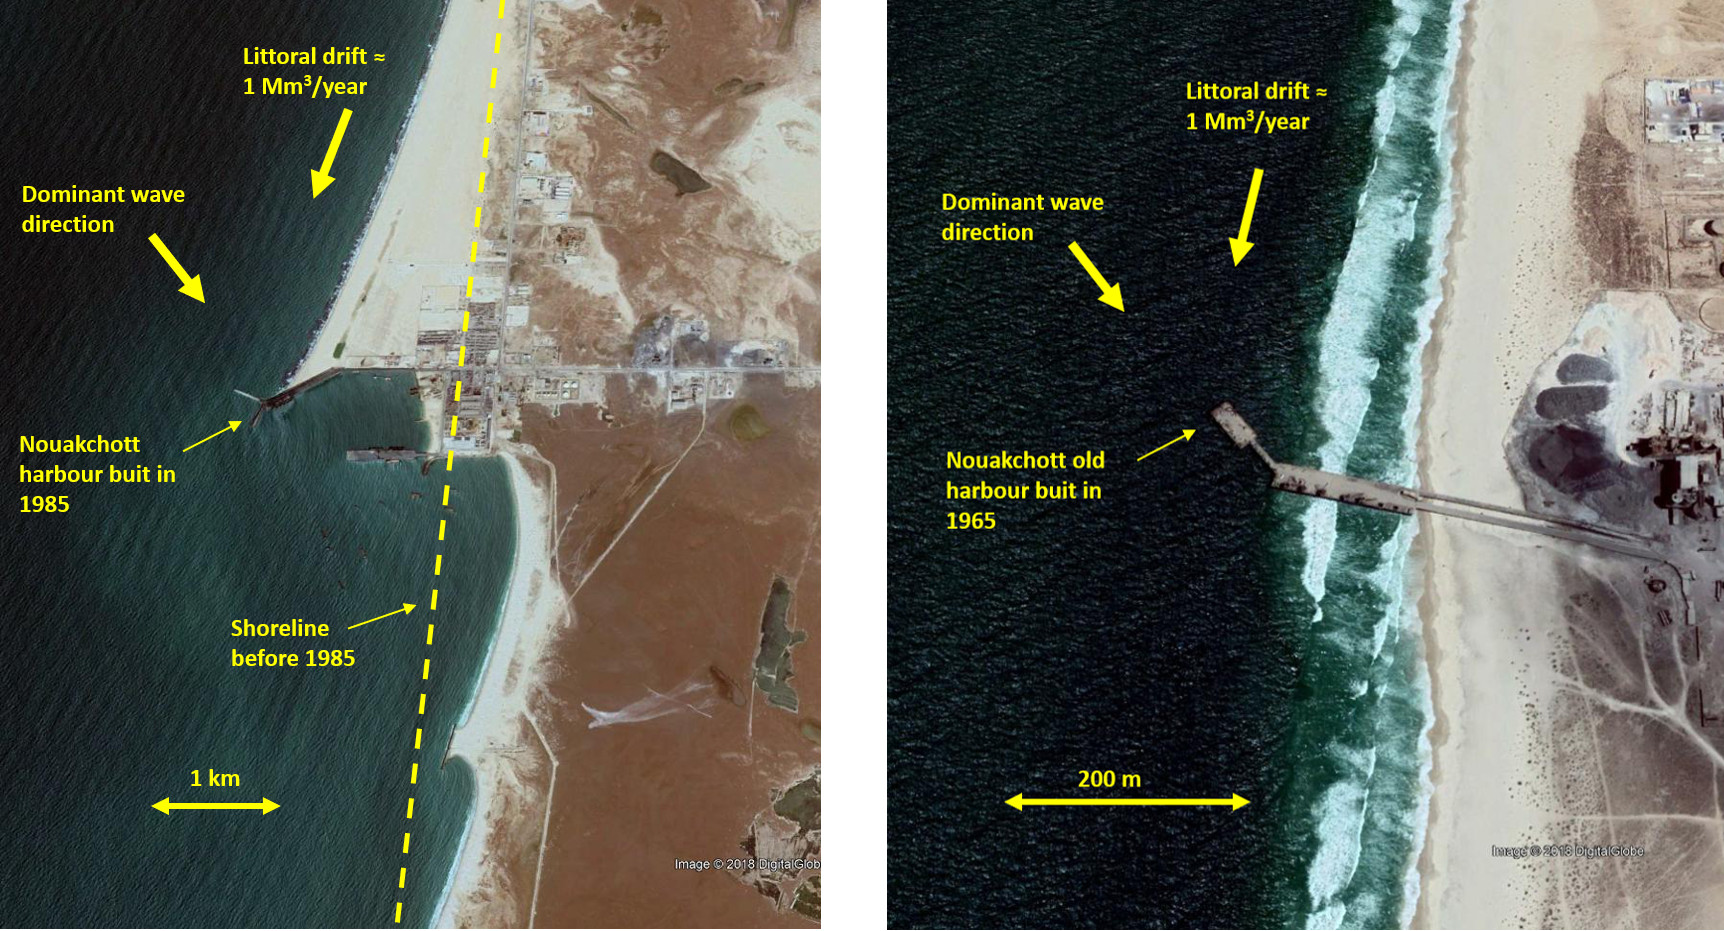
| 12:57, 21 May 2018 | NouakchottPorts.jpg (file) |  |
495 KB | Left: The new seaport of Nouakchott (Mauritania) built in 1985 (image October 2017). Right: The (smaller) old port of Nouakchott, built in 1965, situated ten kilometers north of the new port (image April 2018). | 1 |
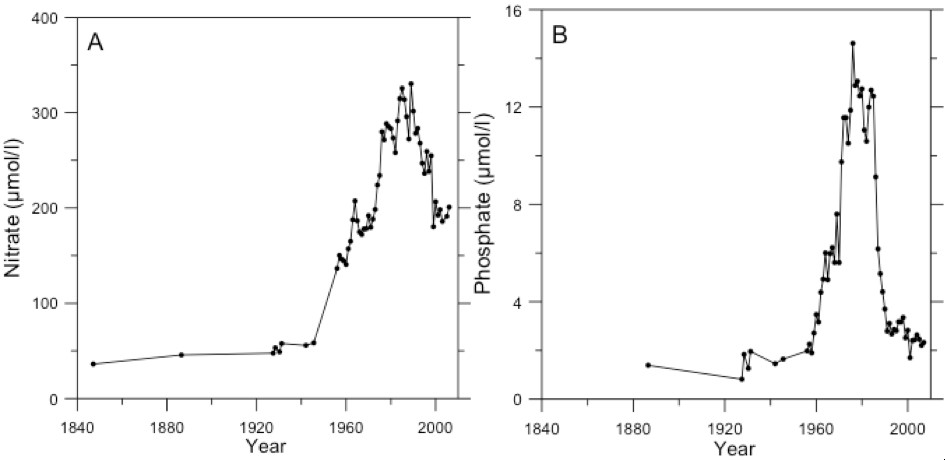
| 15:48, 28 April 2018 | RhineConcNitratePhosphate.jpg (file) |  |
41 KB | Historic development of nitrate (a) and phosphate (b) concentrations in the Rhine. | 1 |
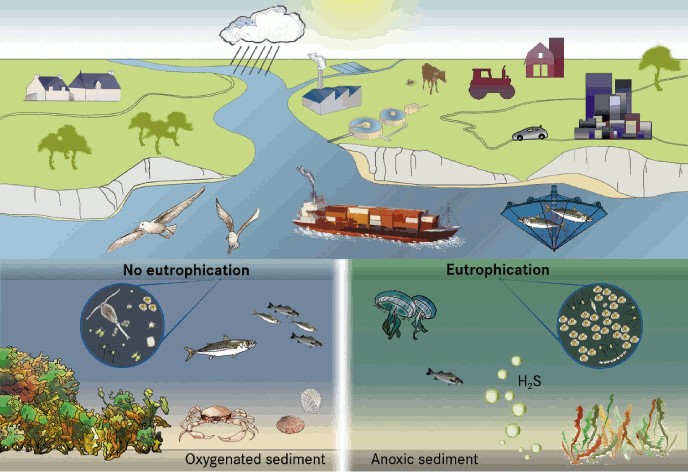
| 15:47, 28 April 2018 | Eutrophication Input Effect OSPAR2010.jpg (file) |  |
84 KB | Sources of nutrient input to the marine environment and simplified schemes showing eutrophication effects arising from nutrient enrichment. OSPAR 2010. | 1 |
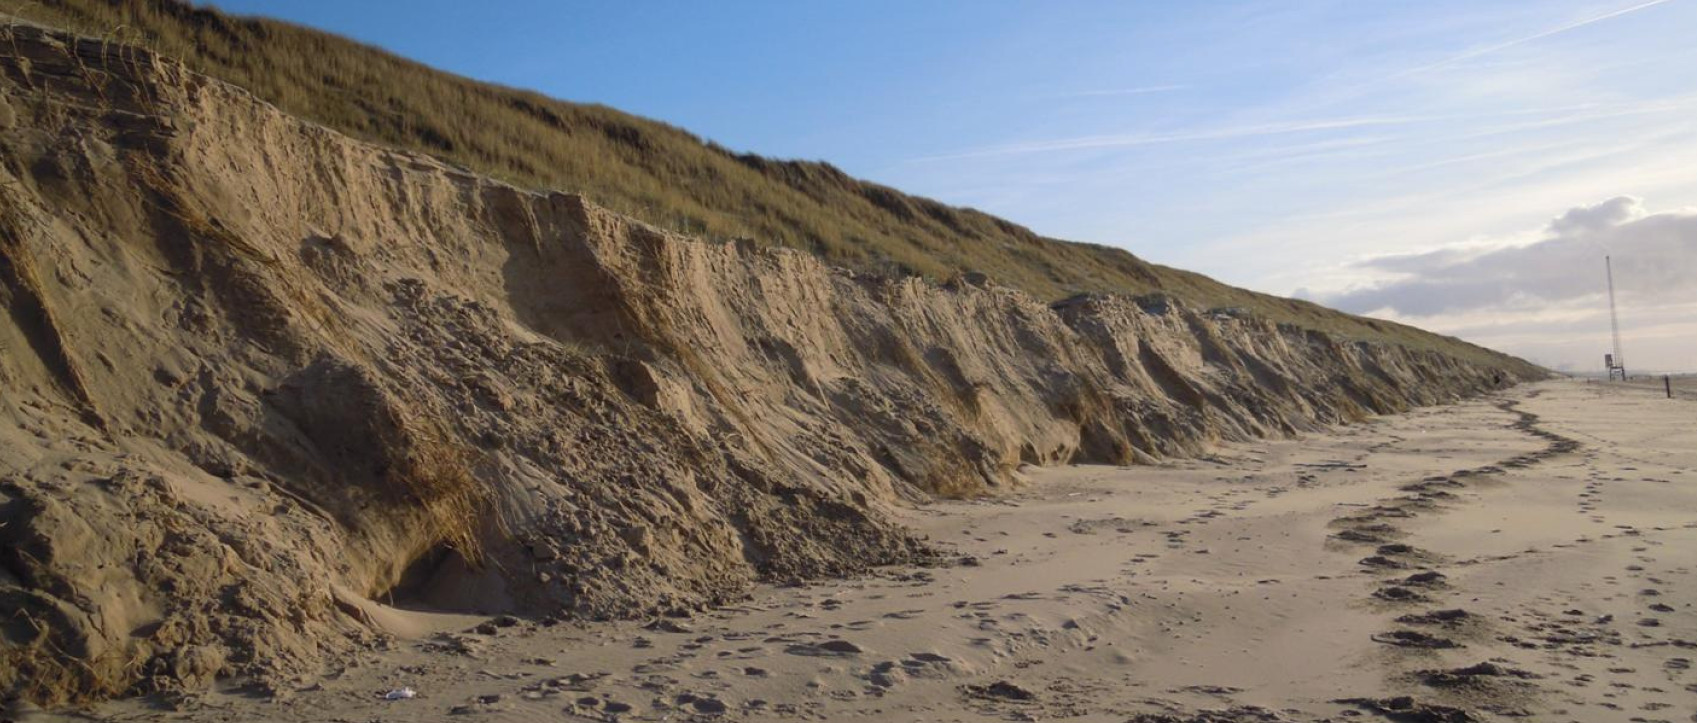
| 12:23, 27 April 2018 | DuneErosionEgmond.jpg (file) |  |
167 KB | Dune scarp after collapse. | 1 |
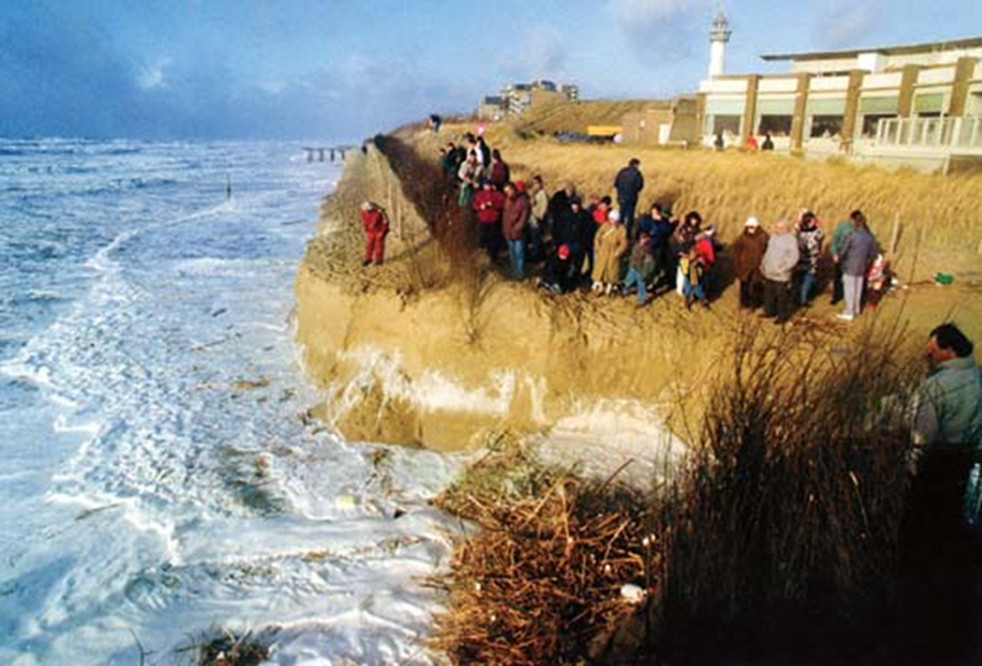
| 12:21, 27 April 2018 | DuneScarpEgmond.jpg (file) |  |
308 KB | Dune scarp at Egmond aan Zee after a storm surge. | 1 |
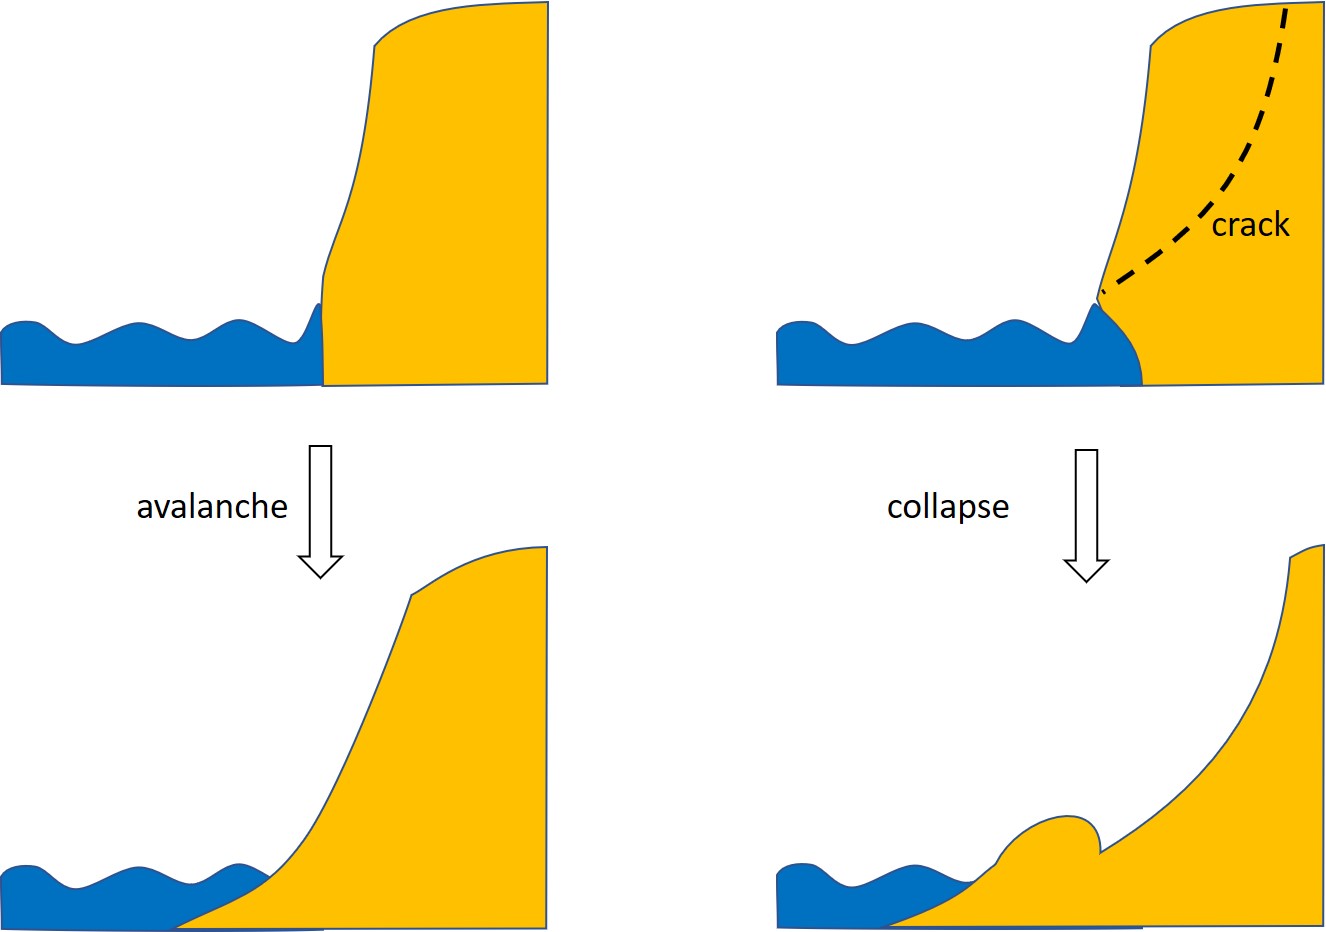
| 12:18, 27 April 2018 | DuneFailureMechanisms.jpg (file) |  |
72 KB | Dune failure mechanisms. | 1 |
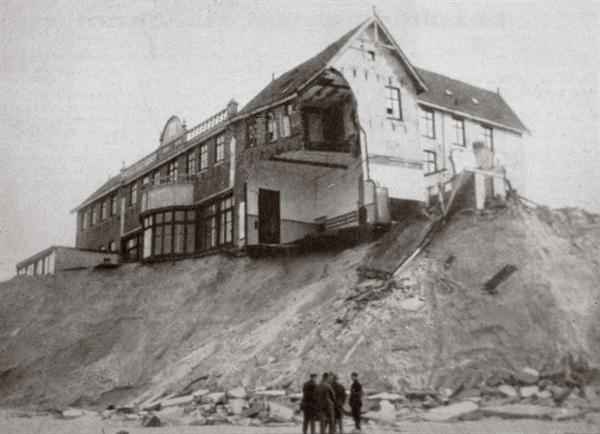
| 12:17, 27 April 2018 | BadhotelSchiermonnikoog 1924.jpg (file) |  |
19 KB | Badhotel at Schiermonnikoog after the 1924 storm. | 1 |
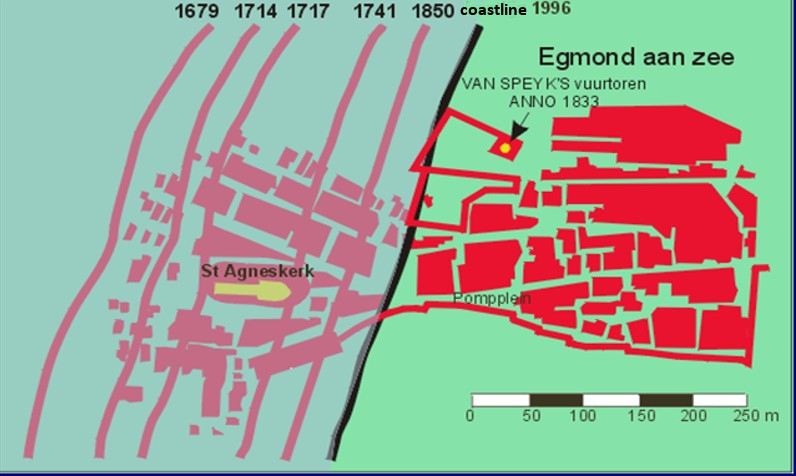
| 23:13, 24 April 2018 | EgmondCoastalRetreat.jpg (file) |  |
88 KB | Shoreline retreat Egmond aan Zee Dutch coast 17th-19th century. | 1 |
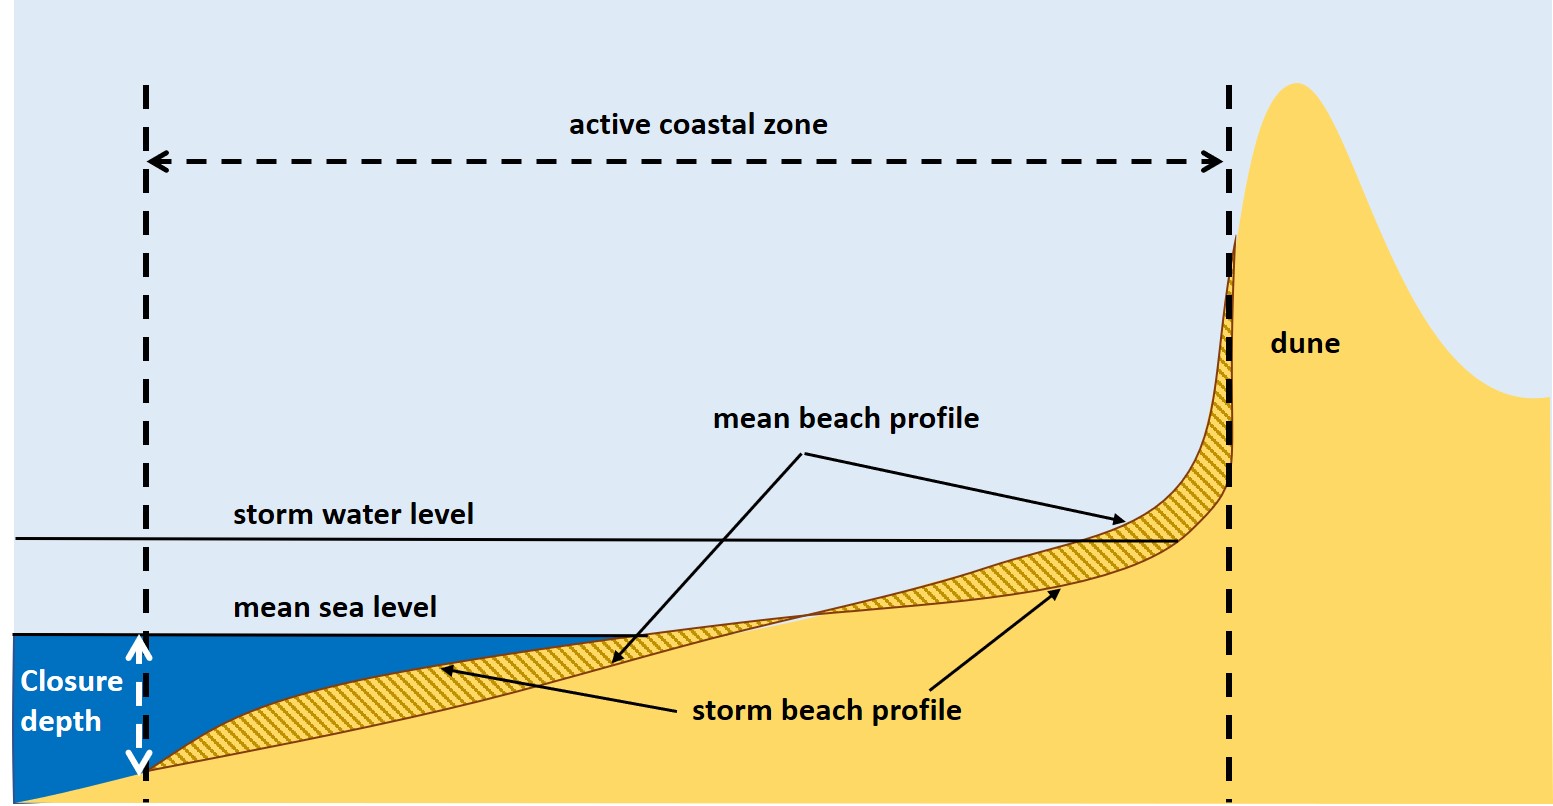
| 15:30, 24 April 2018 | ActiveCoastalZone.jpg (file) |  |
112 KB | Schematic representation of the active coastal zone for a dune coast. | 1 |
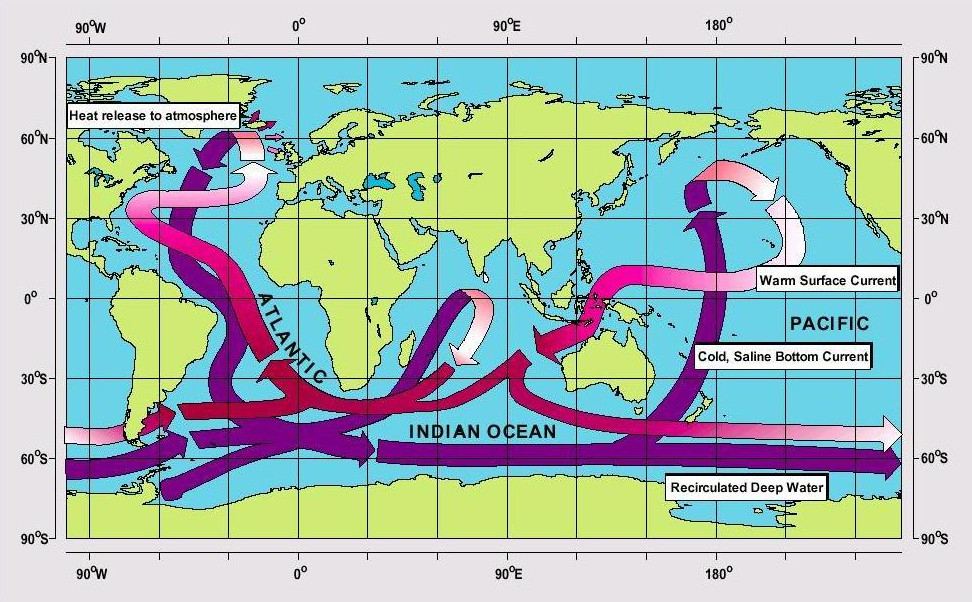
| 15:31, 21 April 2018 | ConveyorBelt Broecker Maier-Reimer.jpg (file) |  |
224 KB | Simplified scheme of the global thermohaline circulation, adapted from Broecker (1991) <ref. Broecker, W.S. 1991. The Great Ocean conveyor. Oceanography 4 (2), 79–89.</ref> | 2 |
| 11:59, 21 April 2018 | AMOC.jpg (file) |  |
23 KB | Schematic representation of the Atlantic Meridional Overturning Current. | 1 |
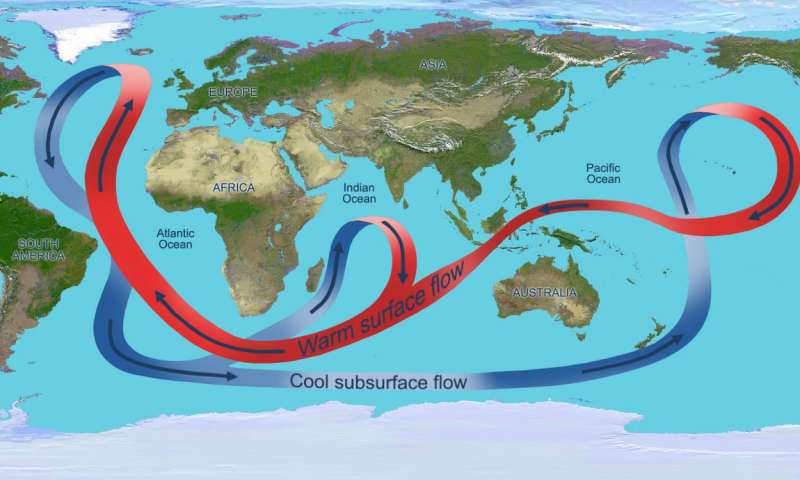
| 11:56, 21 April 2018 | ConveyorBelt NASA.jpg (file) |  |
39 KB | Simplified picture of the conveyor belt. Credit: NASA. | 1 |
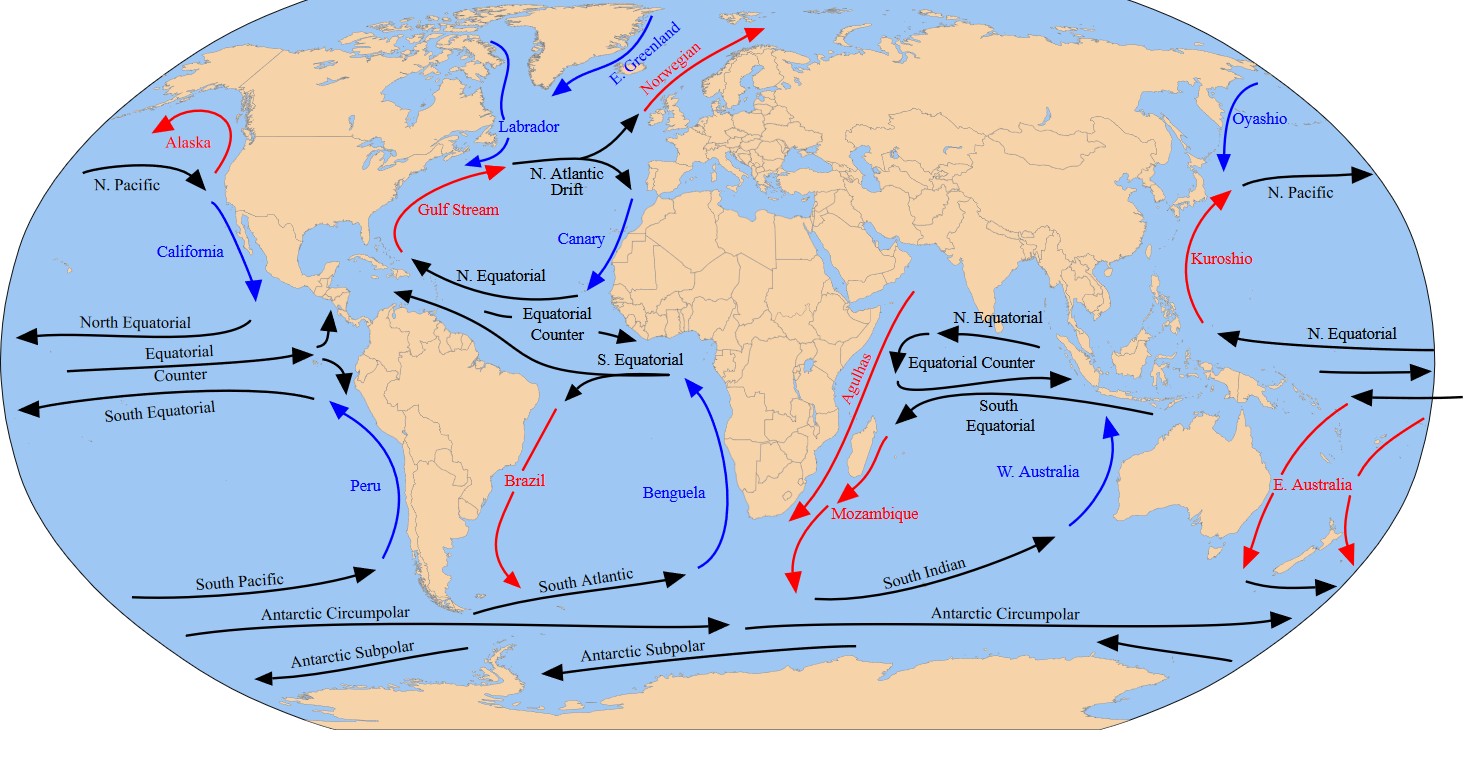
| 21:19, 20 April 2018 | Ocean-Currents gkplanet.jpg (file) |  |
203 KB | Ocean surface currents <ref>http://www.gkplanet.in/2017/05/oceanic-currents-of-world-pdf.html</ref> | 1 |
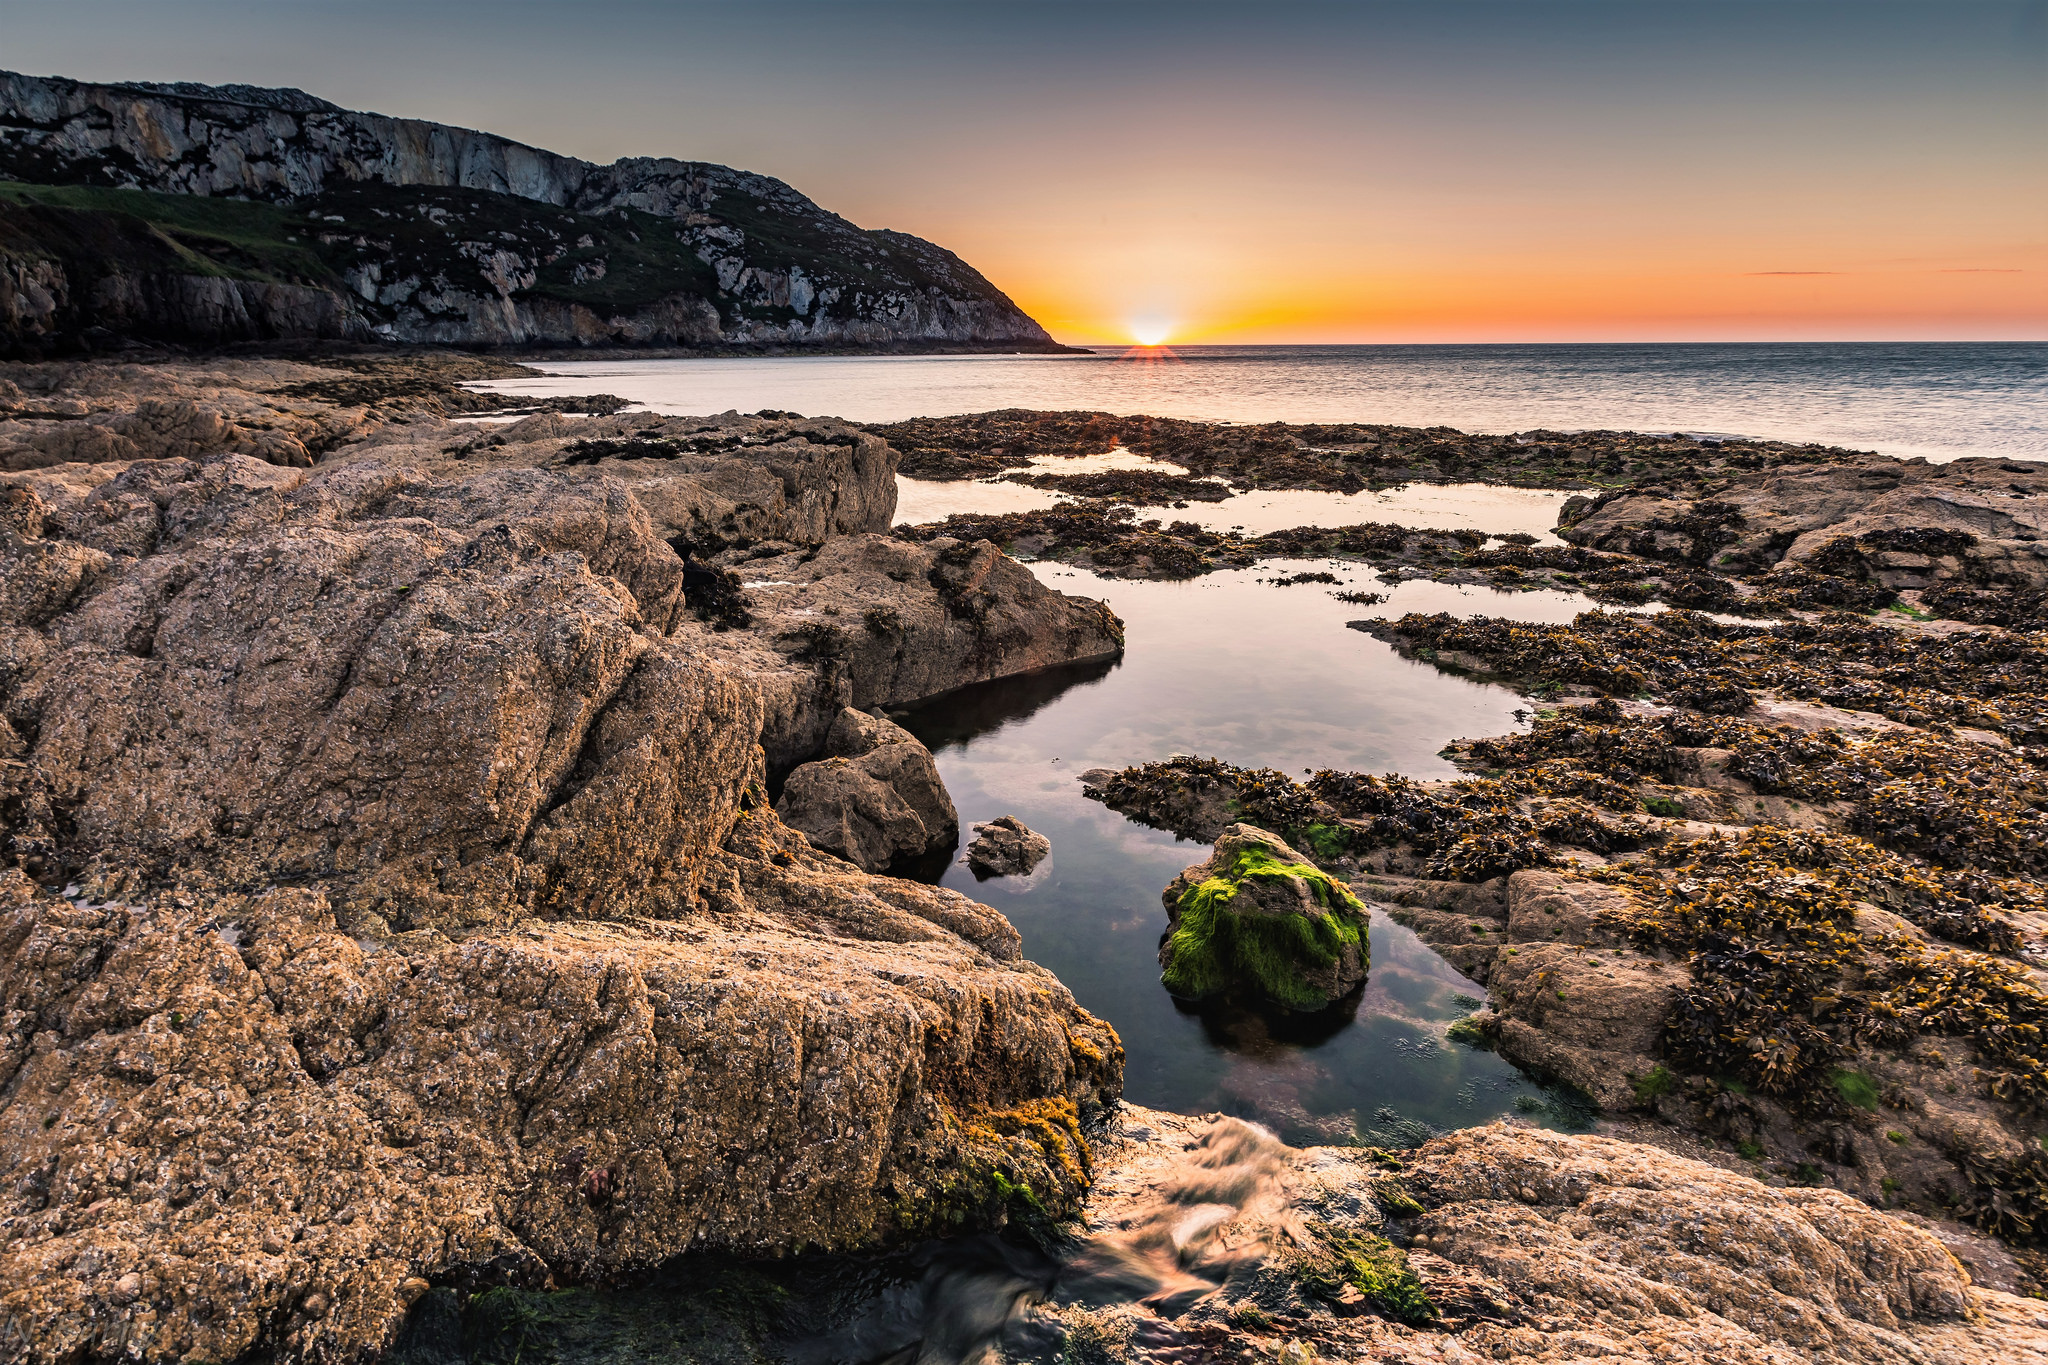
| 20:55, 16 April 2018 | RockyShorePlatform Holyhead-Wales UK Nigel Barry.jpg (file) |  |
1.38 MB | Rocky shore platform, Holyhead, Wales (UK). Photo credit: Nigel Barry. | 1 |
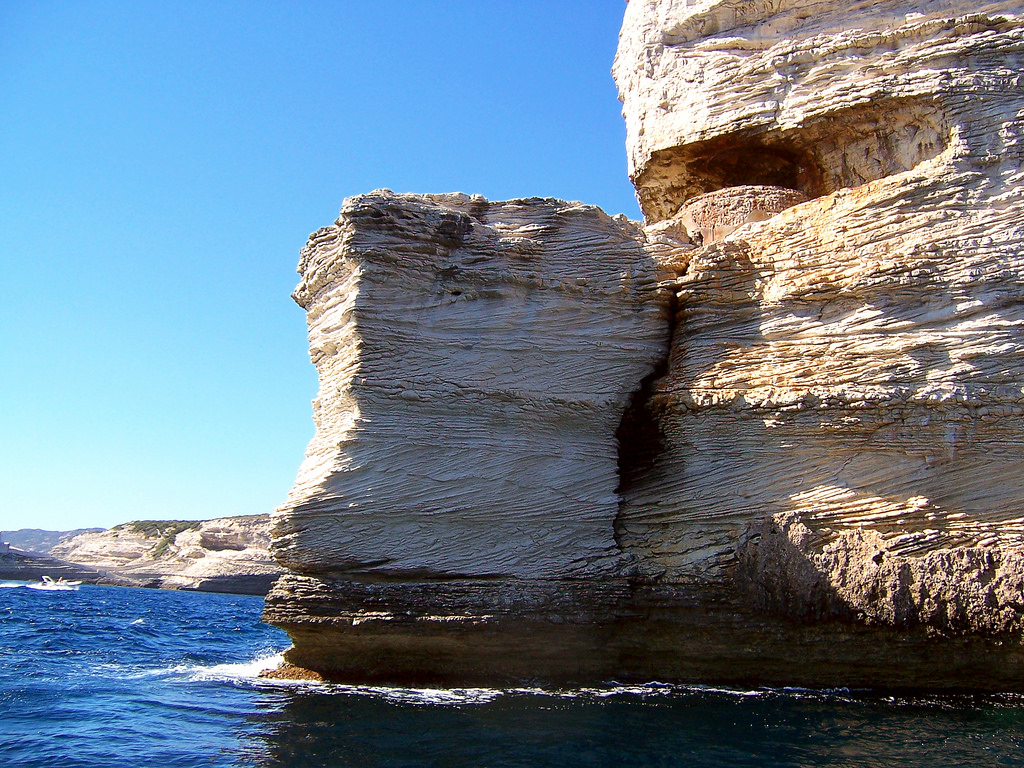
| 20:54, 16 April 2018 | CliffErosion Bonifacio Corsica Andrea Papi.jpg (file) |  |
442 KB | Cliff erosion at Bonifacio, Corsica. Photo credit: Andrea Papi. | 1 |
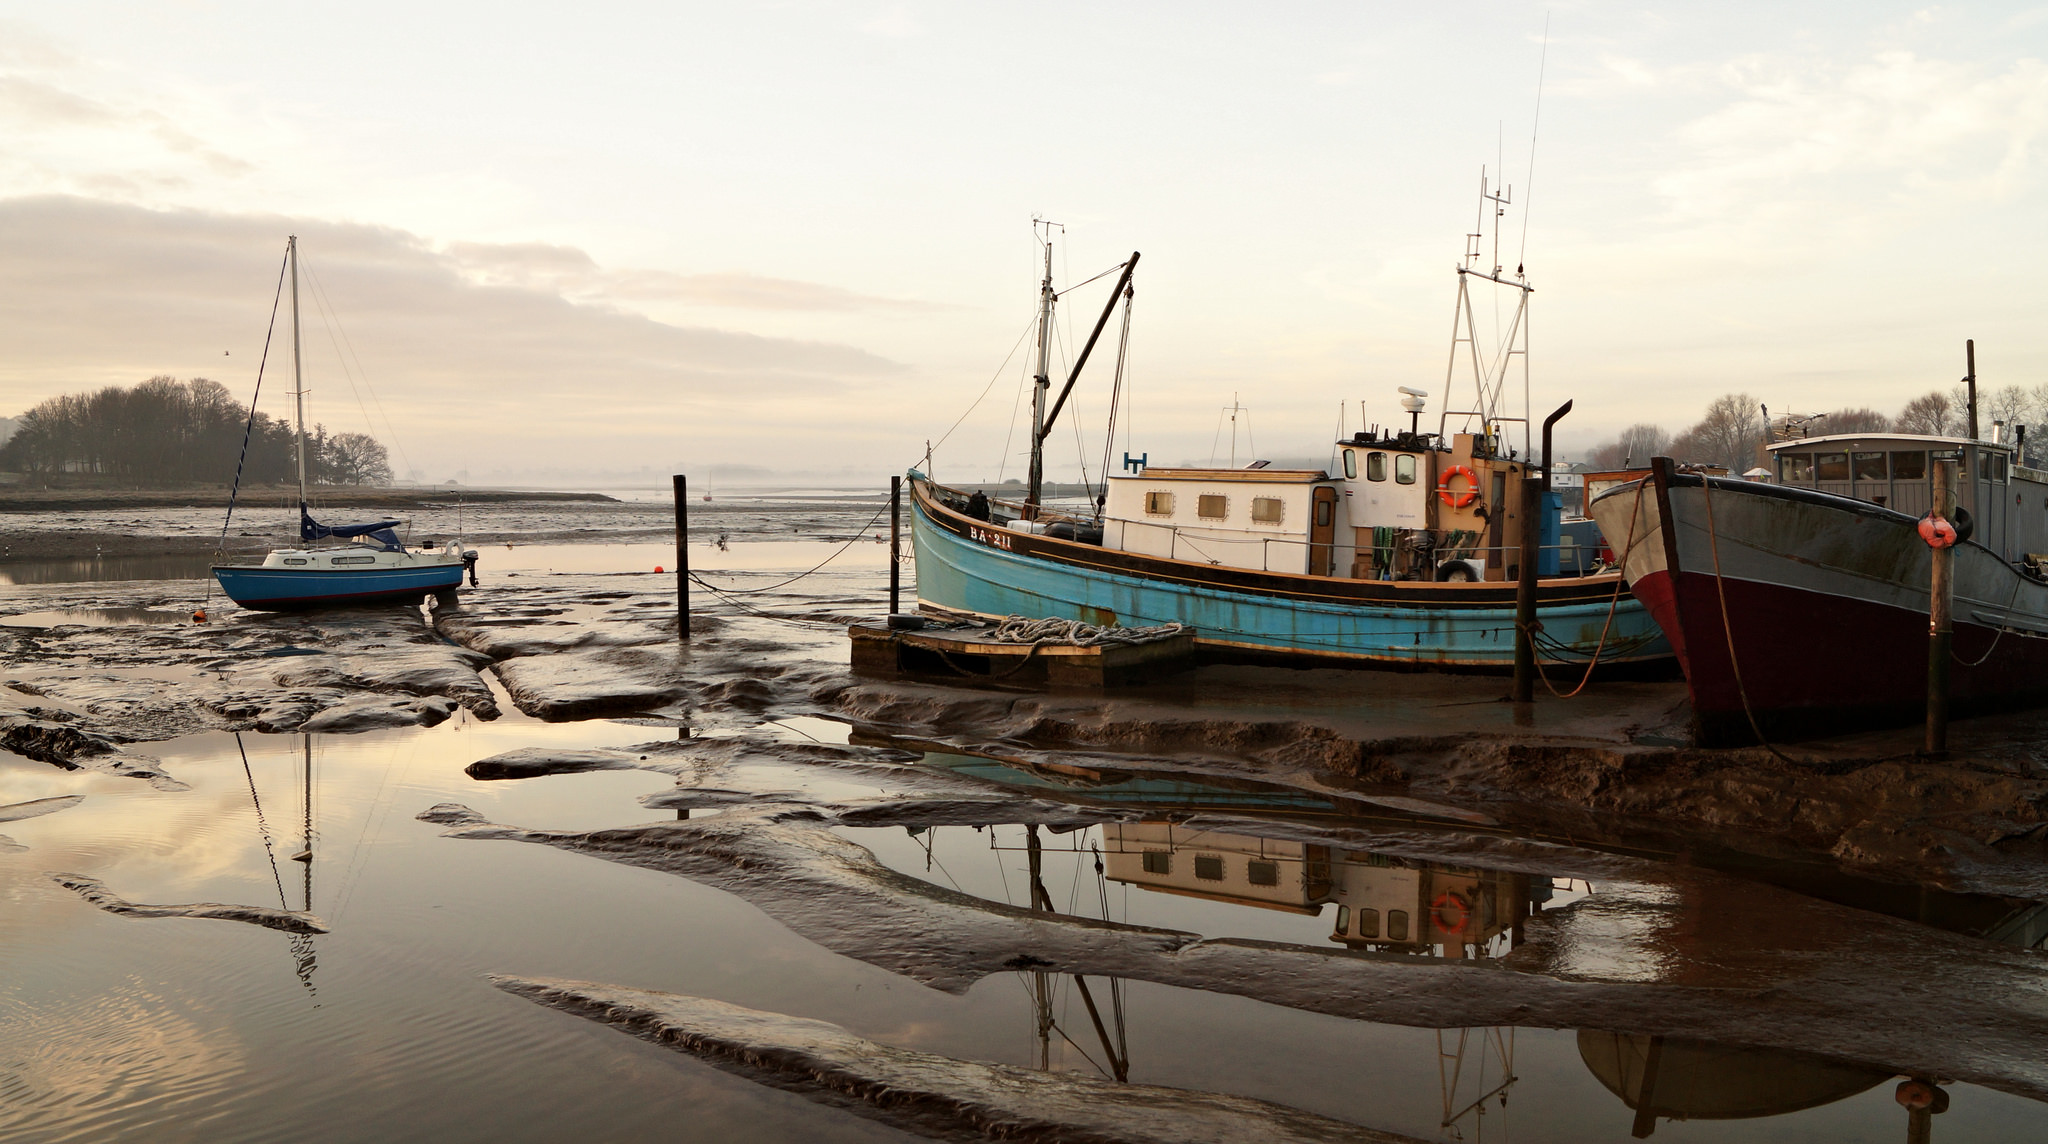
| 12:36, 16 April 2018 | DebenEstuary.JPG (file) |  |
610 KB | Deben estuary, UK. Photo credit: Bescoe | 1 |
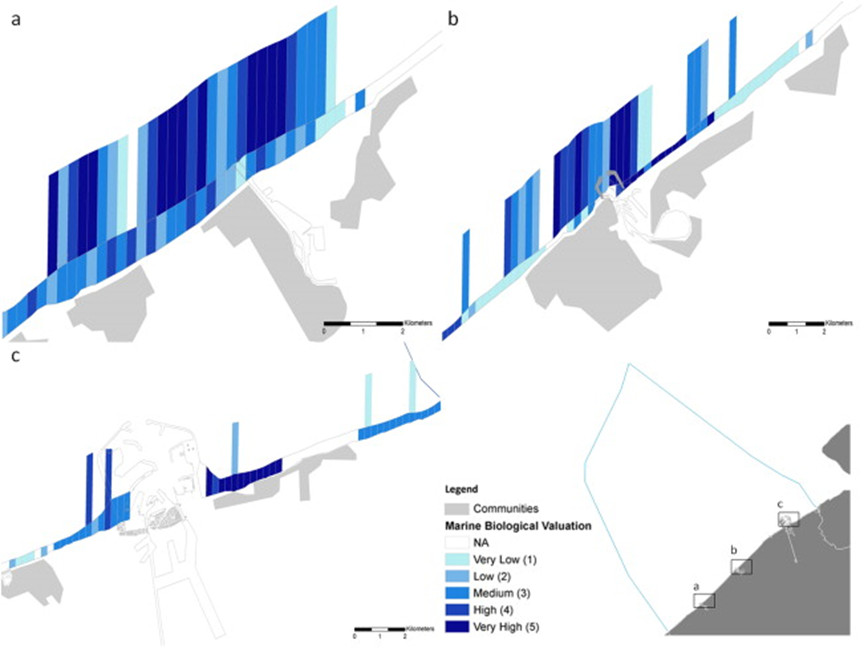
| 13:26, 23 November 2017 | MarBiolValuationBelgium.jpg (file) |  |
68 KB | Biological valuation maps of areas located near three main harbours at the Belgian coastal zone: (a) Nieuwpoort (Lombardsijde); (b) Oostende (Oostende-East); (c) Zeebrugge (Baai van Heist). | 1 |
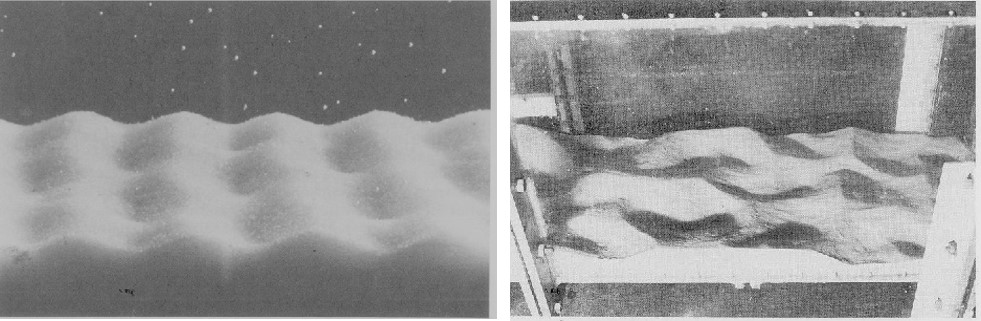
| 17:21, 3 August 2017 | BlondeauxFig7ab.jpg (file) |  |
90 KB | Left: 7a. Brick-pattern ripples observed during a laboratory experiment. Right: 7b. Three-dimensional vortex ripples observed during a laboratory experiment (7a and 7b courtesy of John F.A. Sleath). | 1 |
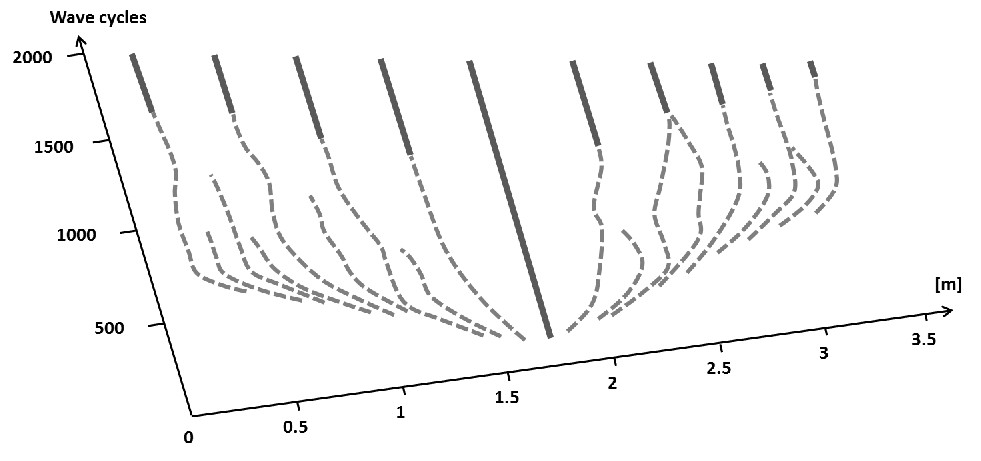
| 11:27, 3 July 2017 | WaveRippleFormationFig14.jpg (file) |  |
47 KB | Time evolution of the crests of the ripples generated by the growth of a sandy Gaussian hump which interacts with an oscillatory flow (adapted from Marieu et al. 2008). | 1 |
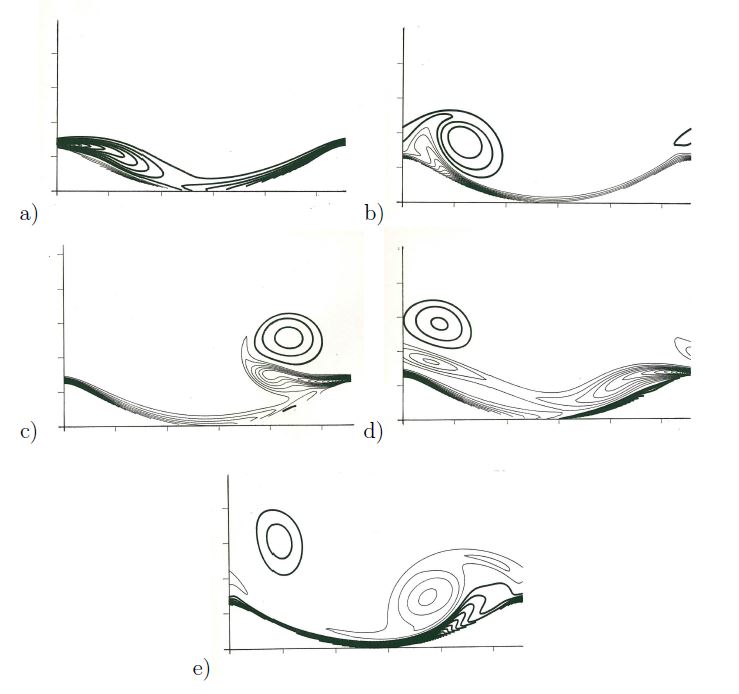
| 11:25, 3 July 2017 | WaveRippleFormationFig13.jpg (file) |  |
47 KB | Vorticity contours of the oscillatory flow over a wavy wall at different wave phases. | 1 |
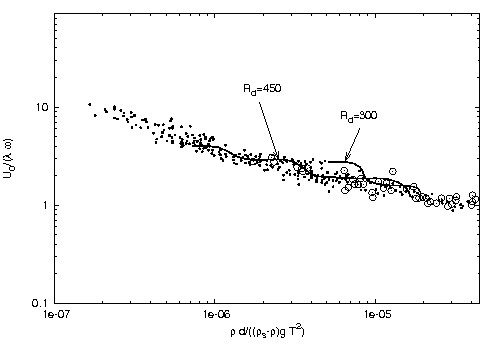
| 11:23, 3 July 2017 | WaveRippleFormationFig12.jpg (file) |  |
20 KB | Ratio between the amplitude <math>U_0/\omega</math> of the fluid displacement oscillations and the wavelength <math>\lambda</math> of the ripples plotted versus the parameter <math>\rho d/(\rho_s-\rho) g T^2</math>. | 1 |
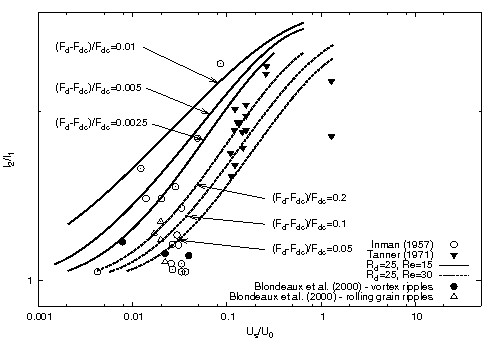
| 11:22, 3 July 2017 | WaveRippleFormationFig11.jpg (file) |  |
39 KB | Theoretical value of the symmetry index plotted versus <math>U_s/U_0</math>. | 1 |
| 11:21, 3 July 2017 | WaveRippleFormationFig10.jpg (file) |  |
20 KB | Theoretical and experimental values of the dimensioless migration speed of ripples plotted versus <math>R_\delta</math>. | 1 |
| 11:20, 3 July 2017 | WaveRippleFormationFig9.jpg (file) |  |
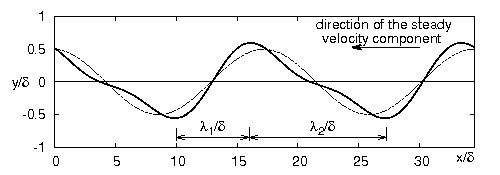
18 KB | Equilibrium profile of the ripples predicted by the stability analysis of Blondeaux et al. (2015). | 1 |
| 11:17, 3 July 2017 | WaveRippleFormationFig7.jpg (file) |  |
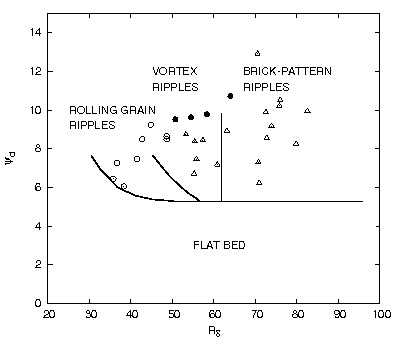
19 KB | Limiting curves dividing the <math>(R_\delta, \psi_d)</math>-plane in regions where a flat bed, rolling grain ripples, two-dimensional vortex ripples, brick-pattern ripples are expected to form. | 1 |
| 11:16, 3 July 2017 | WaveRippleFormationFig6a.jpg (file) |  |
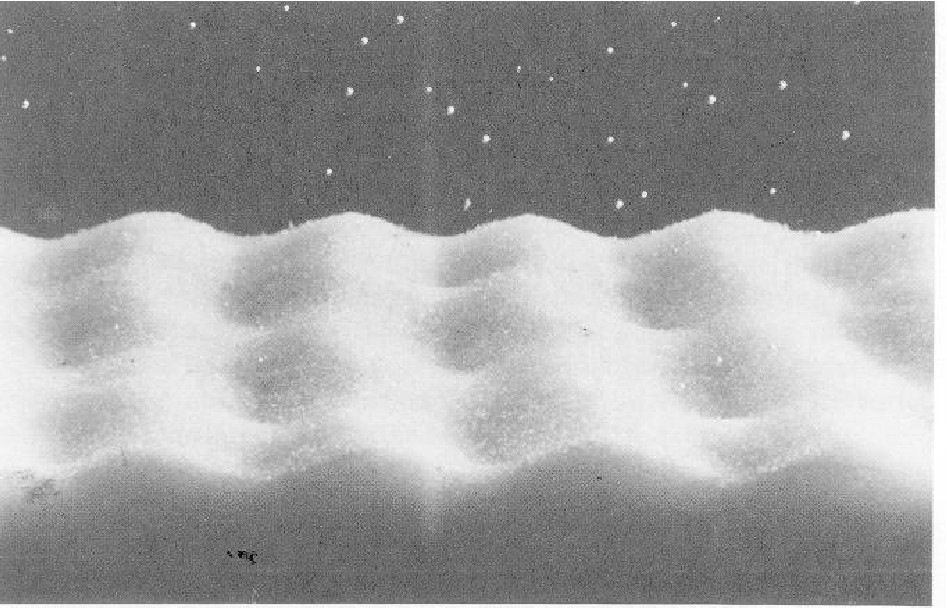
157 KB | Brick-pattern ripples (courtesy of John F.A. Sleath). | 1 |
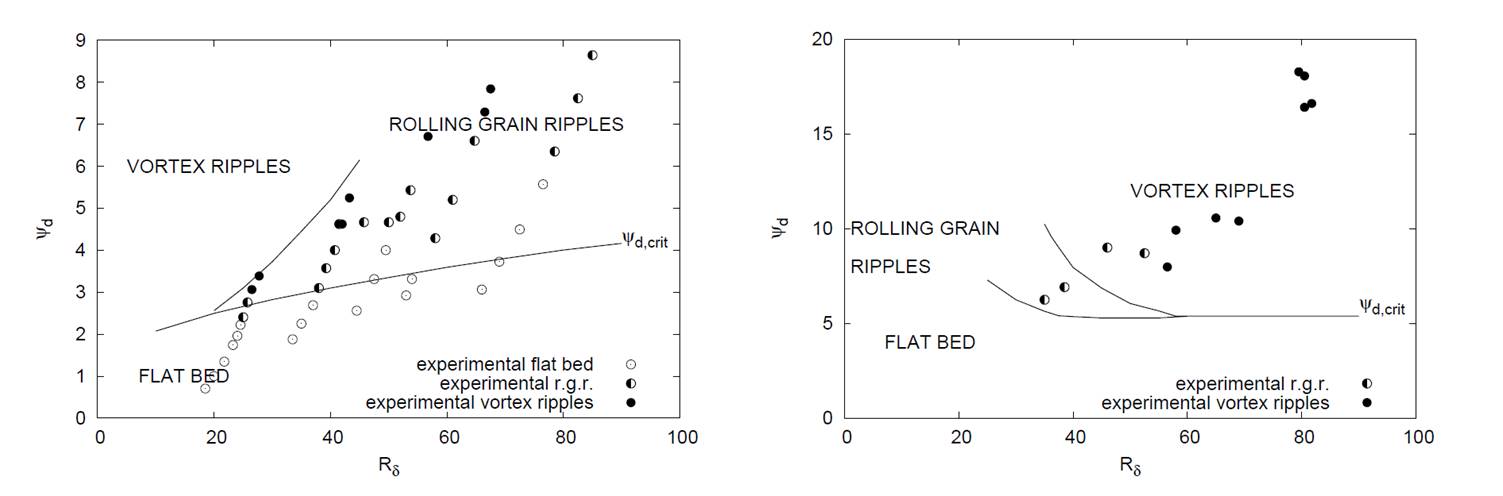
| 11:15, 3 July 2017 | WaveRippleFormationFig5ab.jpg (file) |  |
53 KB | Regions in the <math>(R_\delta,\psi_d)</math>-plane where a flat bed, rolling-grain ripples, and vortex ripples are expected to appear. Comparison between the theoretical predictions and the laboratory observations. | 1 |
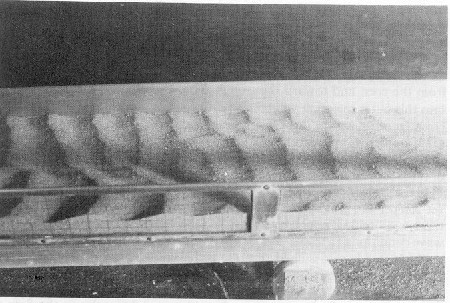
| 10:49, 3 July 2017 | WaveRippleFormationFig4b.jpg (file) |  |
56 KB | Vortex ripples (courtesy of John F.A. Sleath). | 1 |
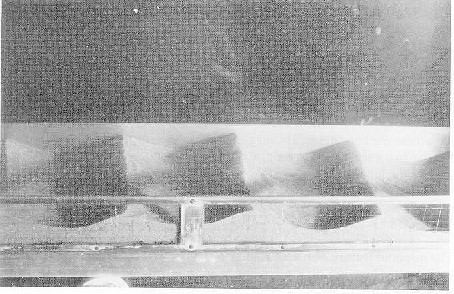
| 10:48, 3 July 2017 | WaveRippleFormationFig4a.jpg (file) |  |
48 KB | Rolling-grain ripples (courtesy of John F.A. Sleath). | 1 |
| 10:47, 3 July 2017 | WaveRippleFormationFig4.jpg (file) |  |
47 KB | Visualization of the sediments picked-up from the bed and carried into suspension by the vortices shed at the crests of large amplitudes ripples in an oscillatory flow (courtesy of Dr. Megale). | 1 |
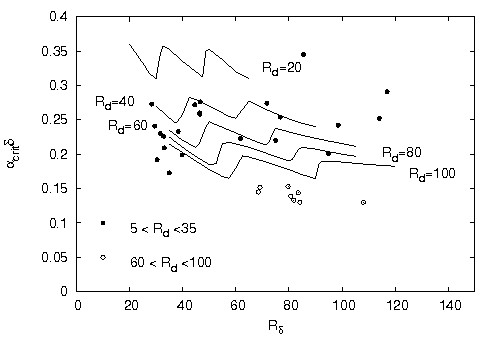
| 10:46, 3 July 2017 | WaveRippleFormationFig3.jpg (file) |  |
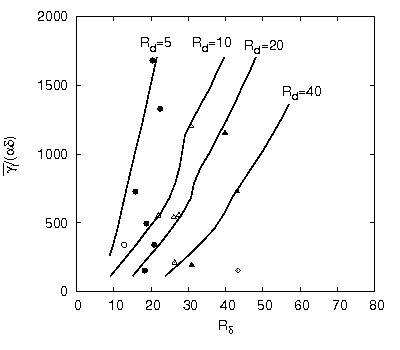
25 KB | Critical value <math>\alpha_{crit}</math> of <math>\alpha</math> plotted versus the flow Reynolds number <math>R_\delta</math> for <math>s=2.65, \mu=0.15, n=0.4</math> and different values of <math>R_d=R_p\sqrt{\psi_d}</math>. | 1 |
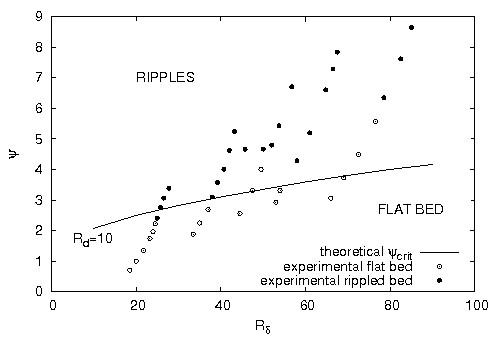
| 10:44, 3 July 2017 | WaveRippleFormationFig2.jpg (file) |  |
21 KB | Region of existence of ripples and flat beds (adapted from Blondeaux 1990). | 1 |
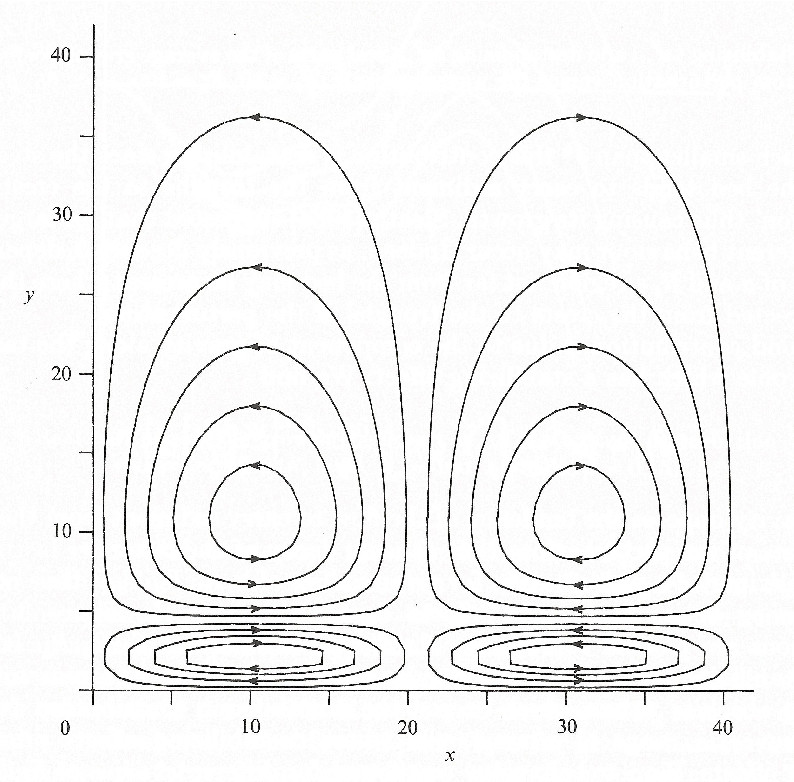
| 10:43, 3 July 2017 | WaveRippleFormationFig1.jpg (file) |  |
125 KB | Steady streaming generated by an oscillatory flow over a wavy wall (adapted from Blondeaux 1990). | 1 |
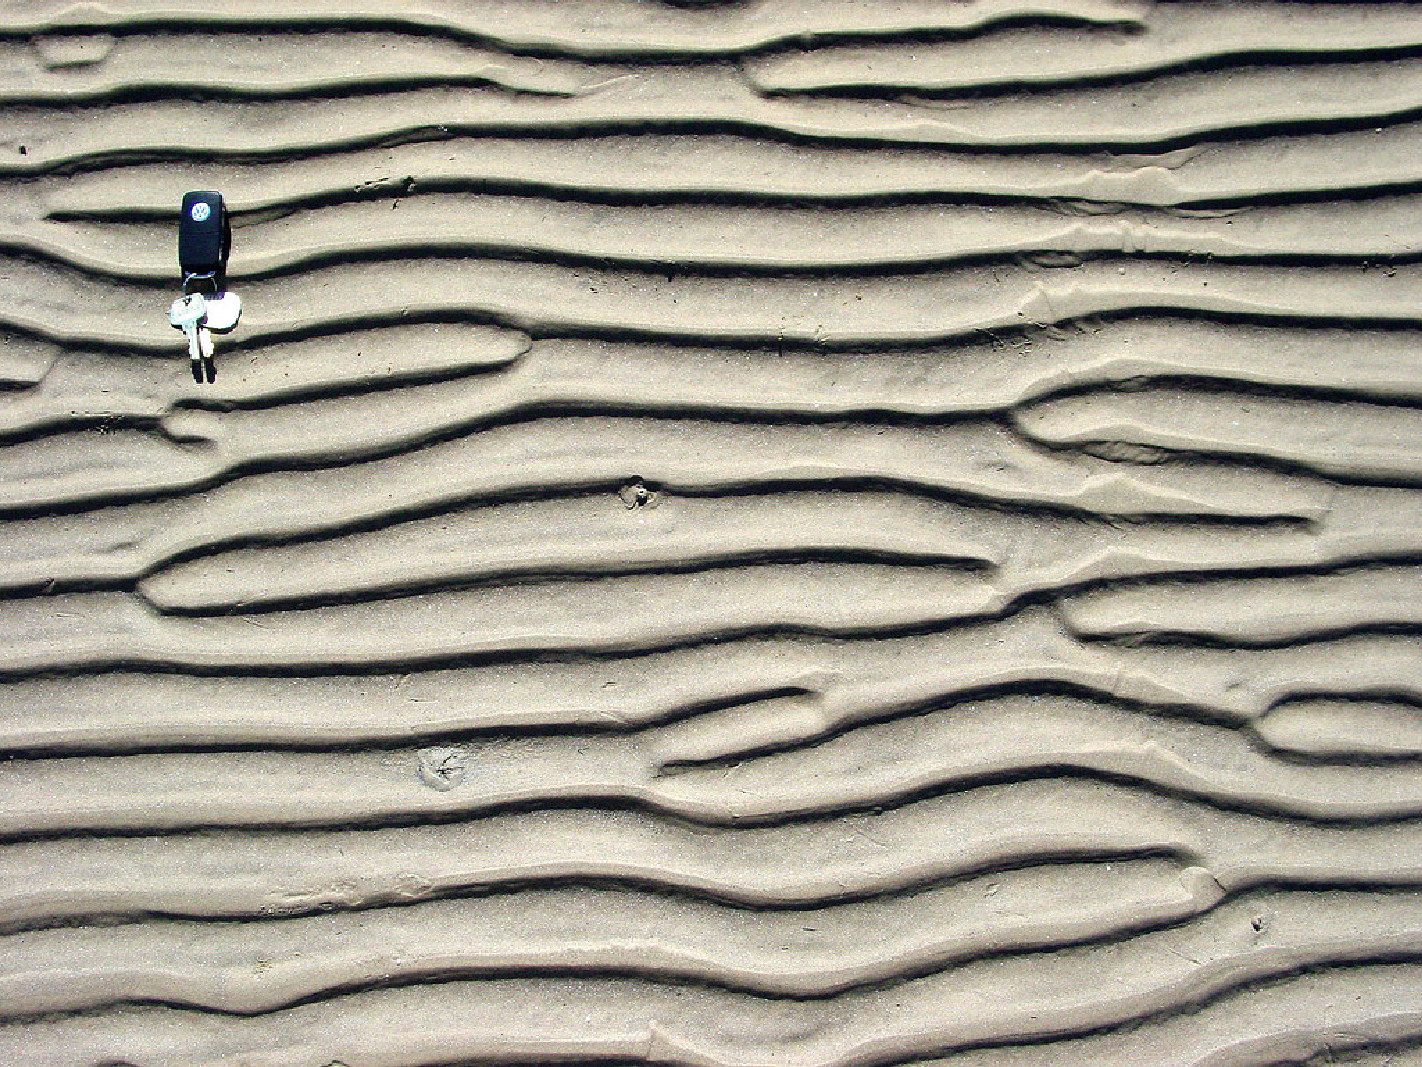
| 10:40, 3 July 2017 | WaveRippleFormationFig0.jpg (file) |  |
678 KB | Ripples observed at Sea Rim State Park, along the coast of east Texas close to the border with Louisiana (courtesy by Zoltan Sylvester). | 1 |
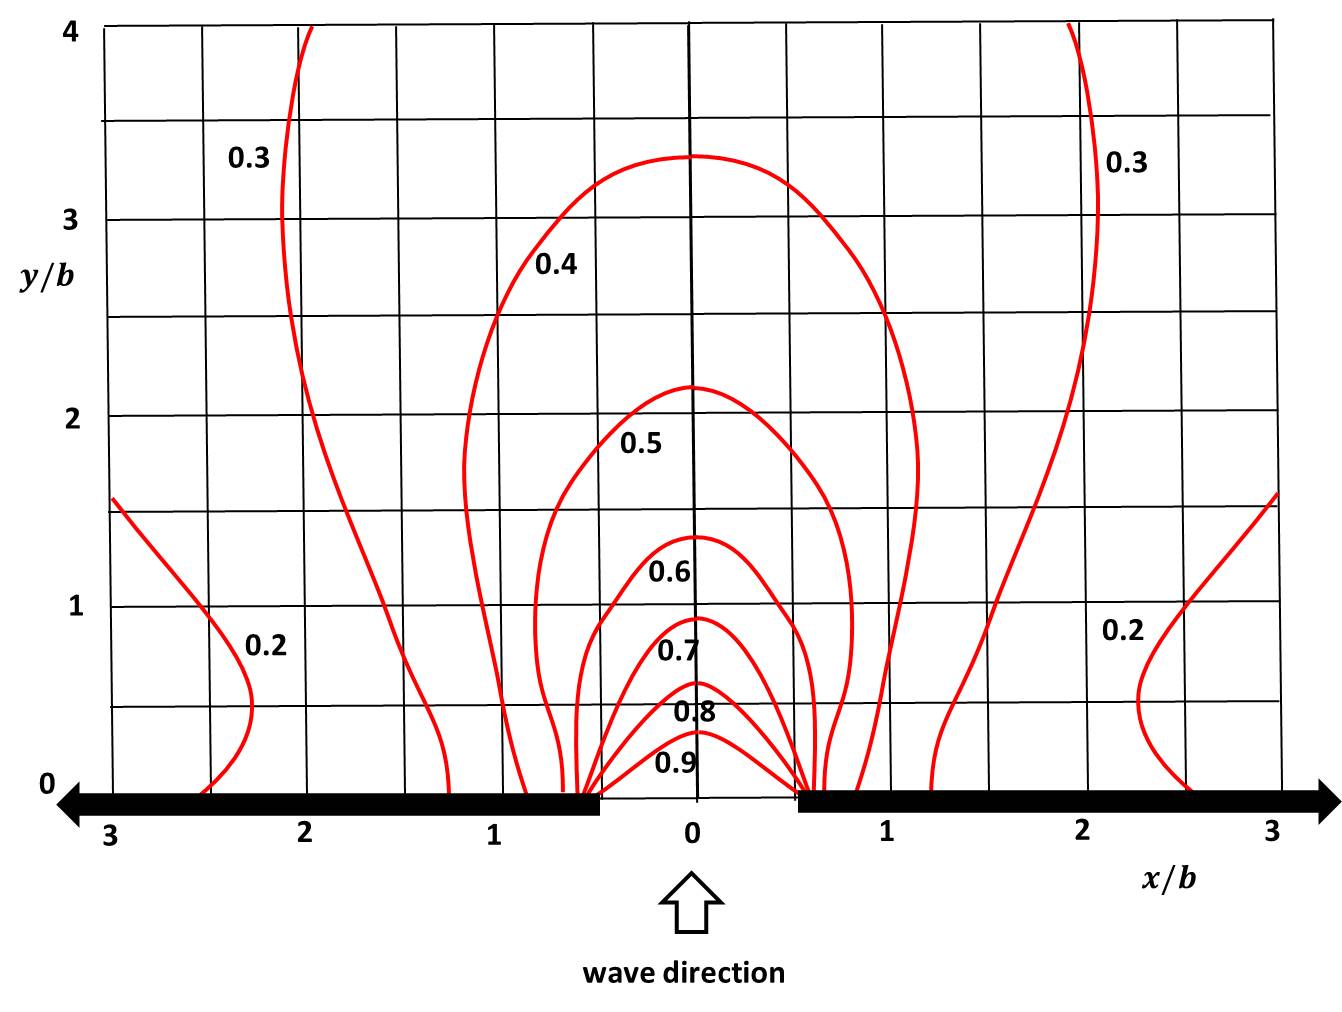
| 21:44, 30 June 2017 | ChadwickFig15f.jpg (file) |  |
111 KB | Diffraction (ratio of diffracted wave height and incident wave height) of a normally incident directional random sea state for a breakwater gap width of b=L. | 1 |