File list
This special page shows all uploaded files.
| Date | Name | Thumbnail | Size | Description | Versions |
|---|---|---|---|---|---|
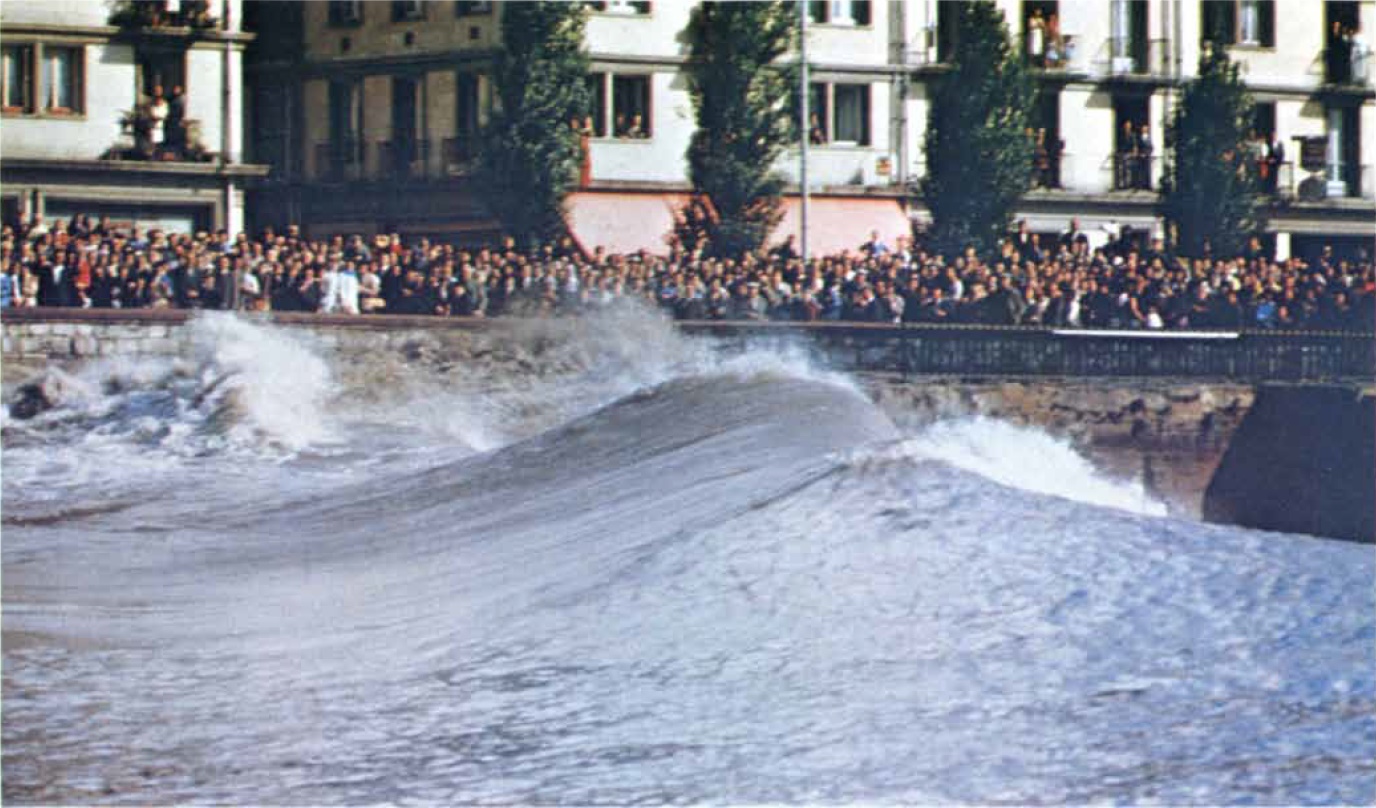
| 10:41, 1 May 2019 | SeineBore.jpg (file) |  |
407 KB | Tidal bore in the Seine at Caudebec in 1963 (Lynch, 1982). | 2 |
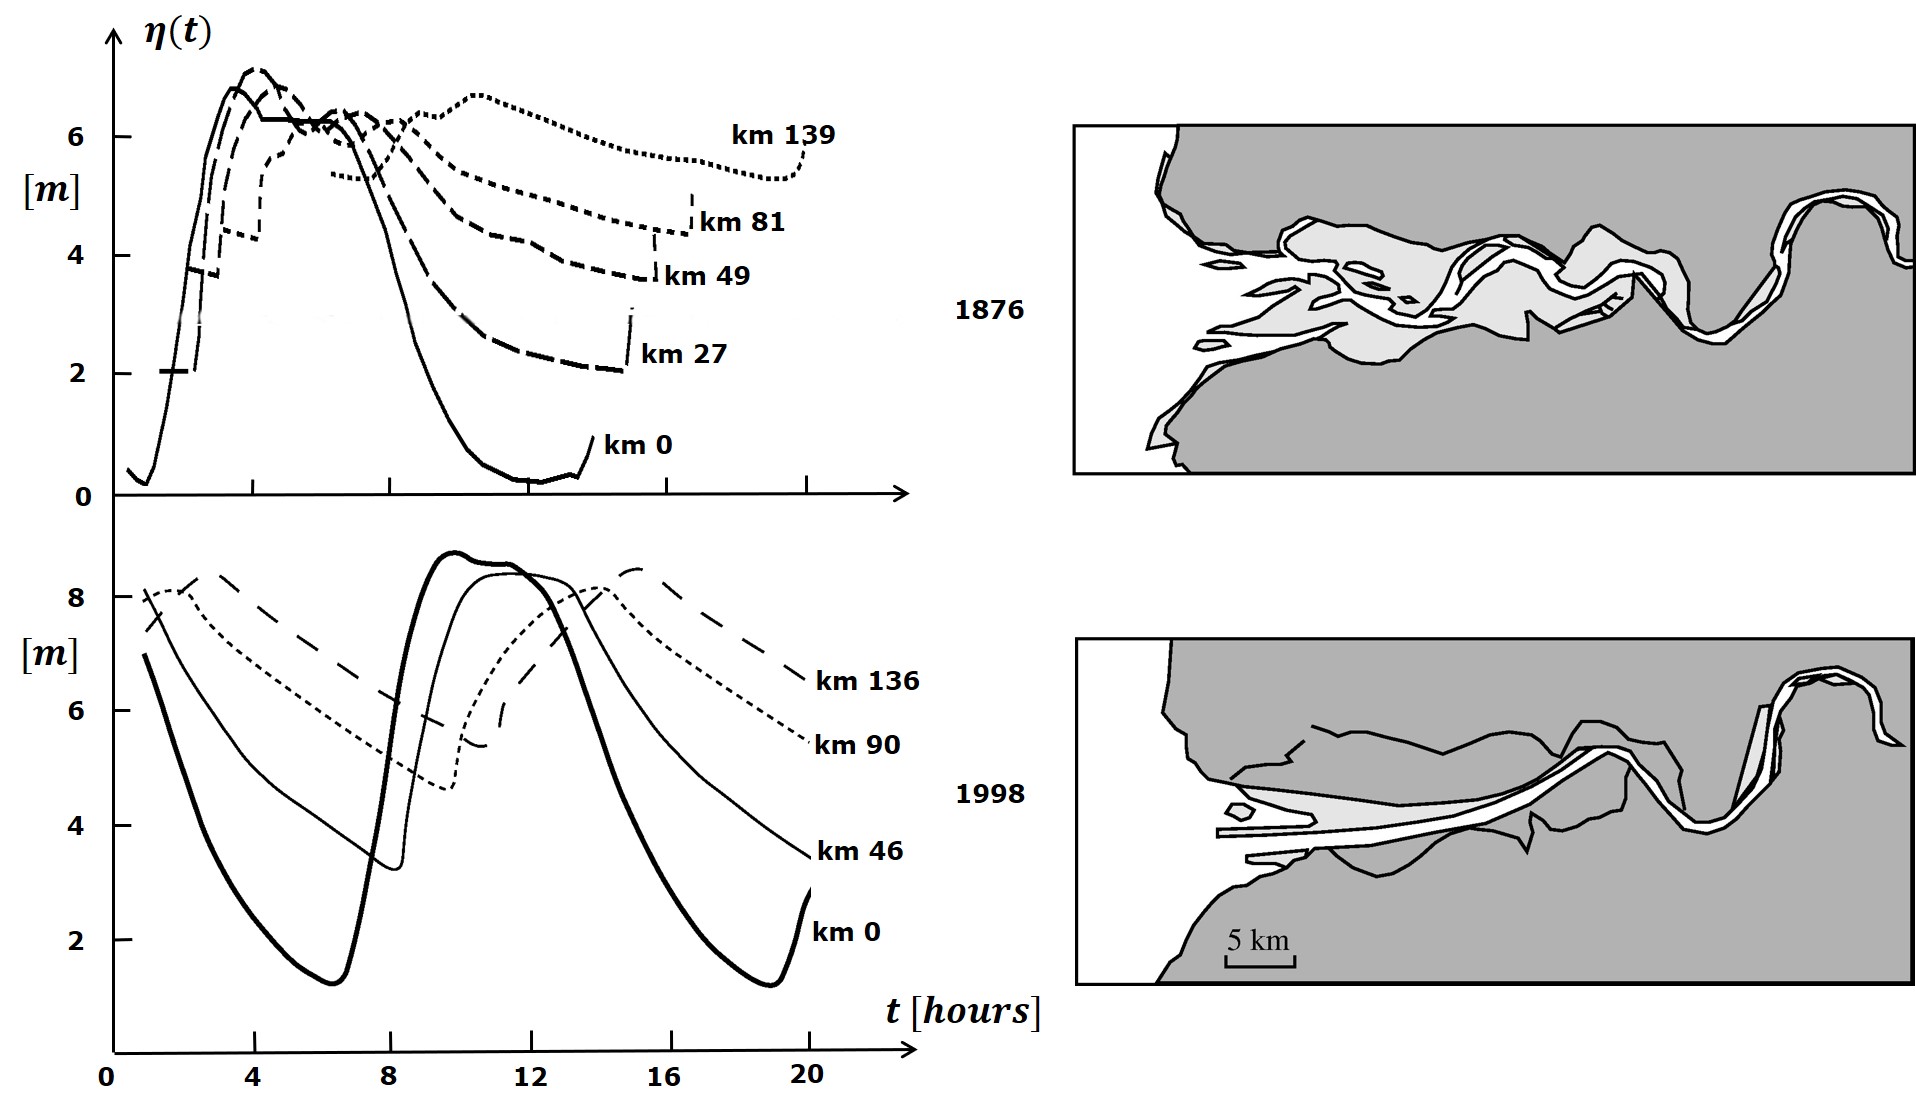
| 17:04, 28 April 2019 | SeineTidalDeformation.jpg (file) |  |
211 KB | Tidal wave deformation in the Seine in 1876 and 1998. | 1 |
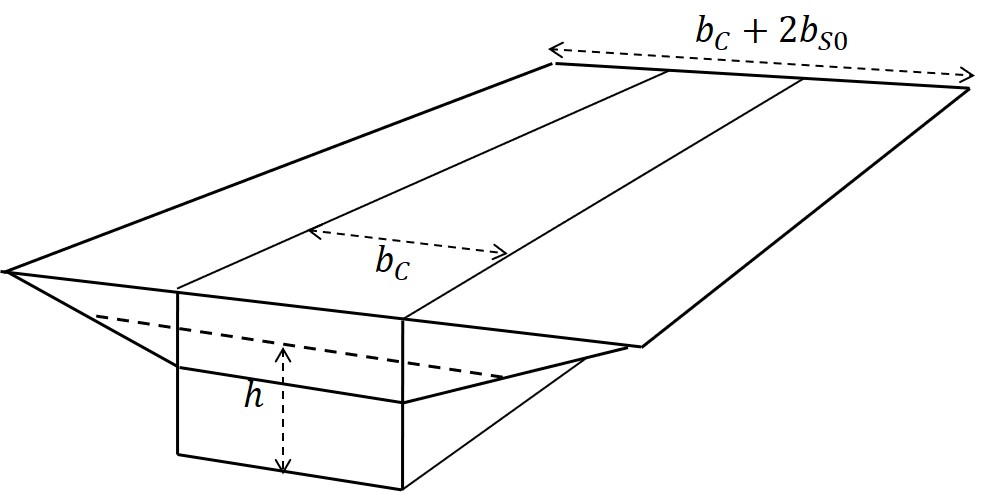
| 15:19, 28 April 2019 | PrismaticTidalFlatChannel.jpg (file) |  |
48 KB | Prismatic estuarine channel with tidal flats. | 1 |
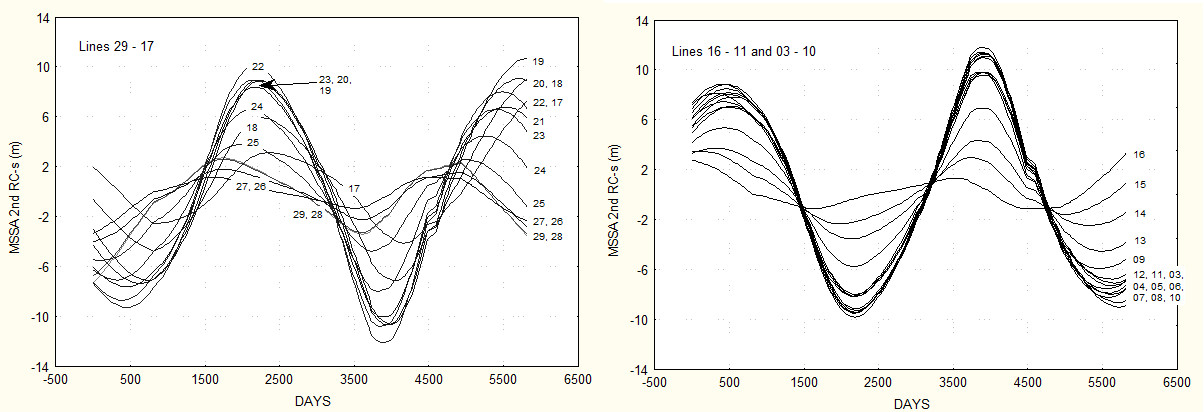
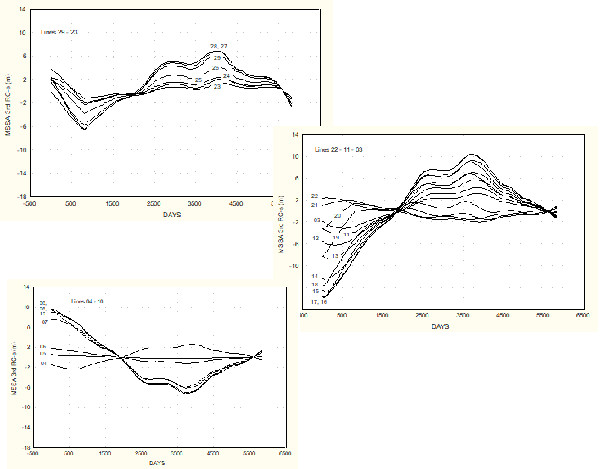
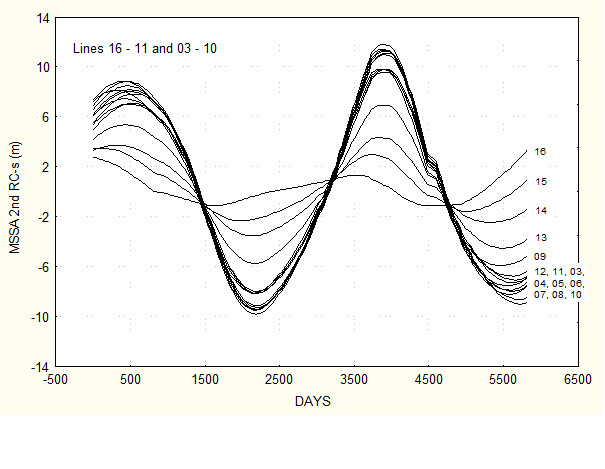
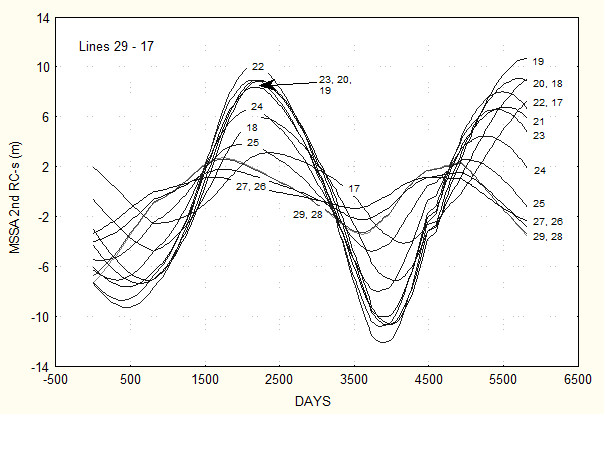
| 18:17, 8 April 2019 | Second MSSA components.jpg (file) |  |
113 KB | Left panel: Second MSSA component standing wave part a. Right panel: Second MSSA component standing wave part b. | 1 |
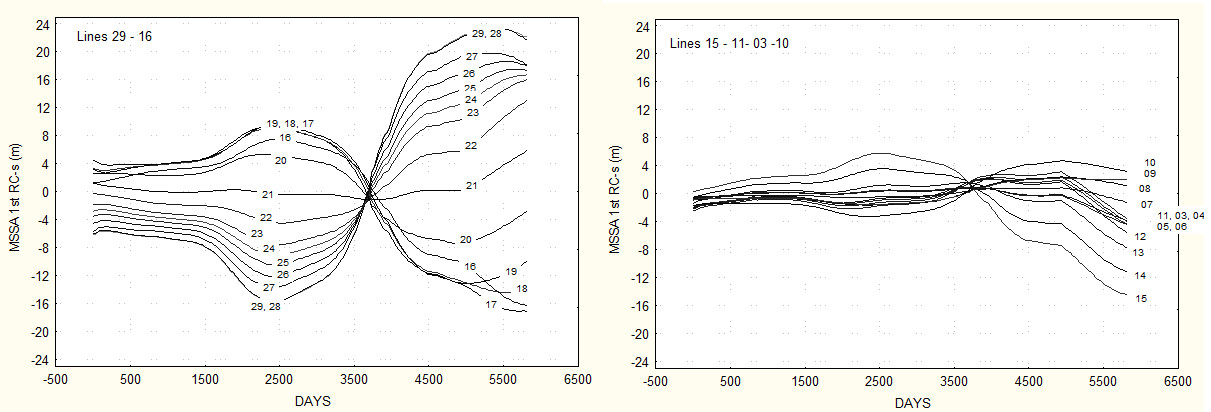
| 18:17, 8 April 2019 | First MSSA components.jpg (file) |  |
112 KB | Left panel: First MSSA component standing wave part a. Right panel: First MSSA component standing wave part b. | 1 |
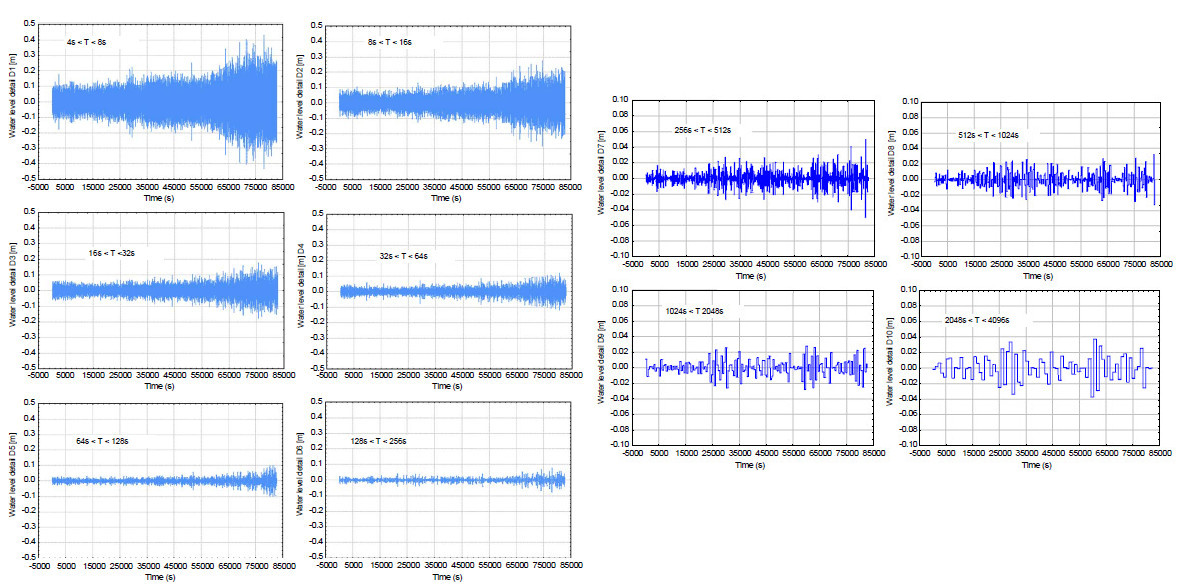
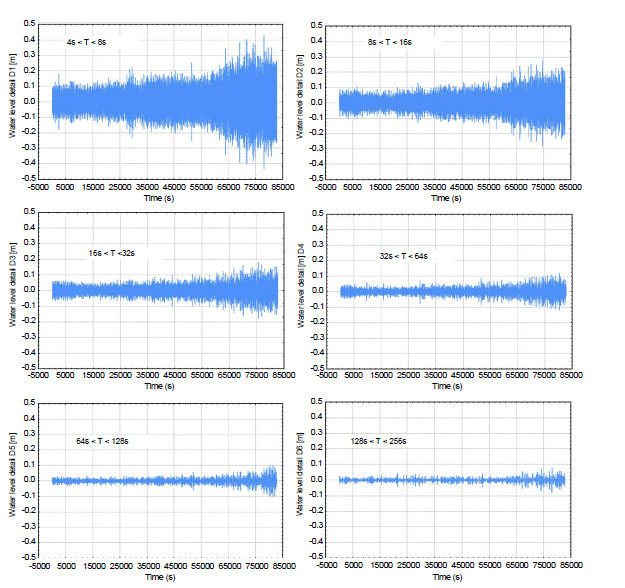
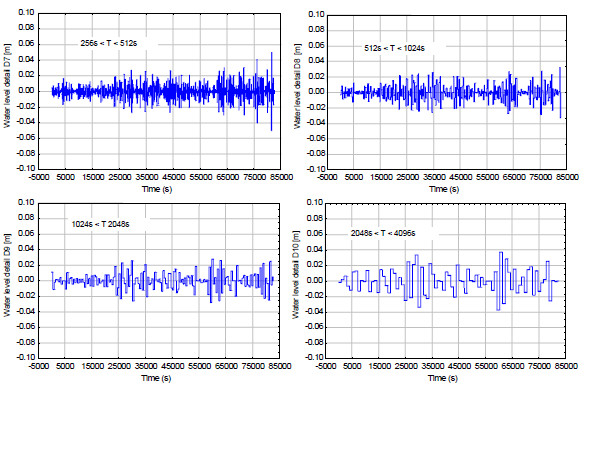
| 18:15, 8 April 2019 | Spectral bands.jpg (file) |  |
228 KB | Left panel: Spectral bands with water wave components. Right panel: Spectral bands with residual slow-varying components. | 1 |
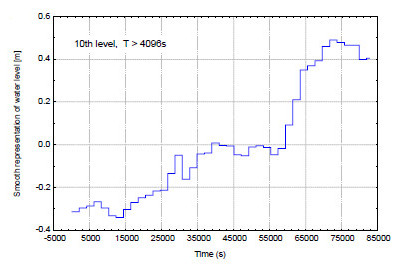
| 17:09, 8 April 2019 | Smooth representation of water level.jpg (file) |  |
28 KB | Smooth representation of water level. | 2 |
| 16:51, 8 April 2019 | Third MSSA component standing wave part a, b and c.jpg (file) |  |
51 KB | Third MSSA component standing wave part a, b and c. | 1 |
| 16:51, 8 April 2019 | Spectral bands with water wave components.jpg (file) |  |
124 KB | Spectral bands with water wave components. | 1 |
| 16:50, 8 April 2019 | Spectral bands with residual slow-varying components.jpg (file) |  |
104 KB | Spectral bands with residual slow-varying components. | 1 |
| 16:49, 8 April 2019 | Second MSSA component standing wave part b.jpg (file) |  |
55 KB | Second MSSA component standing wave part b. | 1 |
| 16:49, 8 April 2019 | Second MSSA component standing wave part a.jpg (file) |  |
61 KB | Second MSSA component standing wave part a. | 1 |
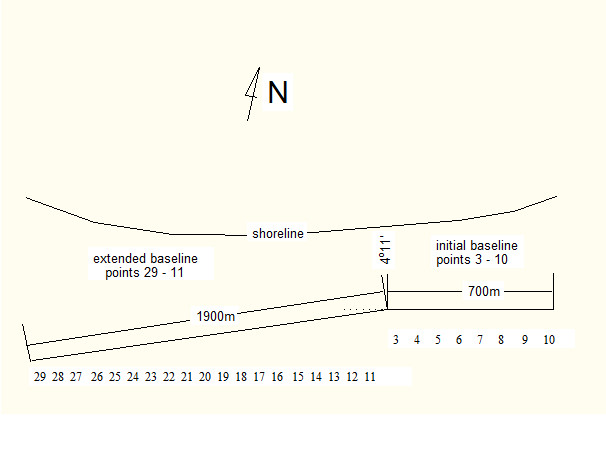
| 16:48, 8 April 2019 | Geodetic base for shoreline measurements.jpg (file) |  |
35 KB | Geodetic base for shoreline measurements. | 1 |
| 16:48, 8 April 2019 | First MSSA component standing wave part b.jpg (file) |  |
51 KB | First MSSA component standing wave part b. | 1 |
| 16:47, 8 April 2019 | First MSSA component standing wave part a.jpg (file) |  |
65 KB | First MSSA component standing wave part a. | 1 |
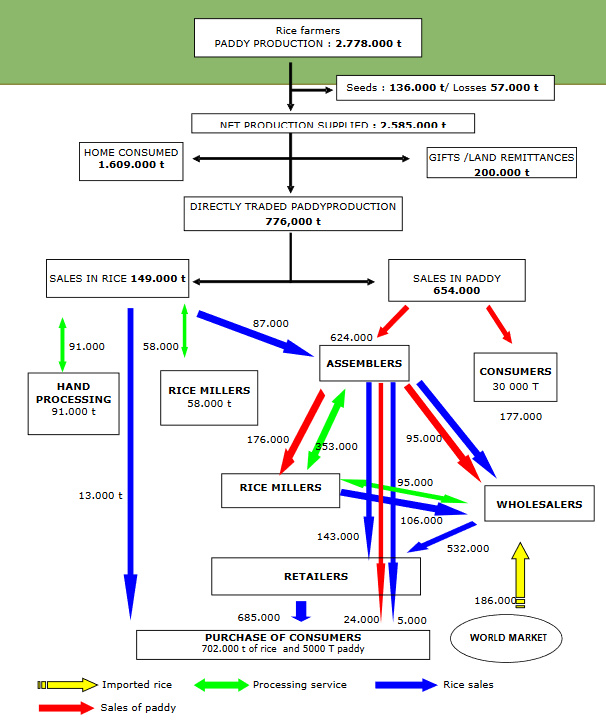
| 19:23, 25 February 2019 | FlowChartRicePaddyProduction.jpg (file) |  |
146 KB | Example of a flowchart showing flows of material in physical and monetary terms through a paddy and rice production chain (FAO, 2006) | 1 |
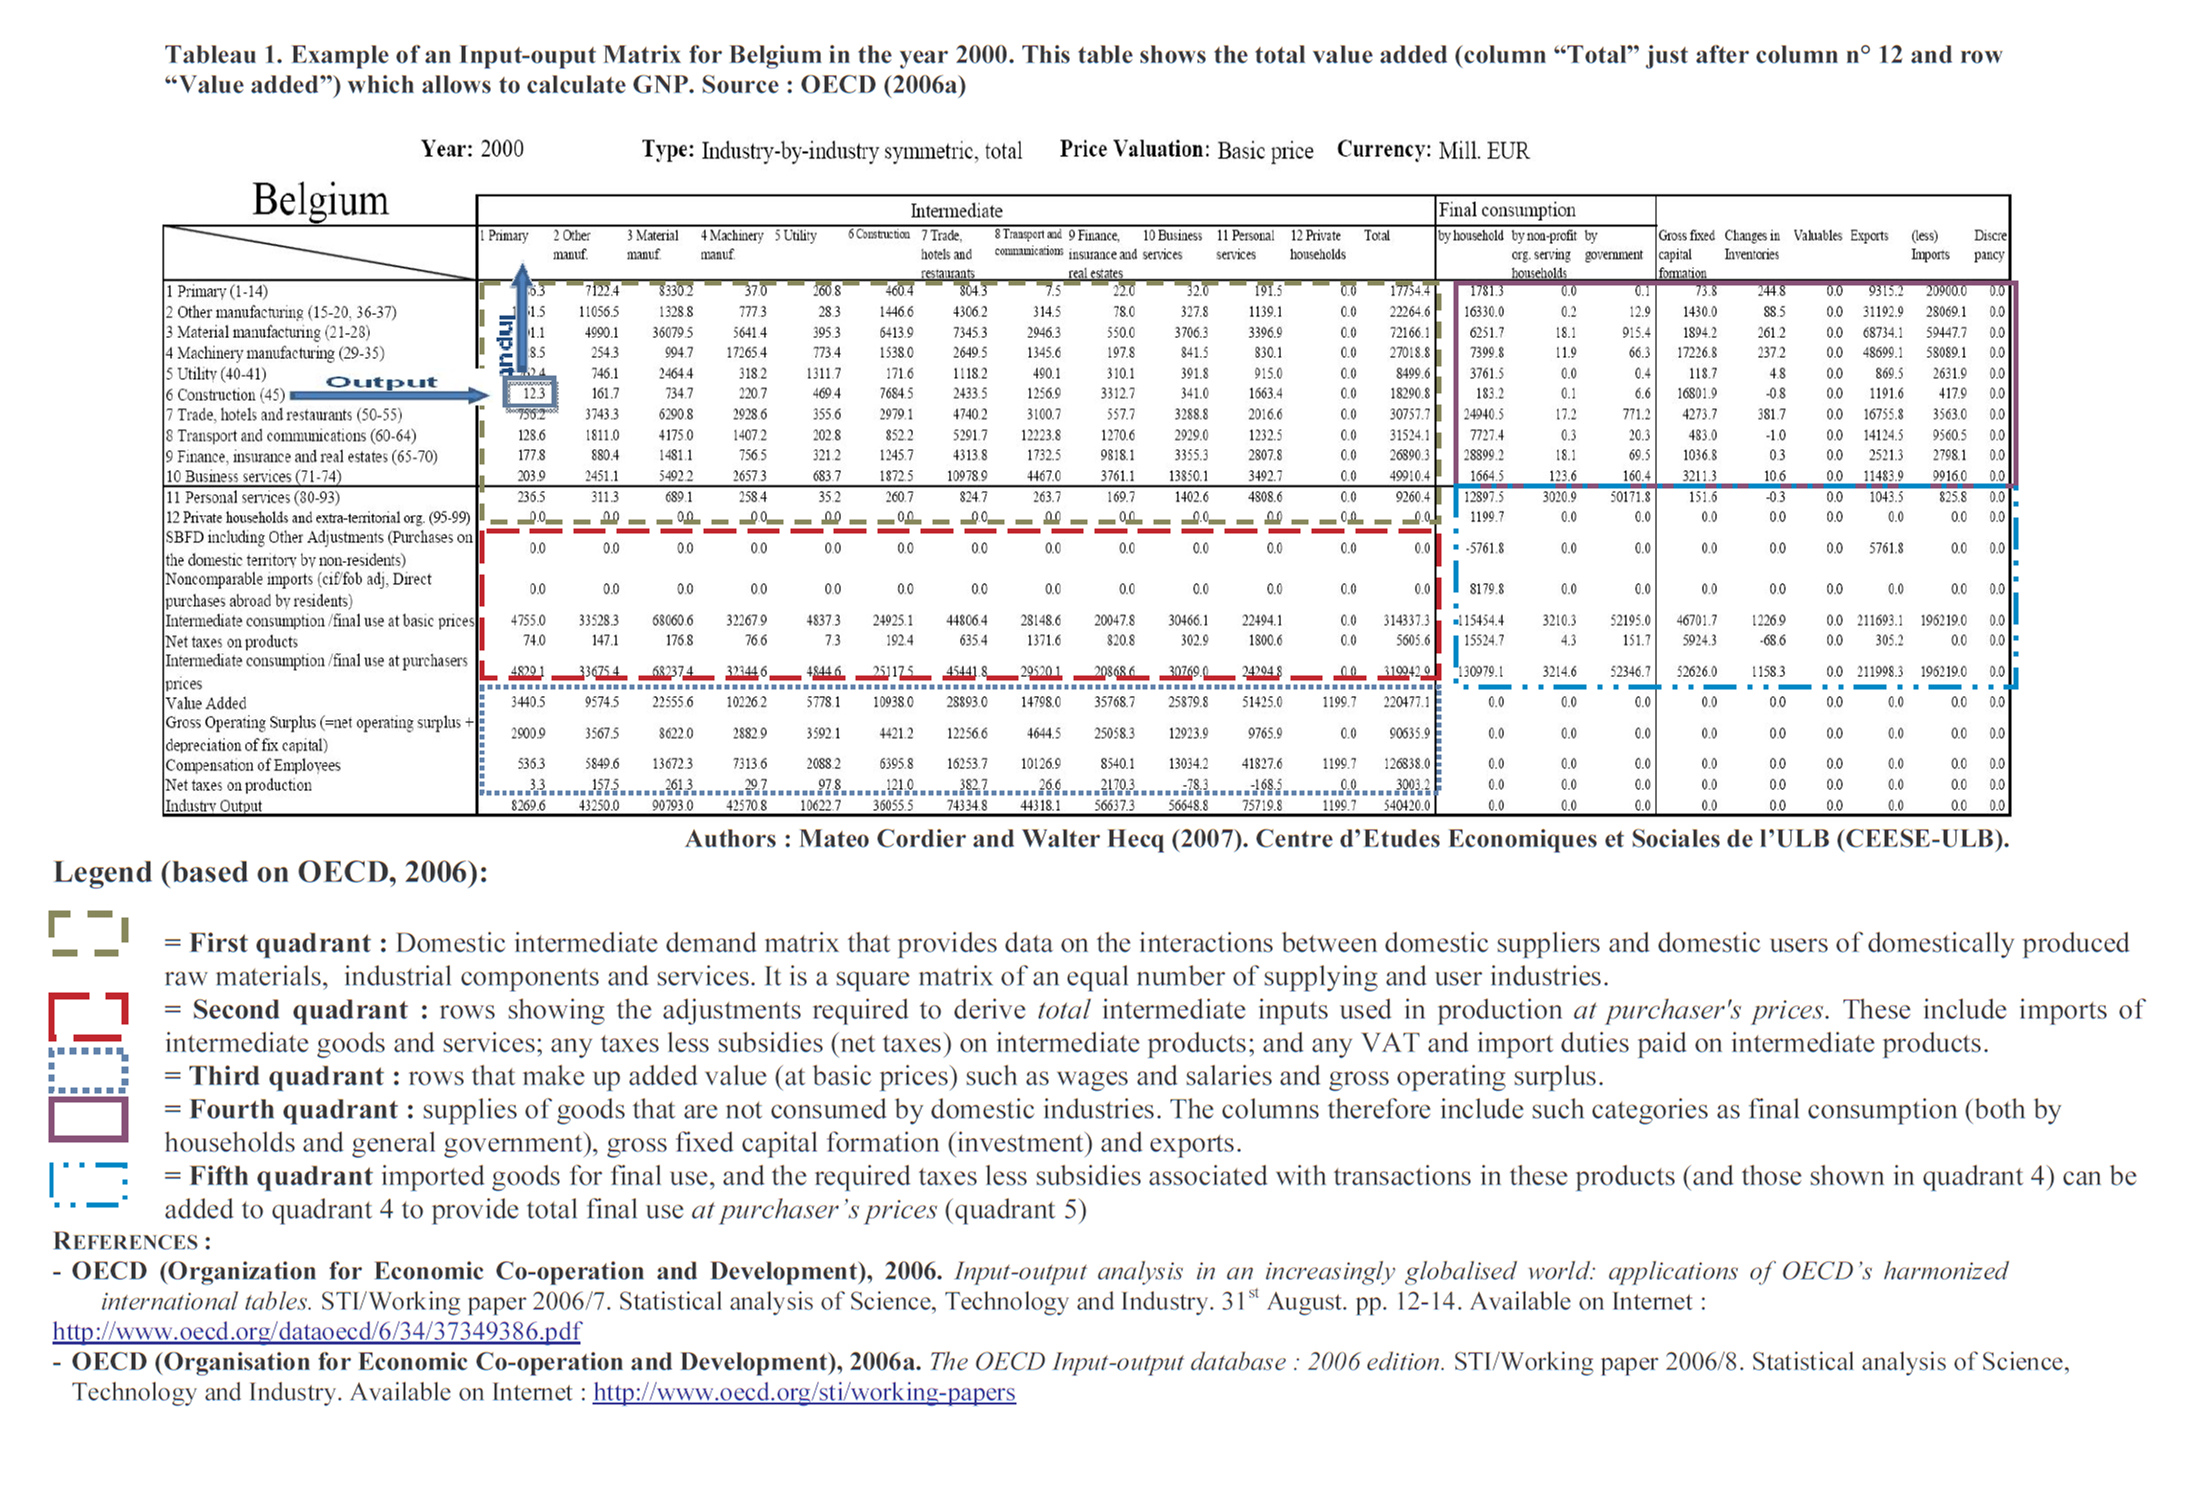
| 18:32, 25 February 2019 | InputOutputMatrixBelgium2000.jpg (file) |  |
1.12 MB | Input-Output matrix for Belgium (2009) | 1 |
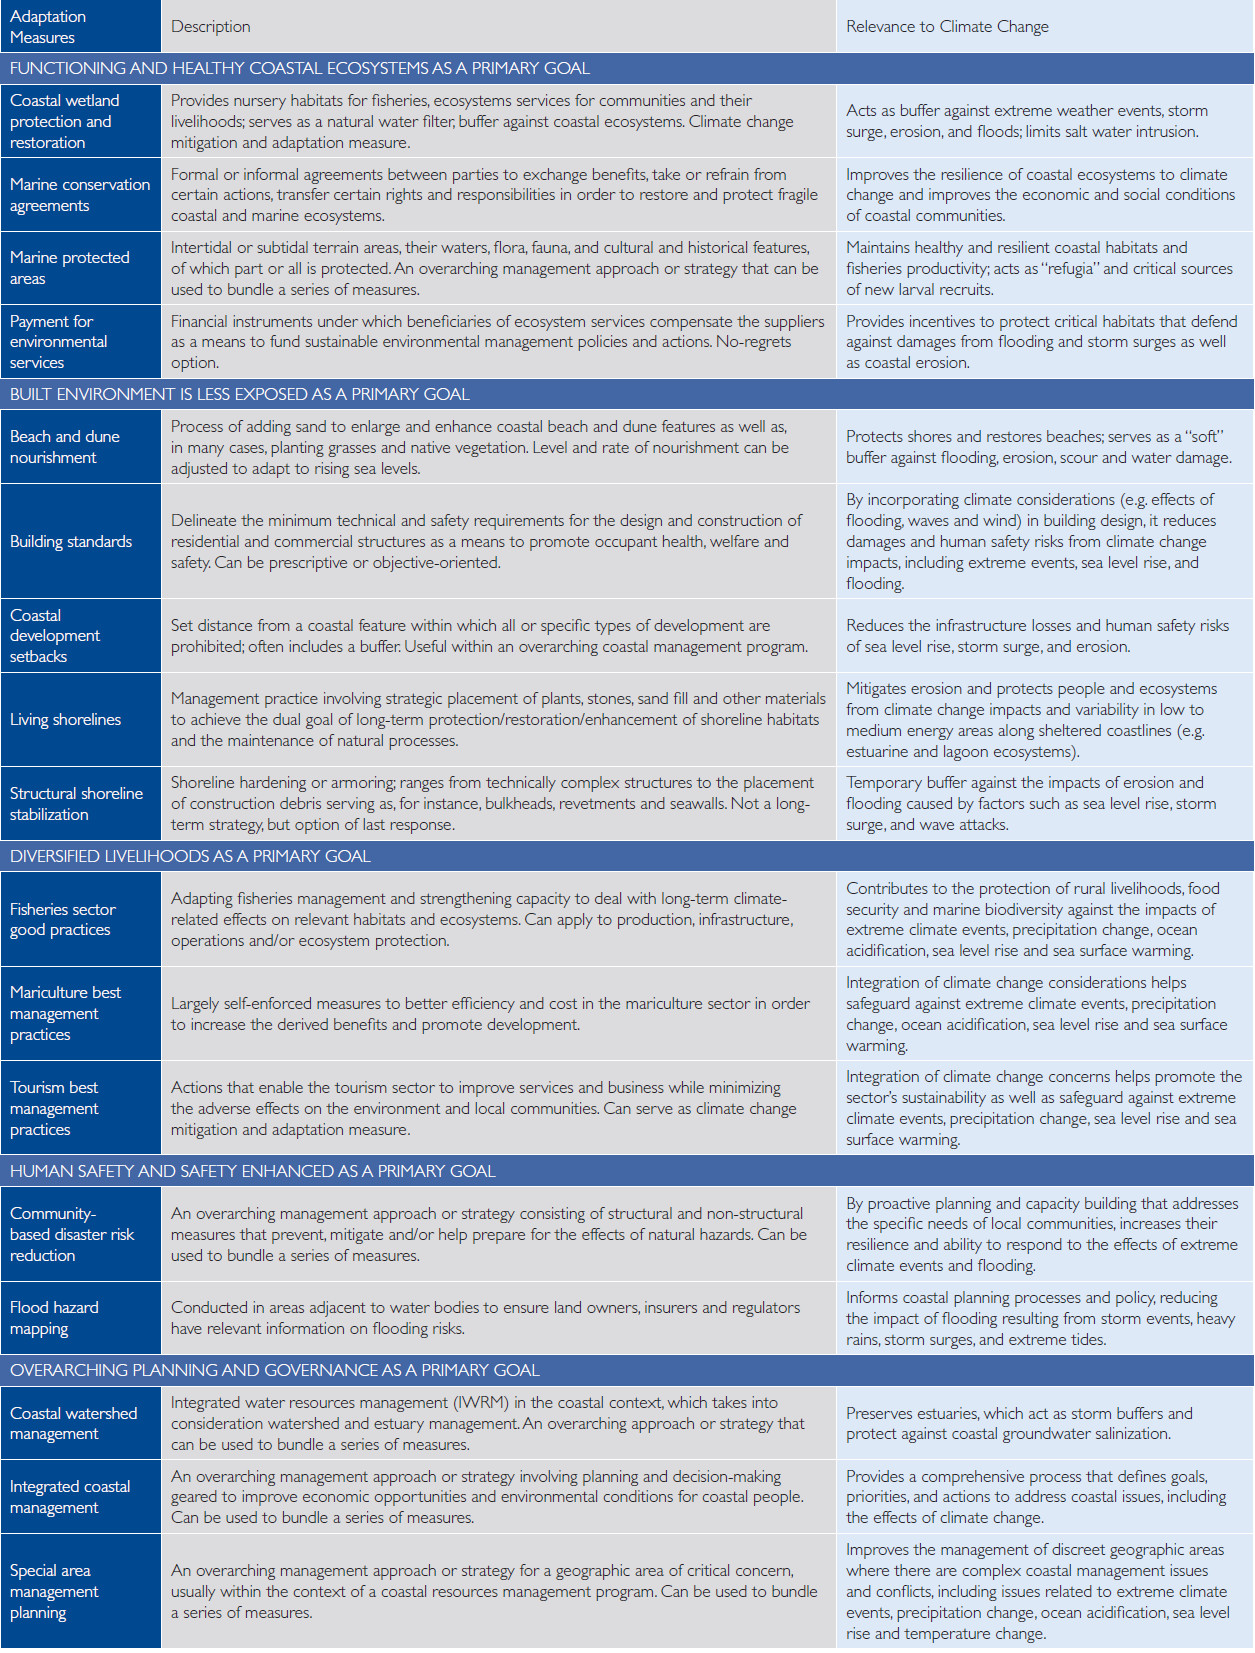
| 23:46, 22 February 2019 | AdaptationMeasuresUSAID.jpg (file) |  |
911 KB | Climate adaptation measures for the coastal zone (USAID, 2009) | 1 |
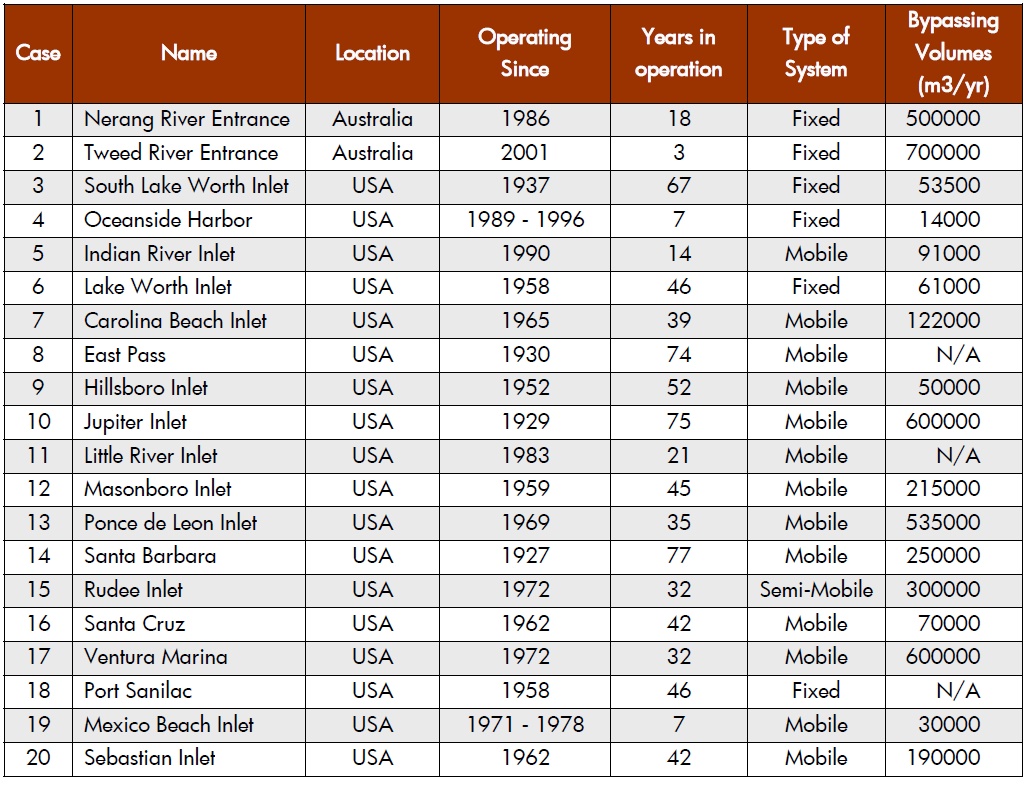
| 13:42, 21 February 2019 | SandBypassingSystemsInventory2008.jpg (file) |  |
307 KB | Inventory of sand bypass systems (Loza, 2008). | 1 |
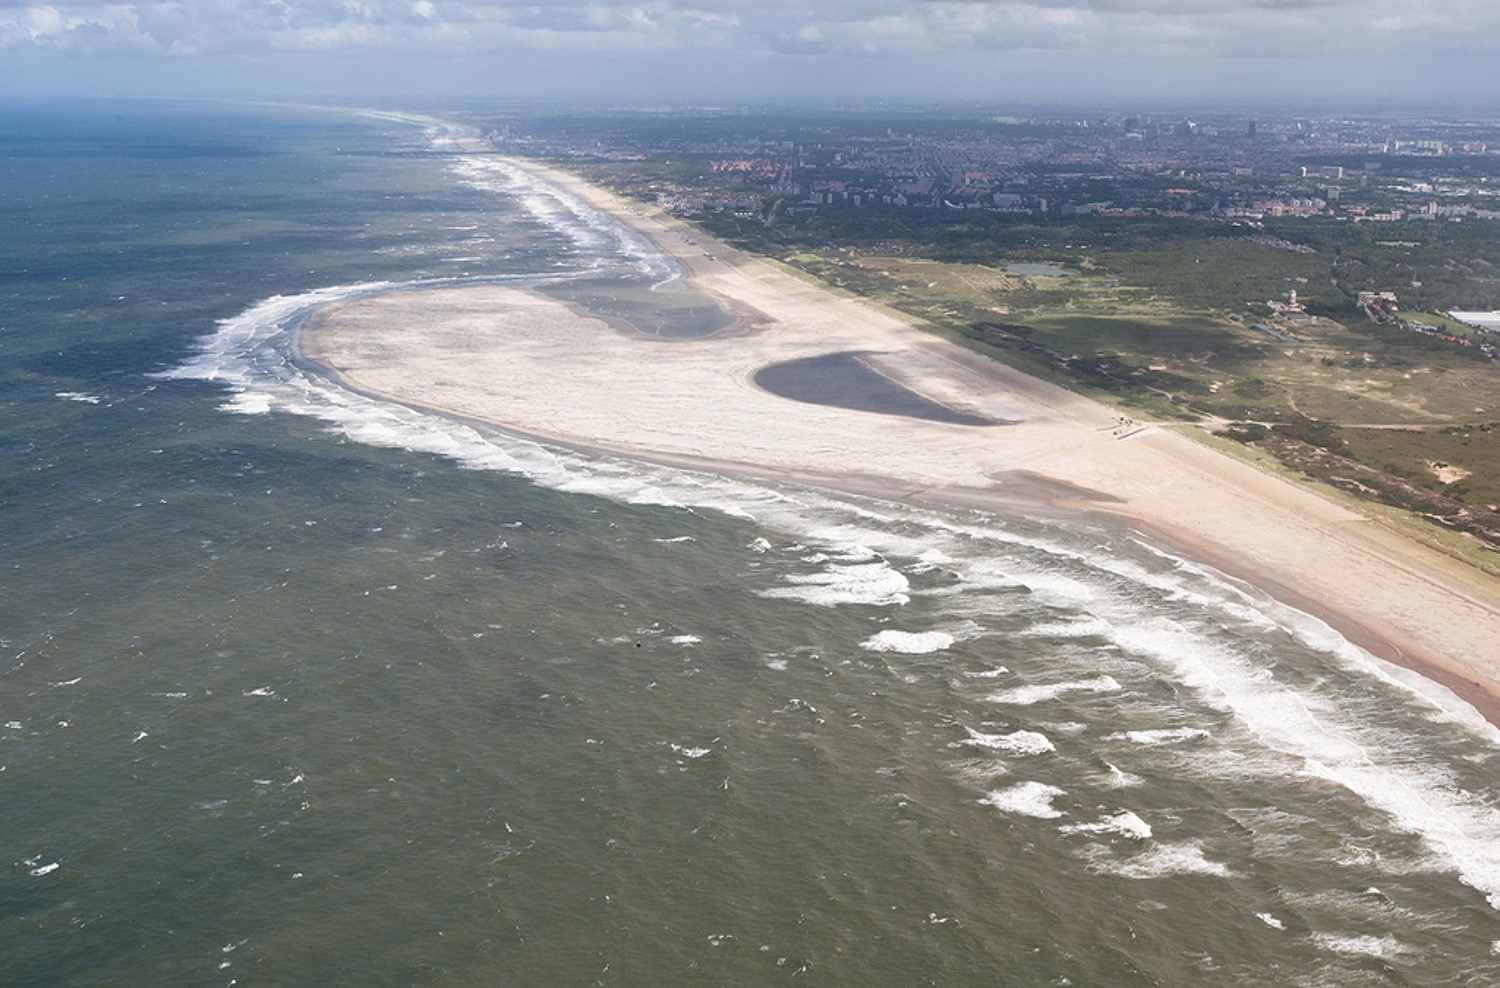
| 19:36, 16 February 2019 | Zandmotor2012.jpg (file) |  |
324 KB | A massive foreshore nourishment increases the strength of the narrow dune system protecting the coast between Rotterdam and The Hague (Netherlands). | 1 |
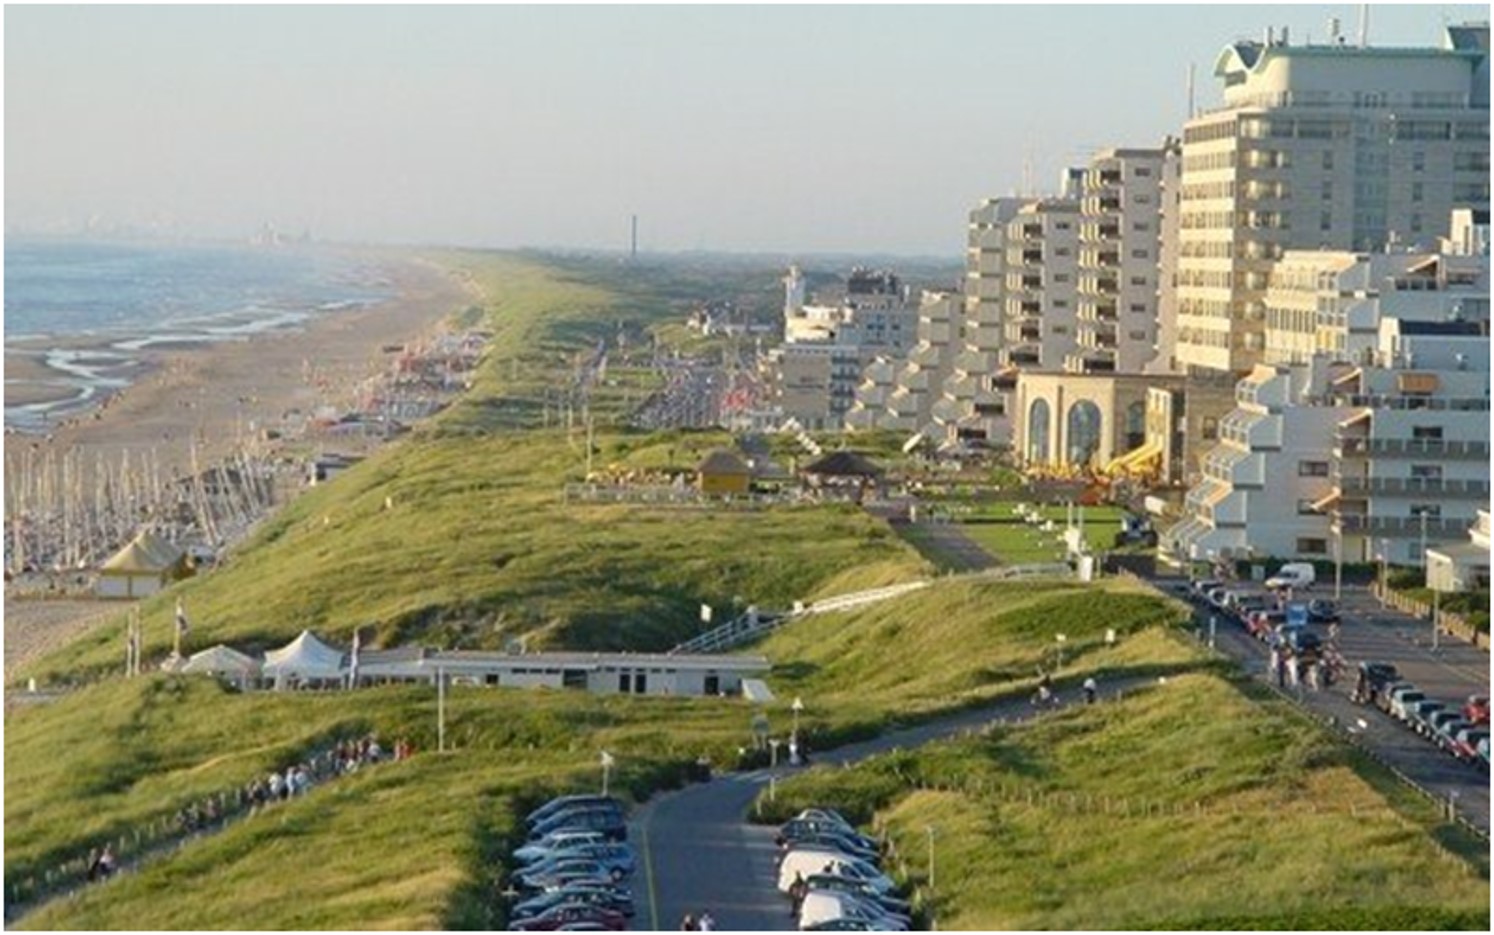
| 19:35, 16 February 2019 | NoordwijkDune.jpg (file) |  |
248 KB | An artificial dune protects the seafront of Noordwijk coastal village (Netherlands). | 1 |
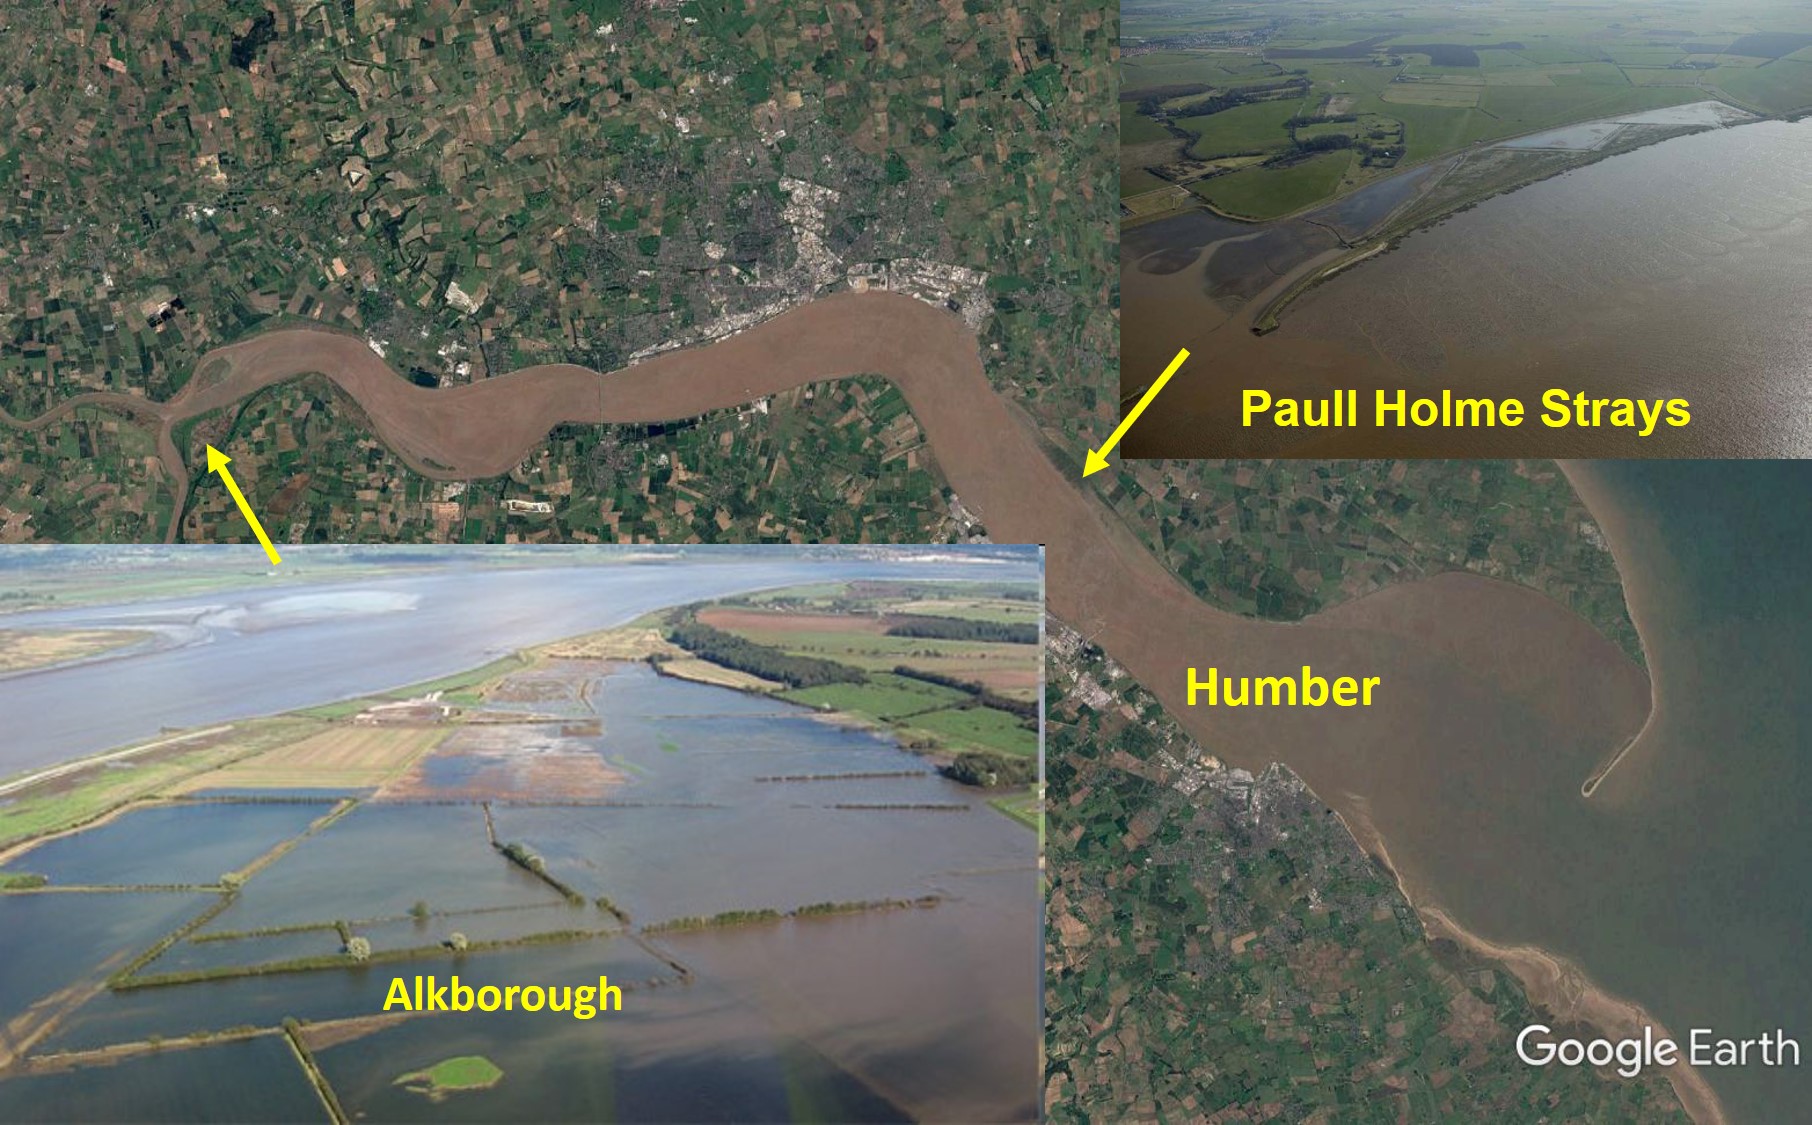
| 19:34, 16 February 2019 | HumberWetlandRestoration.jpg (file) |  |
439 KB | Realignment of coastal defences and wetland restoration projects in the Humber estuary (UK). | 1 |
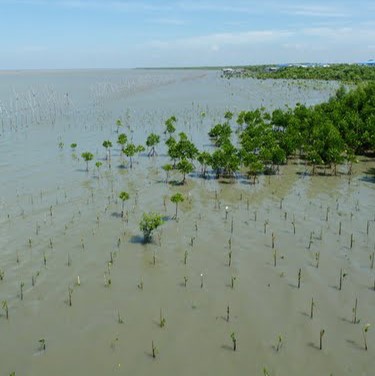
| 19:32, 16 February 2019 | MangroveRestorationThailand.jpg (file) |  |
28 KB | Mangrove reforestation project in Chachoengsao district, Thailand. | 1 |
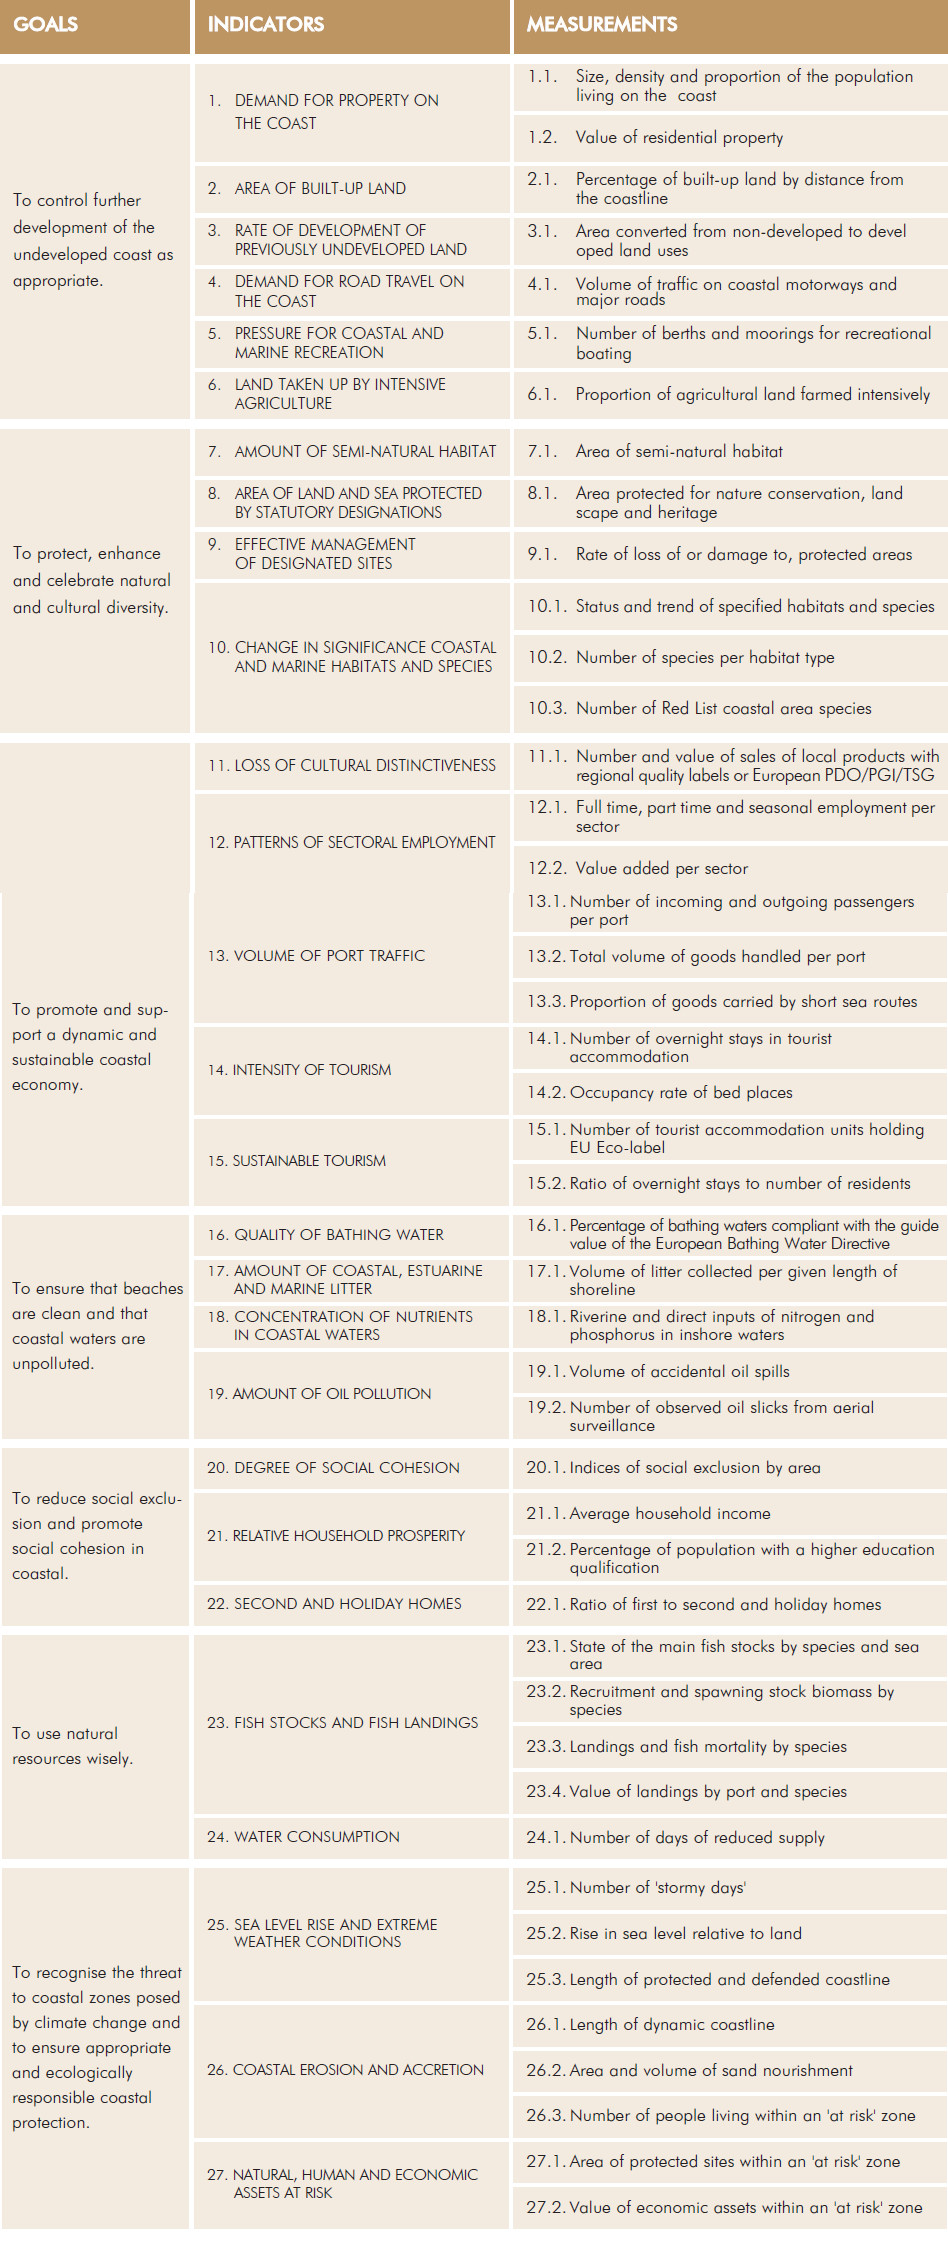
| 18:43, 16 February 2019 | ICZMindicatorsDEDUCE.jpg (file) |  |
642 KB | Quantitative ICZM indicators proposed by the DEDUCE project (Marti et al, 2007) | 2 |
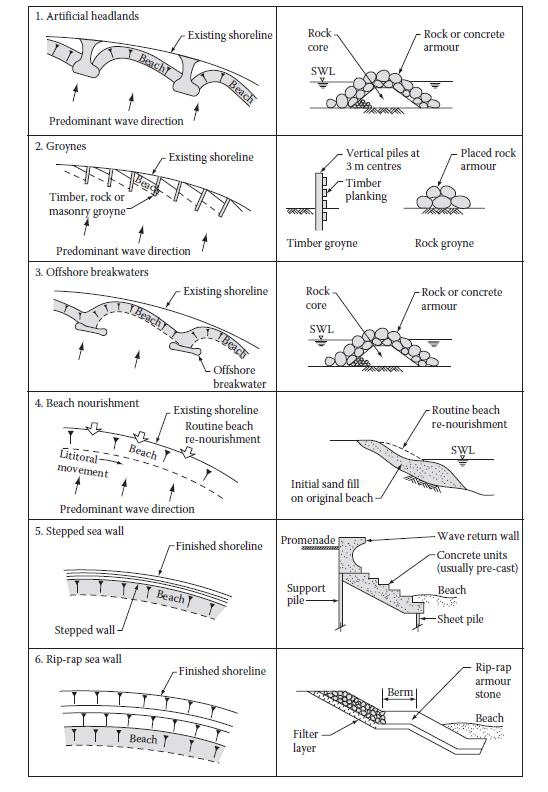
| 18:25, 7 February 2019 | TypesCoastalWorks.jpg (file) |  |
75 KB | Common types of coastal protection structures. | 1 |
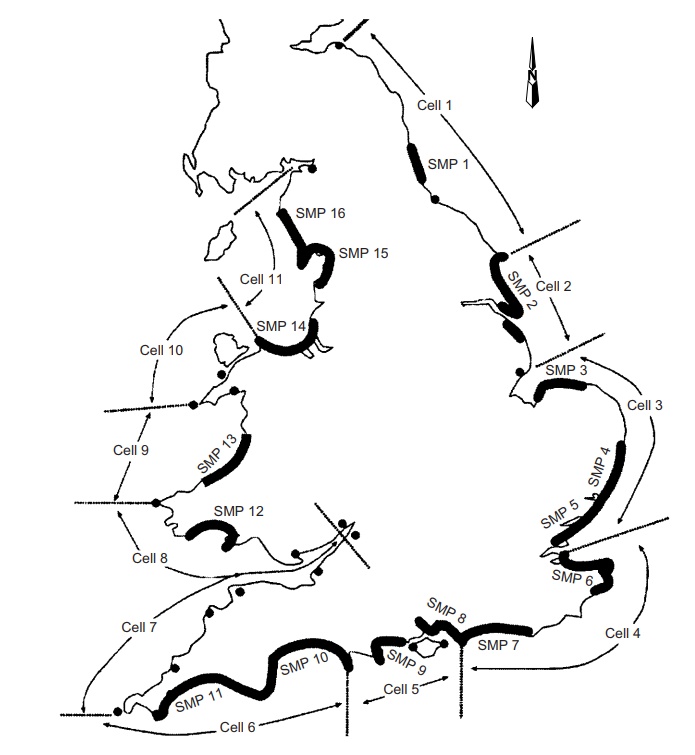
| 16:57, 5 February 2019 | UKcoastalcells.jpg (file) |  |
98 KB | Coastal sediment cells as defined for the coasts of England and Wales. | 1 |
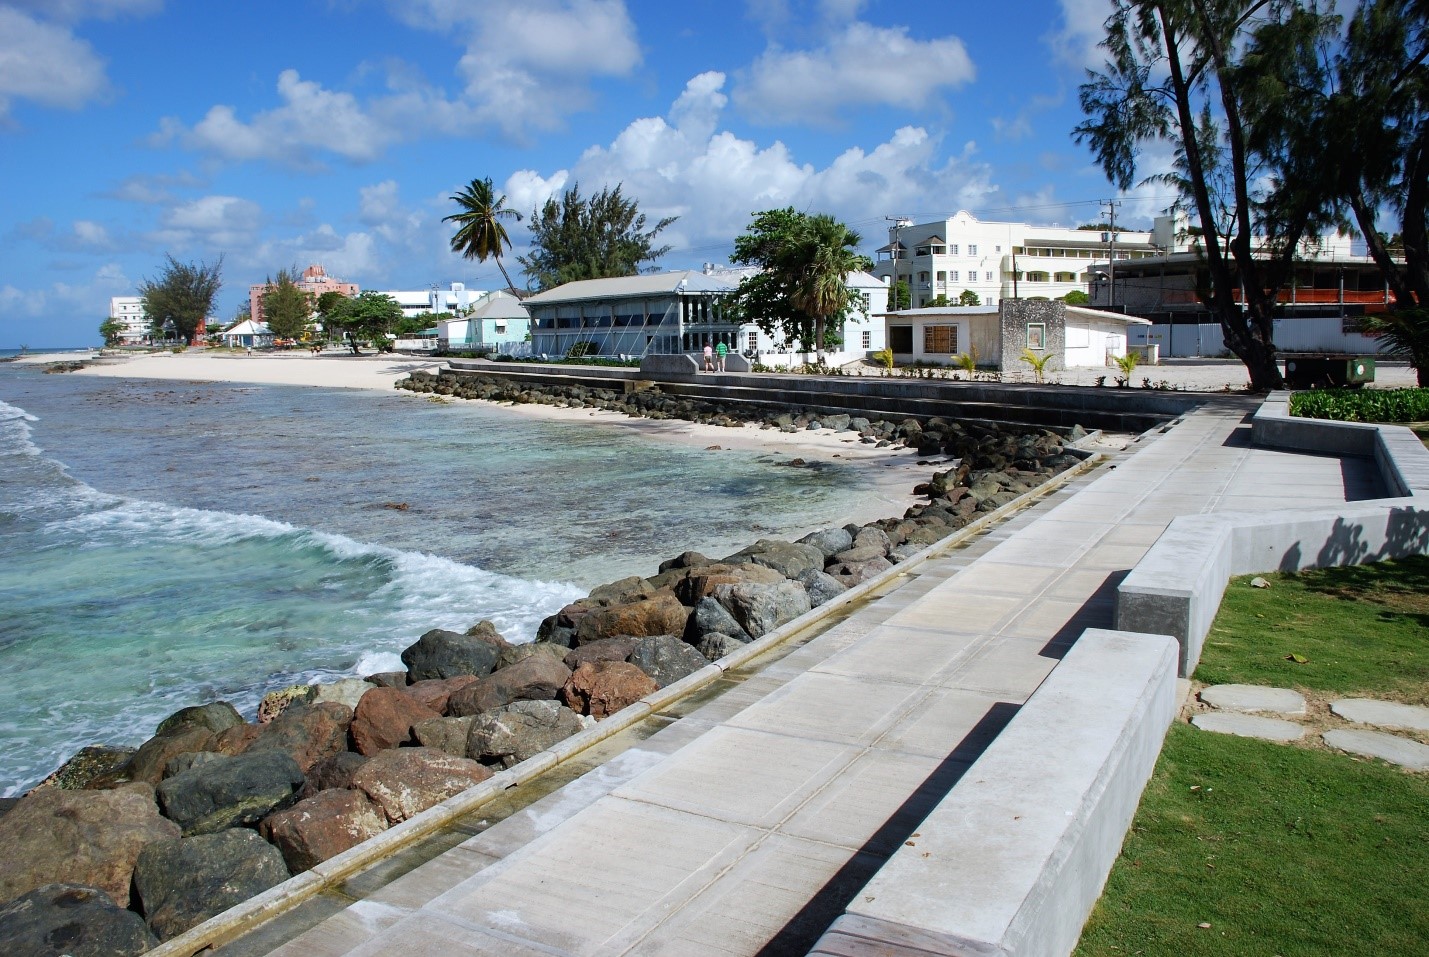
| 13:29, 5 February 2019 | BoardwalkBarbados.jpg (file) |  |
433 KB | View of the Boardwalk scheme in Barbados. | 1 |
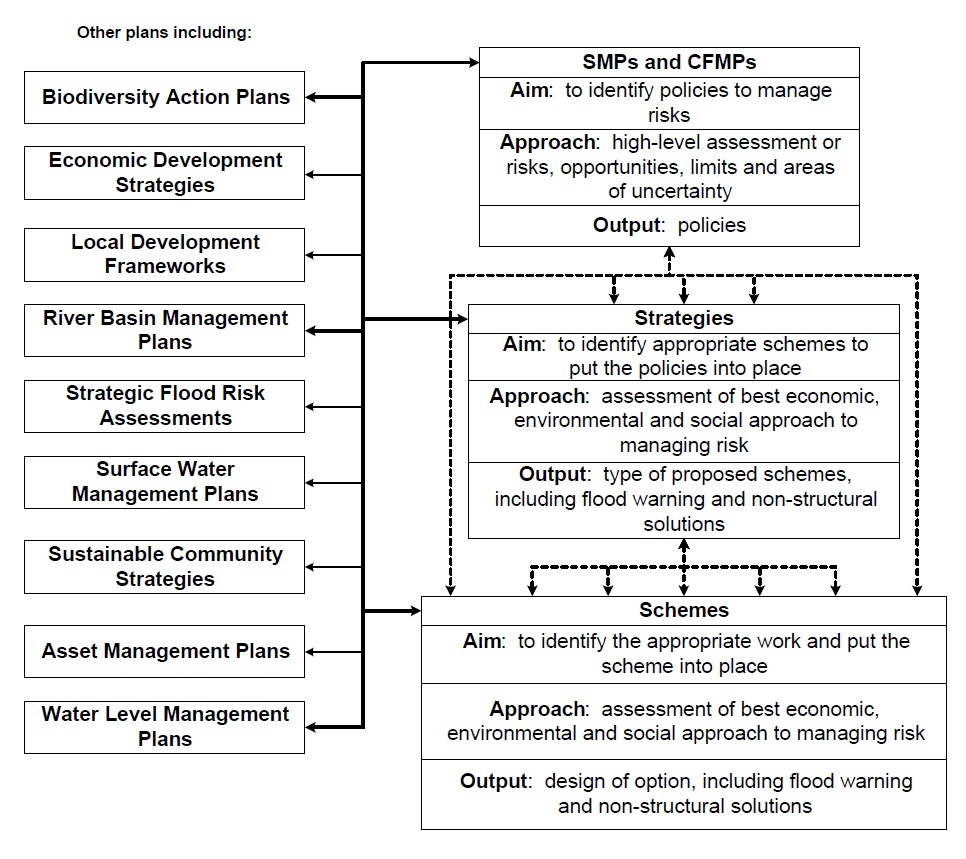
| 13:28, 5 February 2019 | SMPscheme.jpg (file) |  |
211 KB | Relationship between high level plans, strategies, schemes and other planning initiatives (Environmental Agency 2010) | 1 |
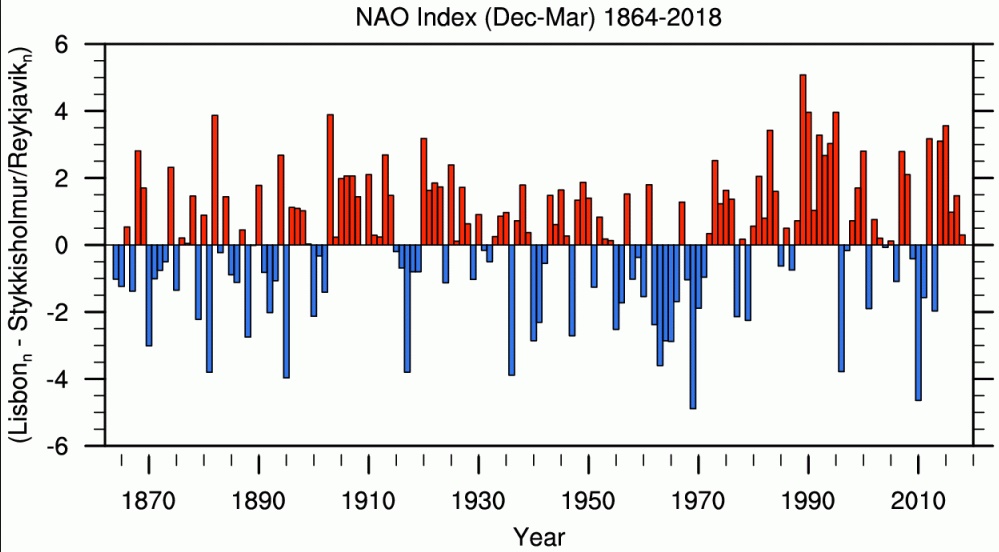
| 13:17, 10 December 2018 | NAO NCAR 2018.jpg (file) |  |
114 KB | The winter (December through March) index of the NAO based <ref> [https://climatedataguide.ucar.edu/climate-data/hurrell-north-atlantic-oscillation-nao-index-station-based NCAR Boulder, US]</ref>. | 1 |
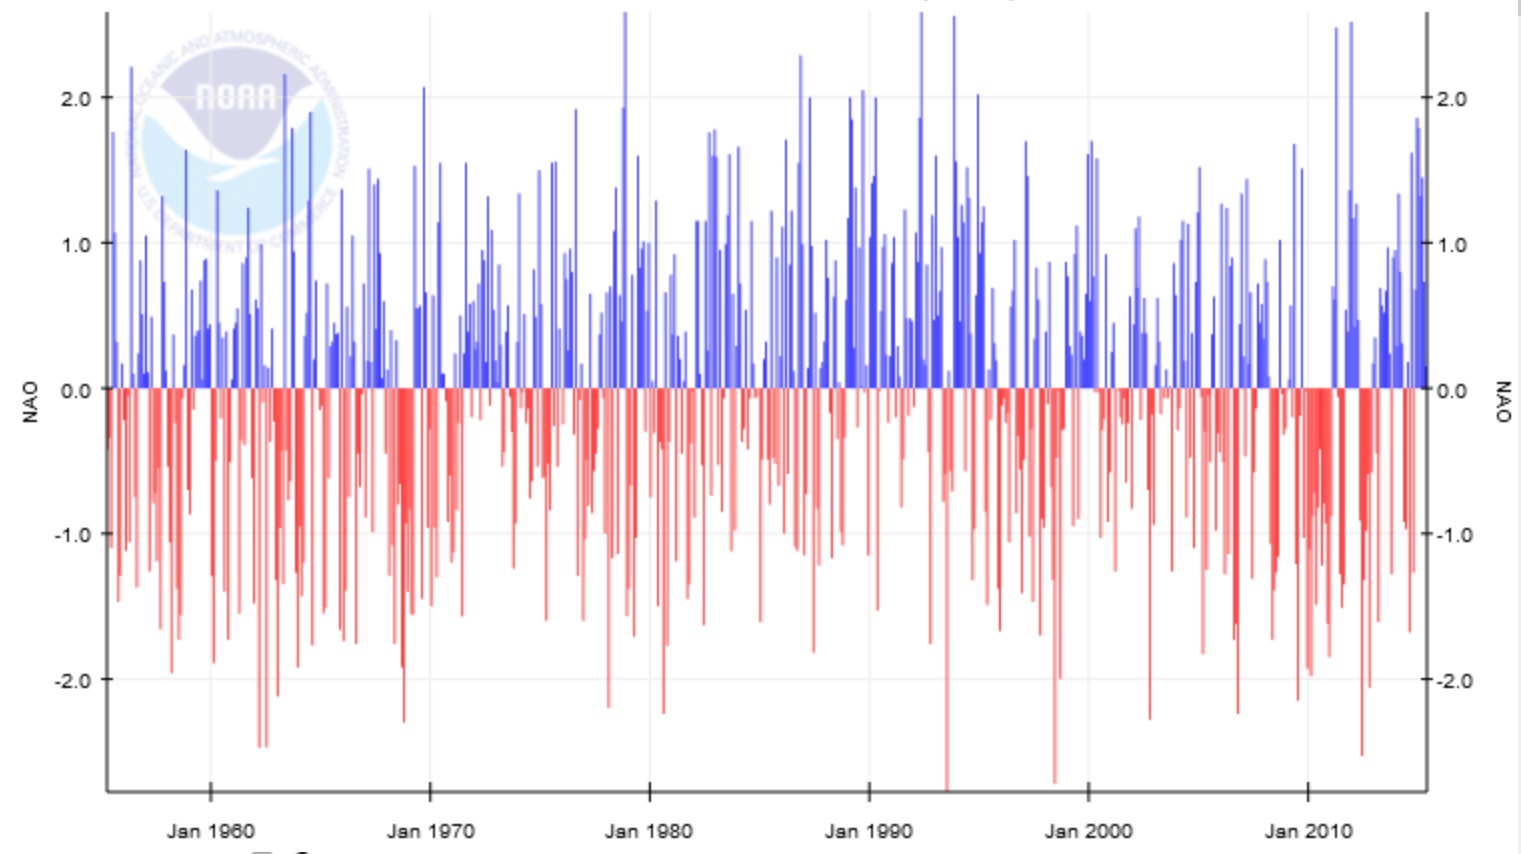
| 13:15, 10 December 2018 | NAO NOAA 2018.jpg (file) |  |
228 KB | Interseasonal variation of the NAO index <ref>[http://www.cpc.ncep.noaa.gov/data/teledoc/nao.shtml NOAA]</ref>. | 1 |
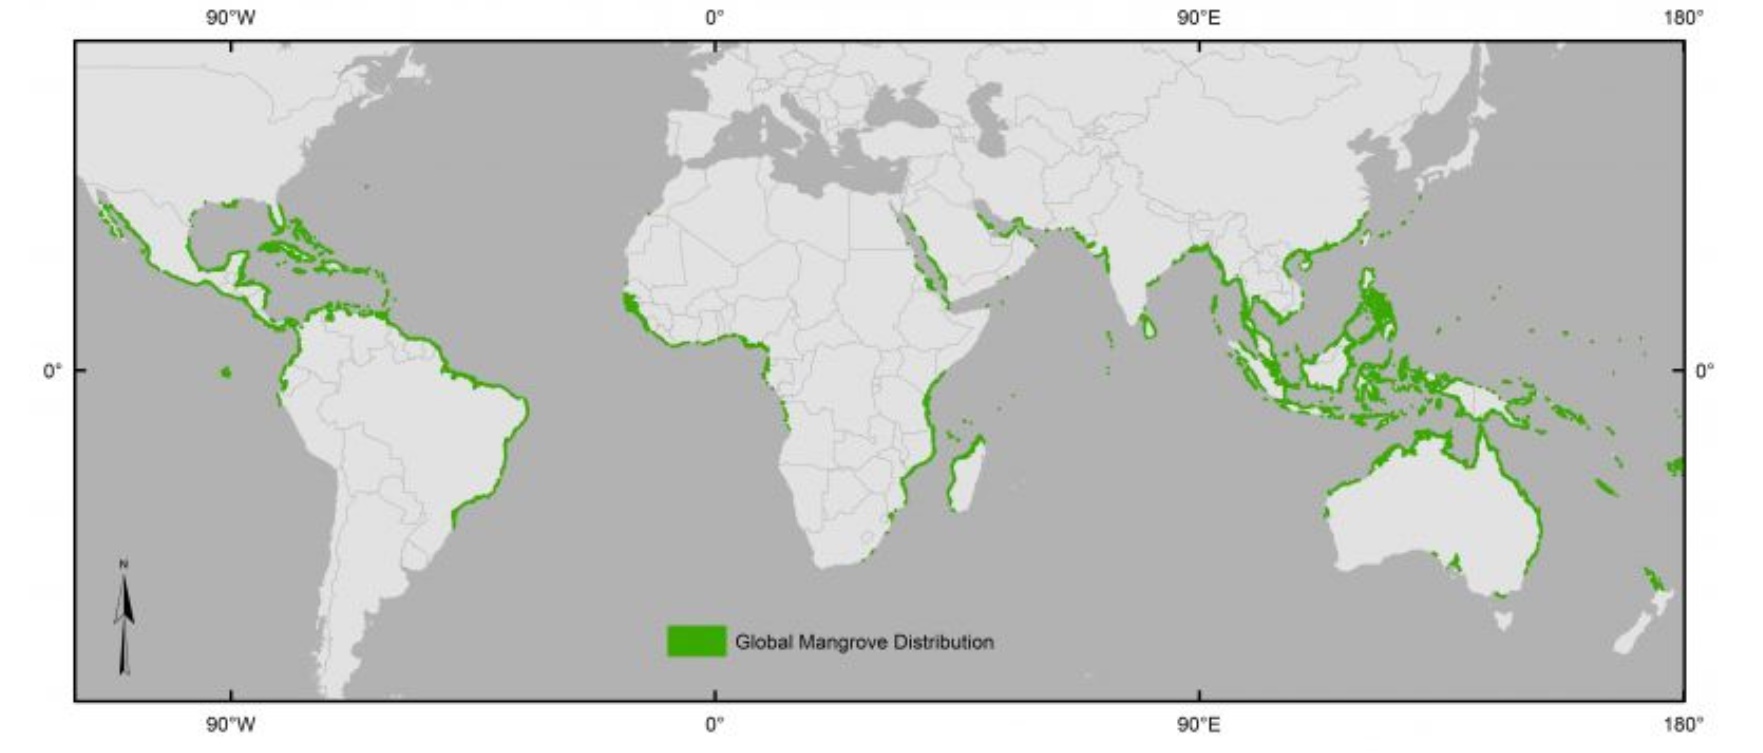
| 16:05, 9 December 2018 | MangroveWorldMap.jpg (file) |  |
145 KB | World distribution of mangroves | 1 |
| 22:49, 26 November 2018 | WesterscheldeSentinelMarch2016.jpg (file) |  |
474 KB | Western Scheldt and Scheldt estuary, Netherlands, Belgium (Sentinel image). | 1 |
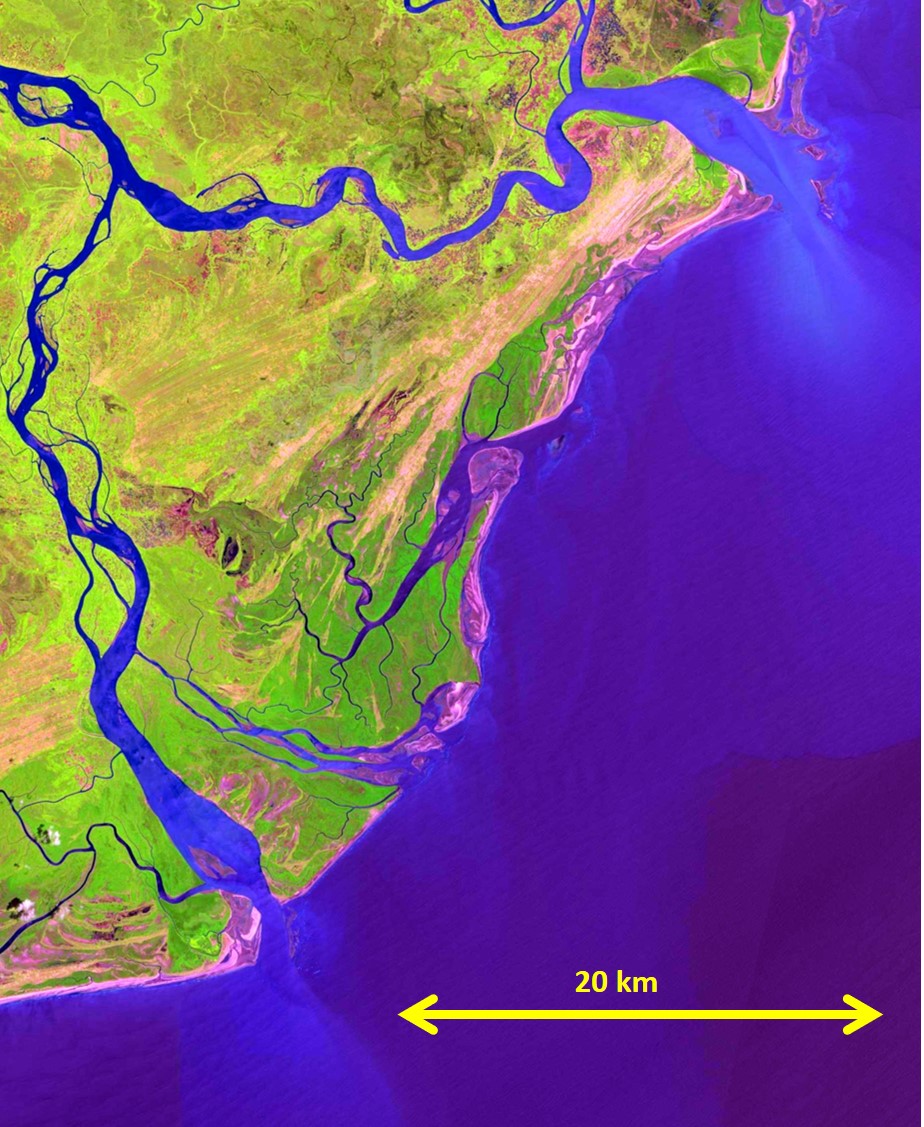
| 22:48, 26 November 2018 | ZambeziSentinelJan2017.jpg (file) |  |
277 KB | Zambezi River Delta on the Indian Ocean, Mozambique (Sentinel image). | 1 |
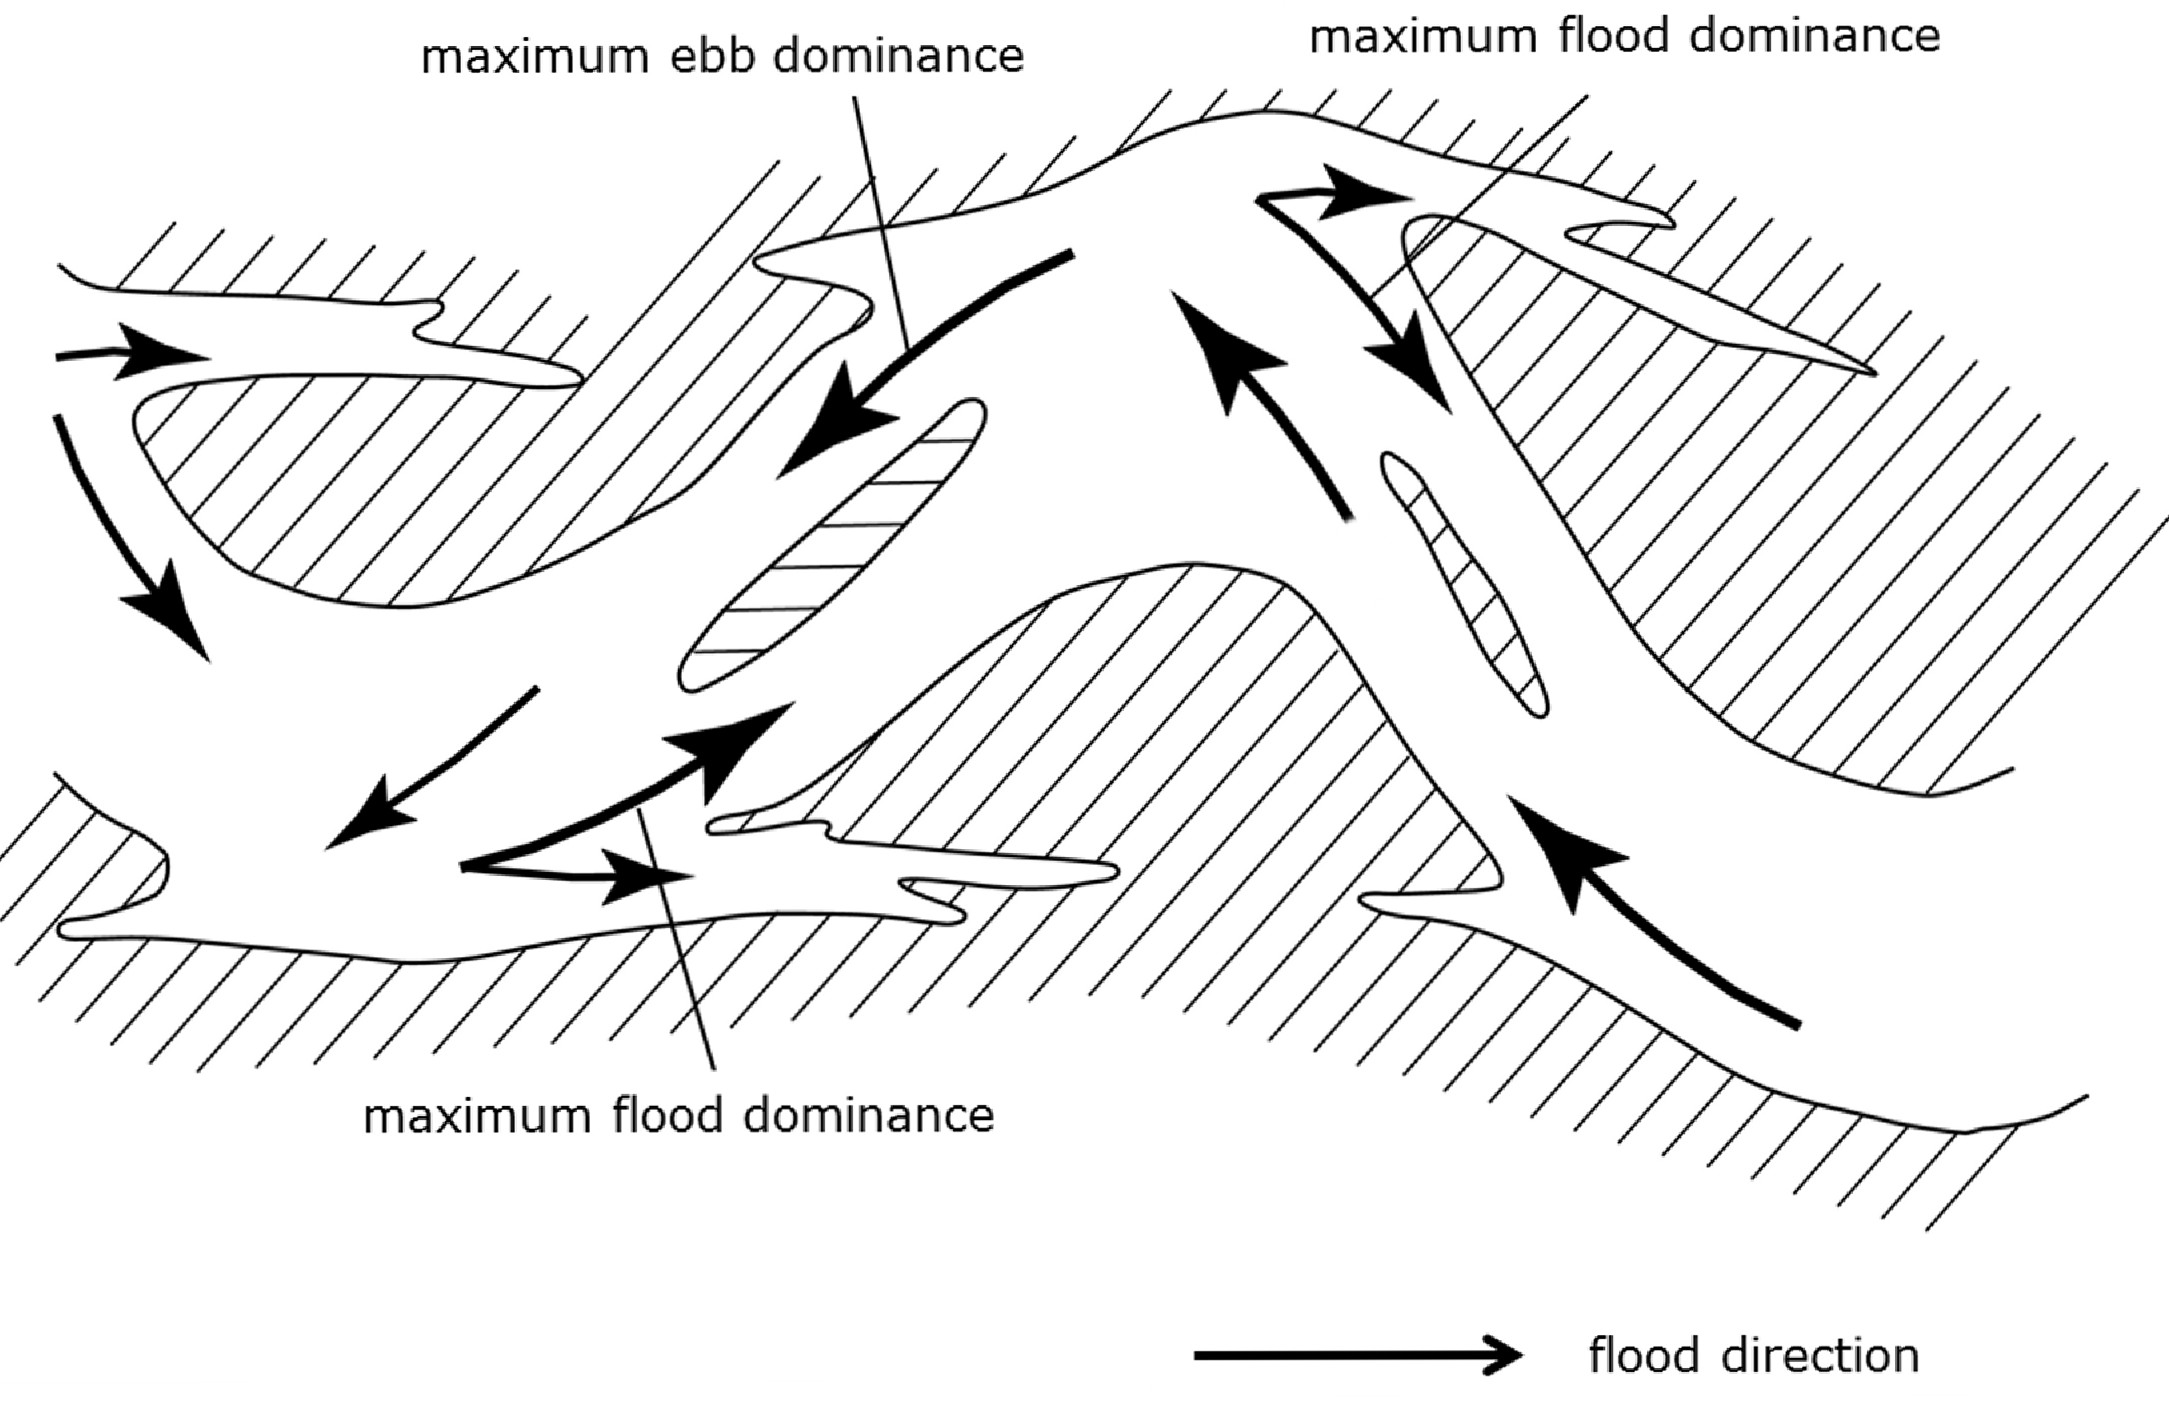
| 14:13, 26 November 2018 | EbbFloodMeander.jpg (file) |  |
312 KB | Schematic picture of flood and ebb dominant flow channels in a meandering channel system. | 1 |
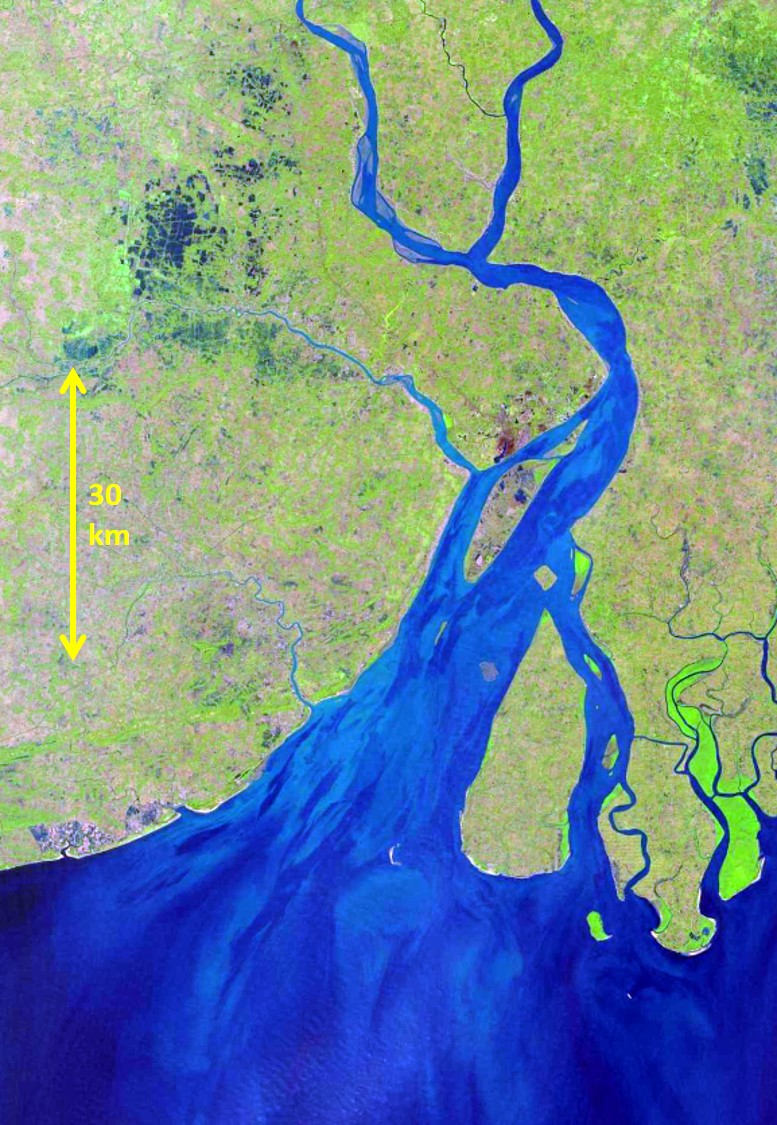
| 22:25, 25 November 2018 | HooghlySentinelJanuary2018.jpg (file) |  |
273 KB | Hooghly estuary, Bay of Bengal, India (Sentinel image). | 1 |
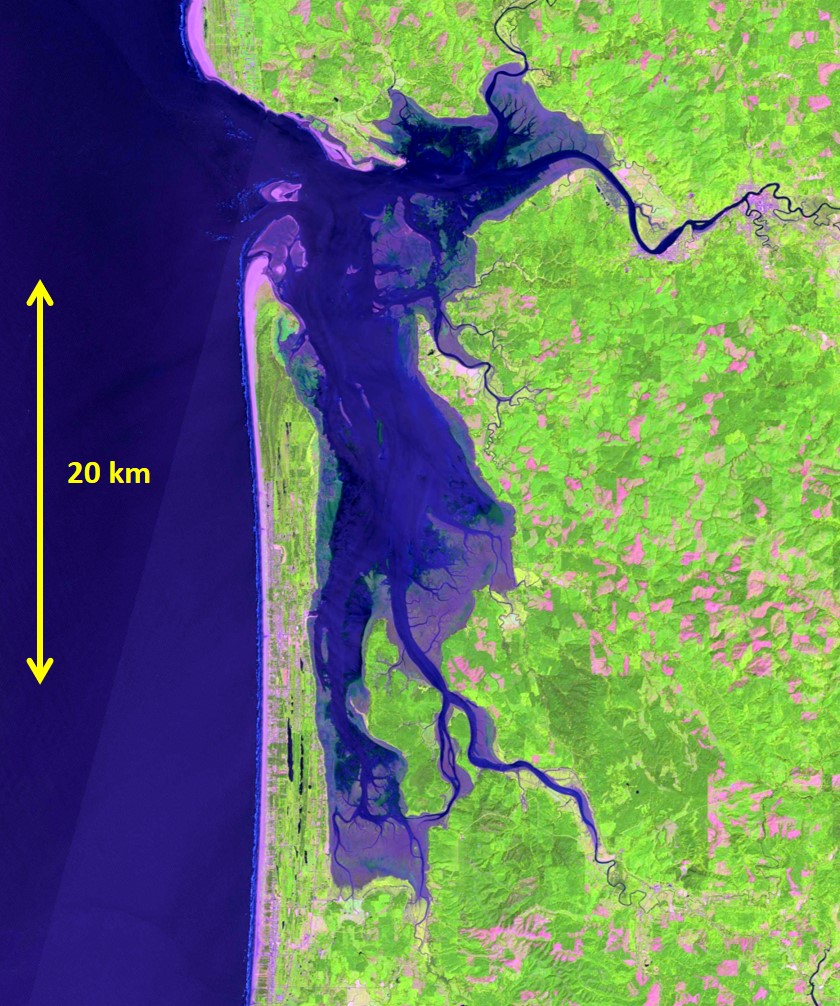
| 21:44, 25 November 2018 | WillapaBaySentinelJuly2018.jpg (file) |  |
261 KB | Willapa Bay on the US Pacific coast (Sentinel image). | 1 |
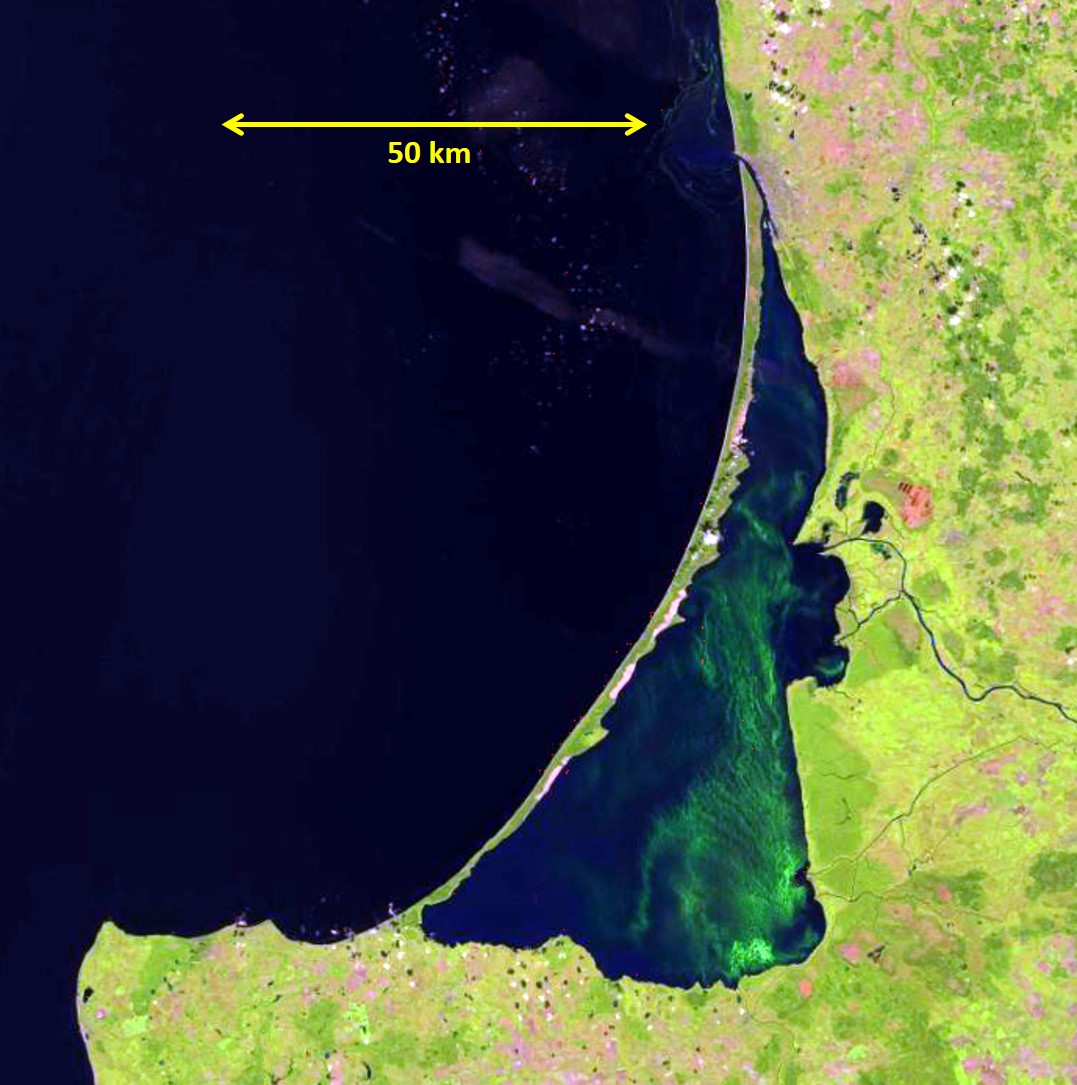
| 21:07, 25 November 2018 | CoronianLagoonSentinelSep2018.jpg (file) |  |
180 KB | Curonian Lagoon, Baltic Sea coast(Sentinel image 10 September 2018) | 1 |
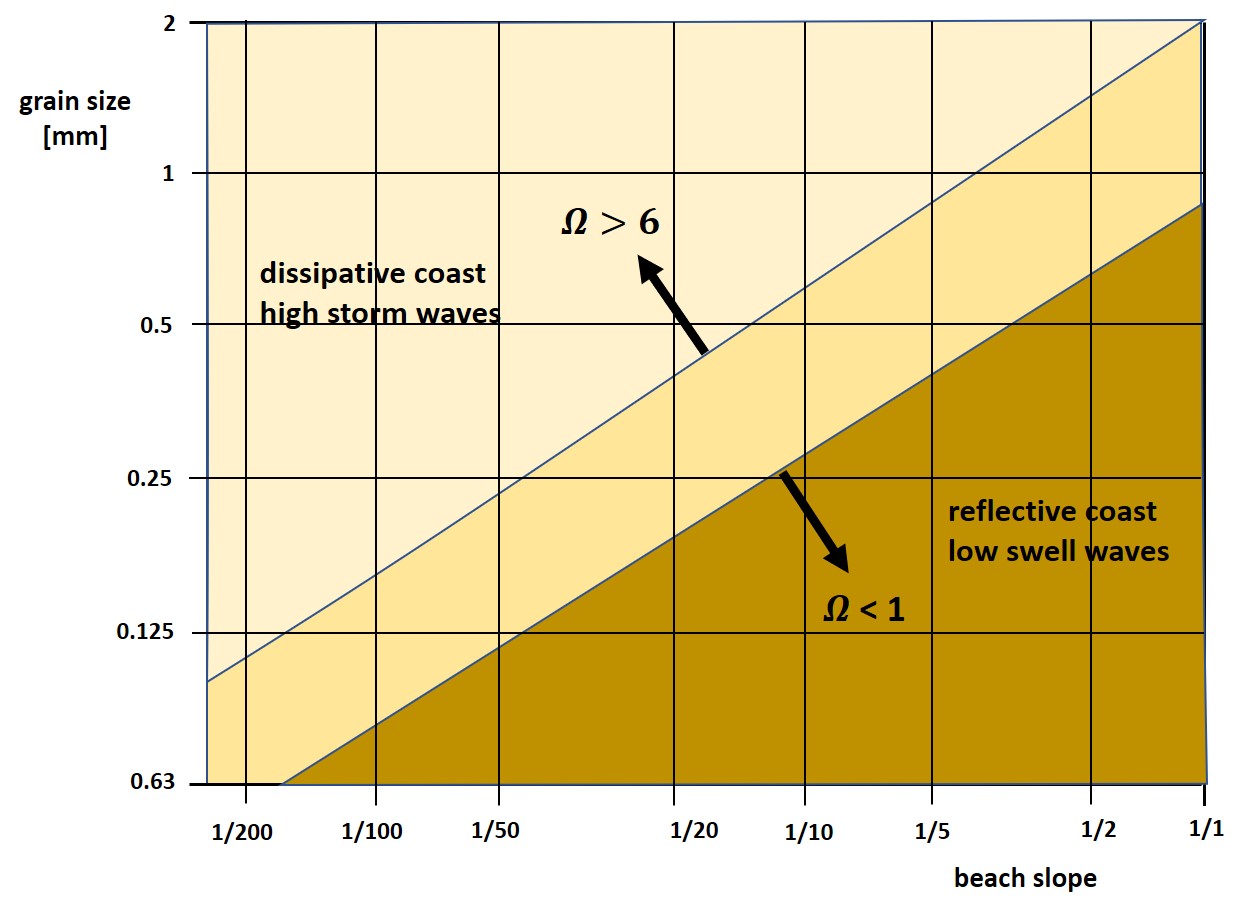
| 14:06, 18 November 2018 | GrainsizeBeachslope.jpg (file) |  |
120 KB | Relation between fall velocity (sediment type) and beach slope as a function of the Dean parameter. | 1 |
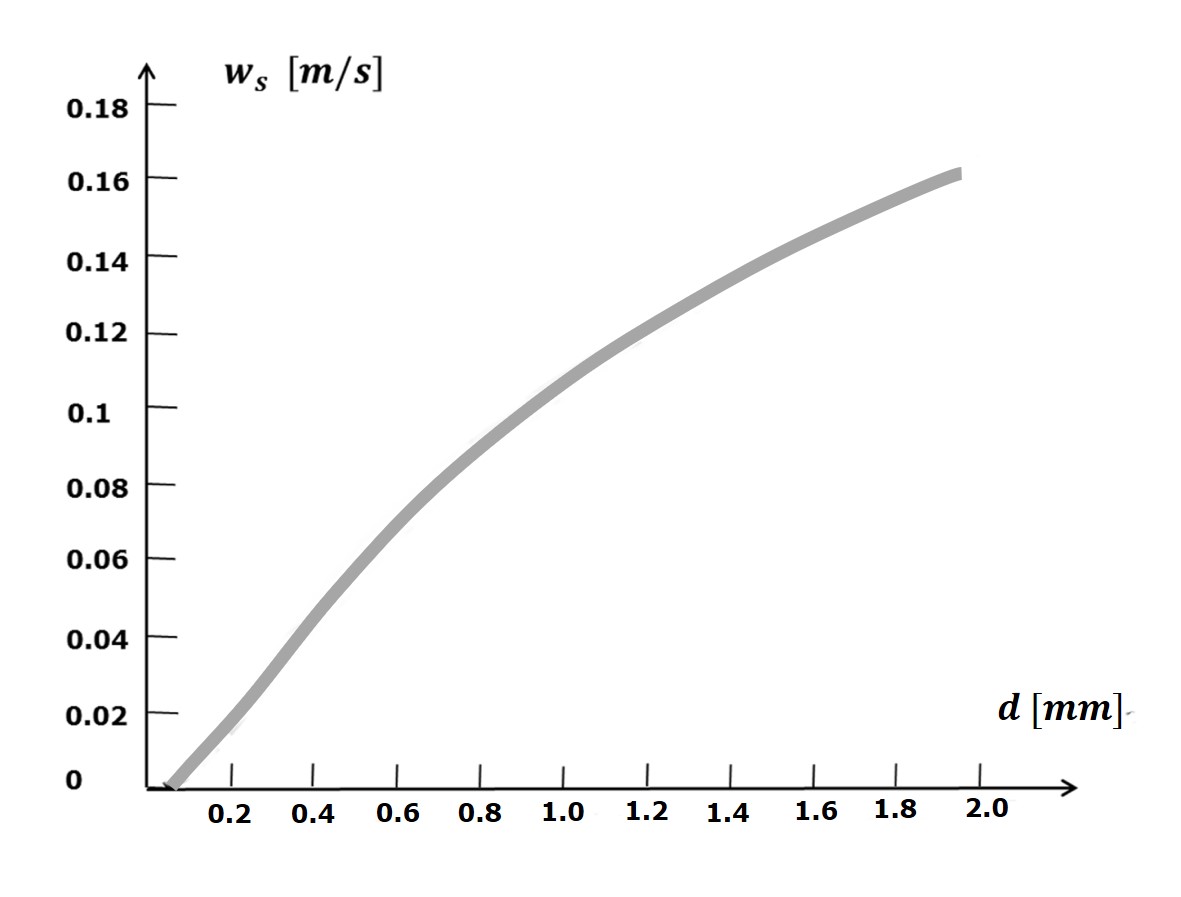
| 01:00, 18 November 2018 | FallVelocityQuartz.jpg (file) |  |
53 KB | Fall velocity of glass spheres of different sizes in still water. | 2 |
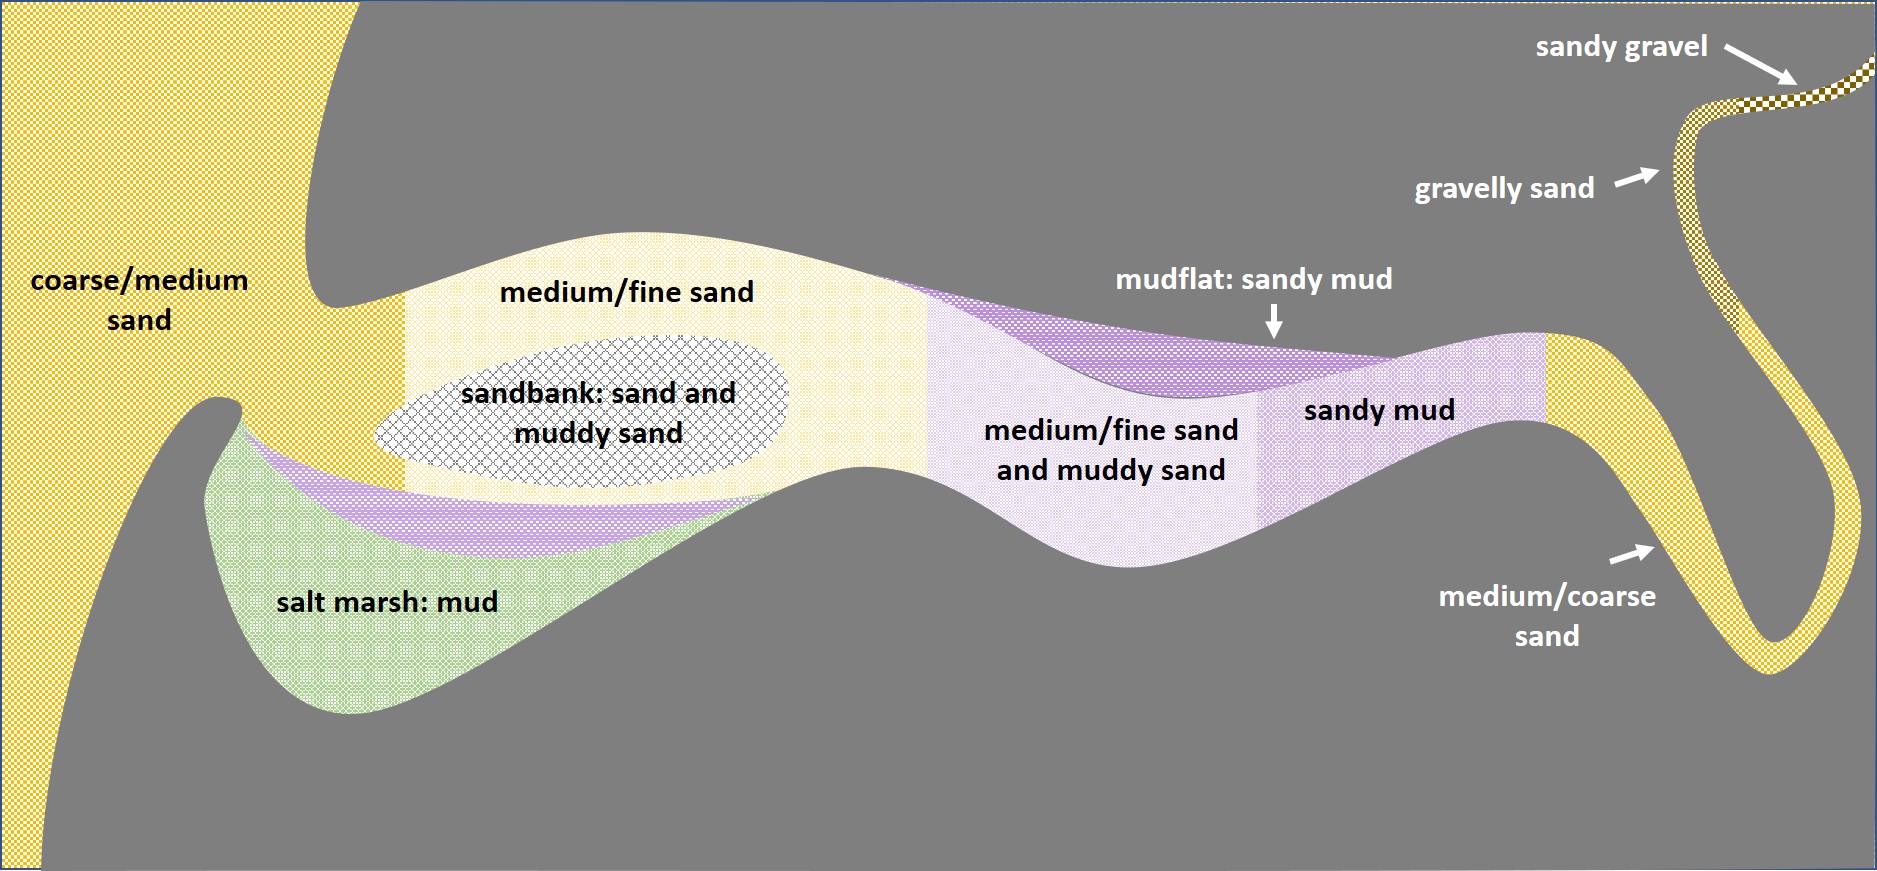
| 00:42, 18 November 2018 | EstuarineBedSedimentDistribution.jpg (file) |  |
383 KB | Typical example of the spatial distribution of bed sediments in a coastal plain estuary, schematically represented. | 1 |
| 00:40, 18 November 2018 | SedimentMixtures.jpg (file) |  |
102 KB | Classification of different types of graded sediment beds. | 1 |
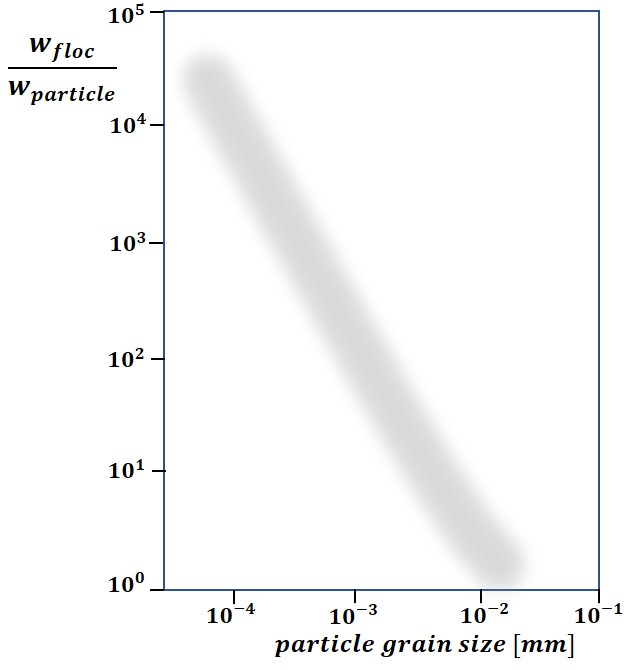
| 00:39, 18 November 2018 | FlocRelativeFallVelocity.jpg (file) |  |
31 KB | The ratio of floc fall velocity and fall velocity of the constituent particles. | 1 |
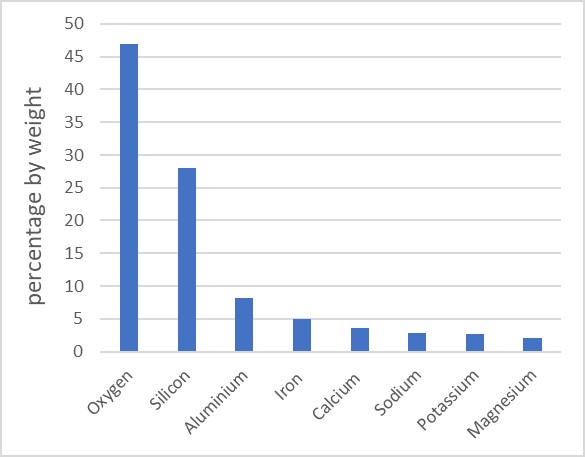
| 12:04, 14 November 2018 | ElementsLithosphere.jpg (file) |  |
34 KB | Composition by weight of chemical elements in the lithosphere. | 1 |
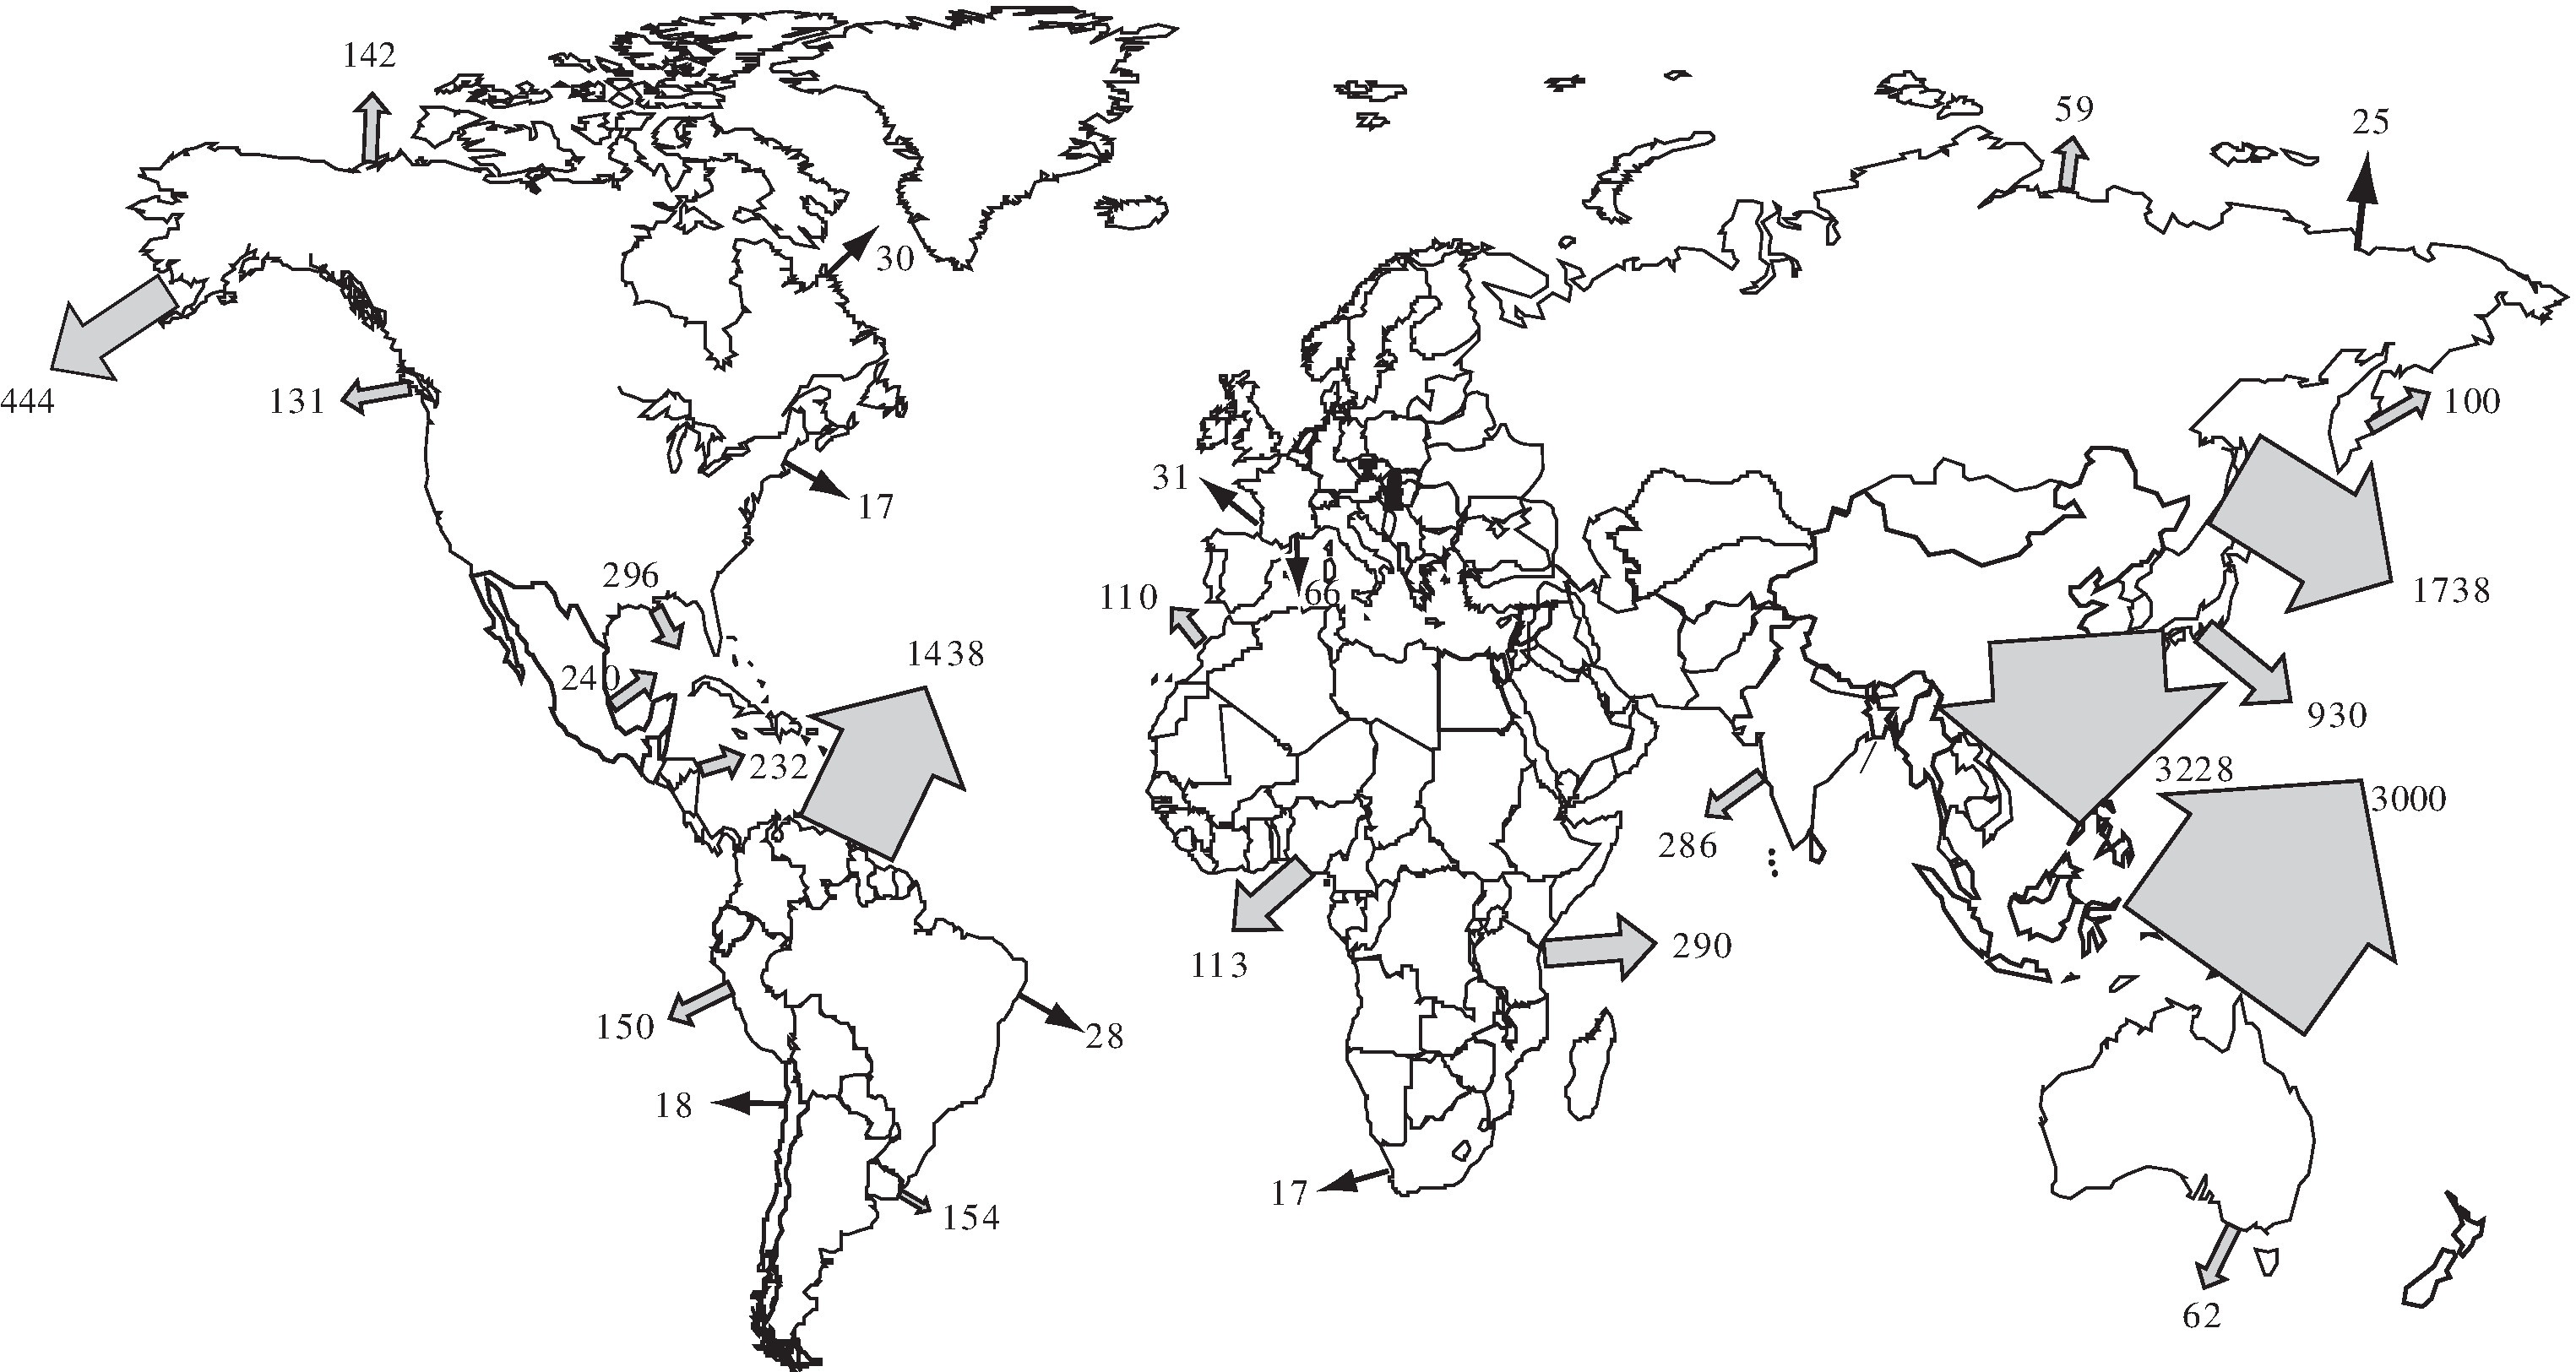
| 12:03, 14 November 2018 | Worlderosion.jpg (file) |  |
543 KB | Annual discharge of sediments from world's catchment basins. Redrawn after Milliman and Meade (1983). | 1 |
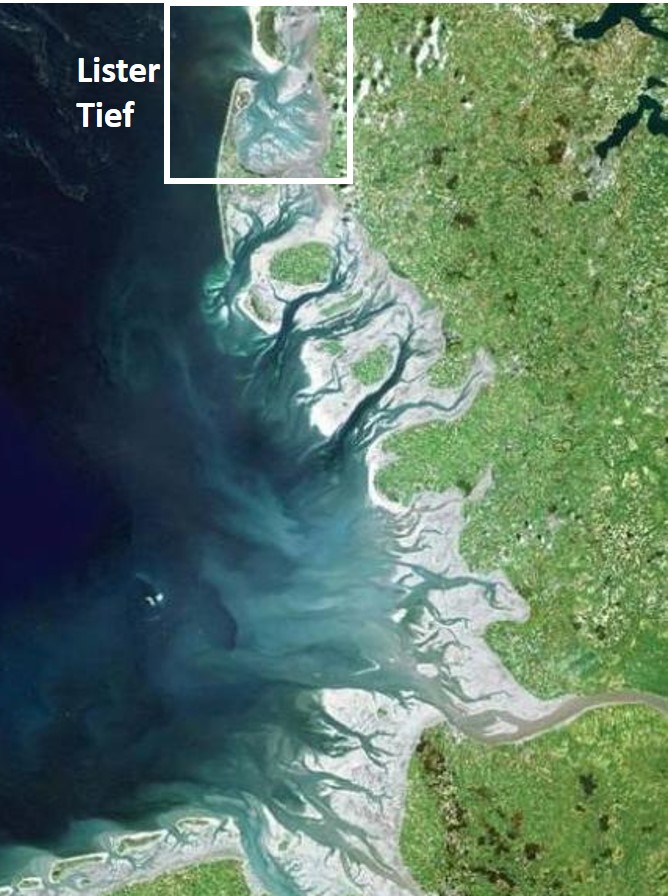
| 16:55, 10 November 2018 | ListerTief.jpg (file) |  |
141 KB | Lister Tief in the German Wadden Sea. | 1 |
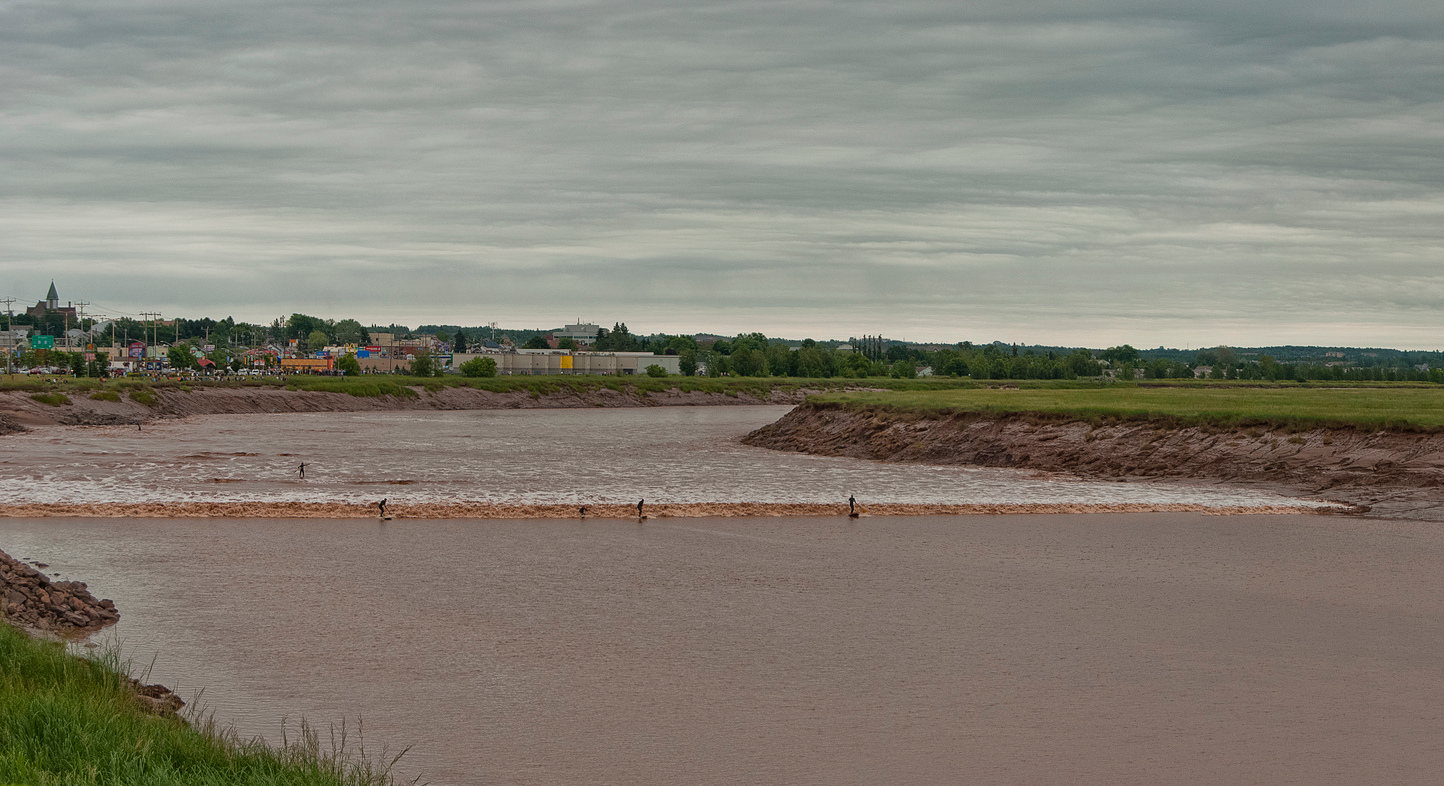
| 15:41, 29 September 2018 | TidalBorePetitcodiacRiver.jpg (file) |  |
521 KB | Tidal bore in the Petitcodiac River (Bay of Fundy, Canada) | 1 |
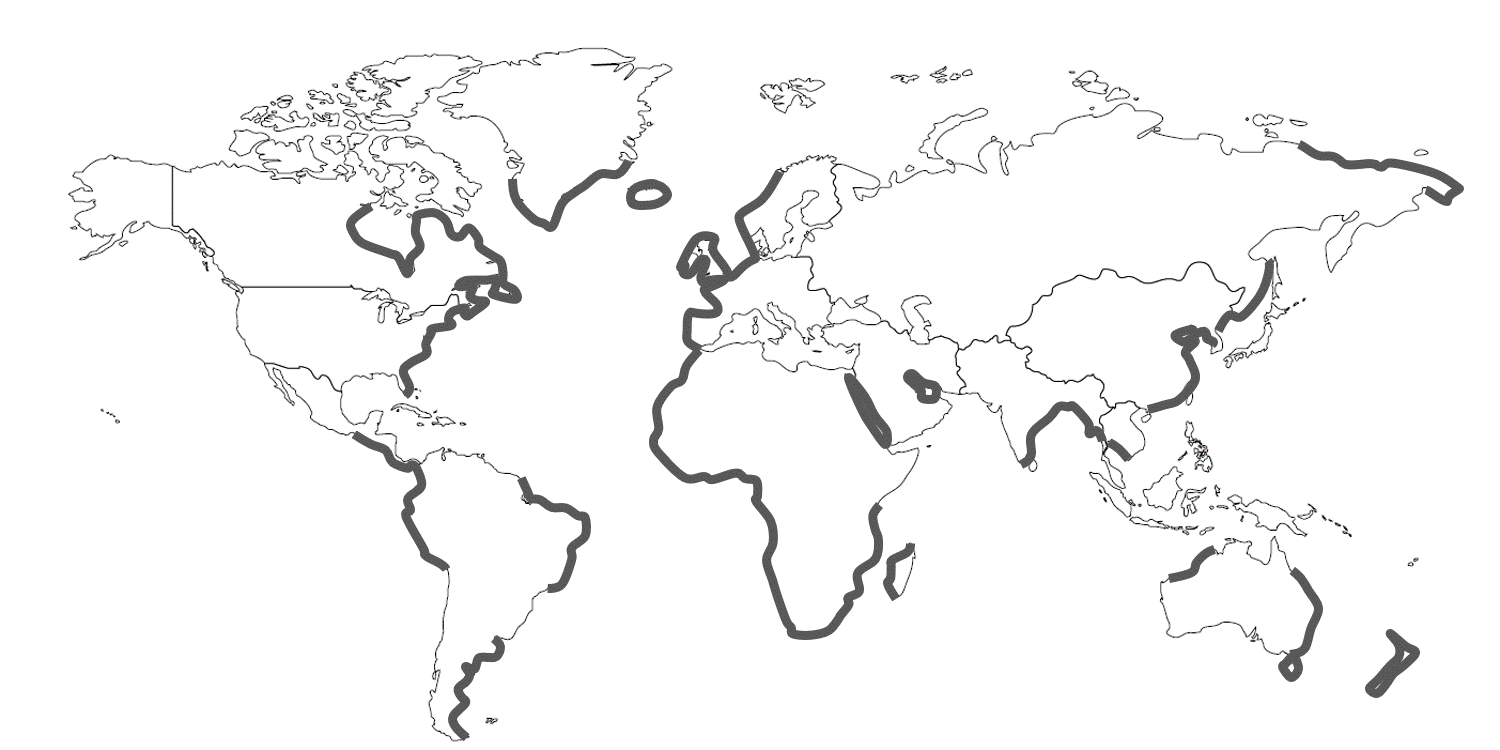
| 14:32, 28 September 2018 | WorldmapM4.png (file) |  |
150 KB | Coastal zones with important quarter-diurnal tide. | 1 |
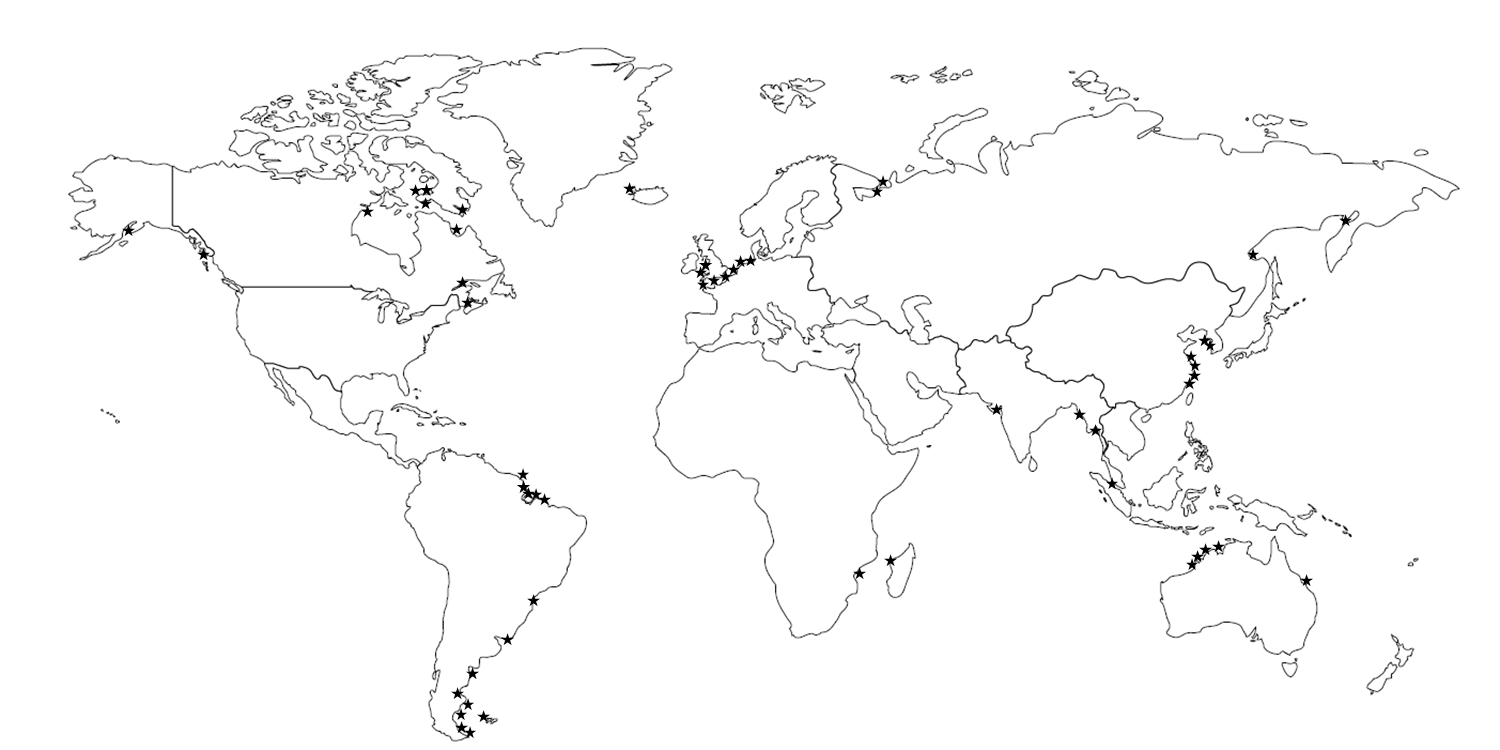
| 16:54, 26 September 2018 | WorldDomM2.png (file) |  |
76 KB | Coastal zones with dominant semi-diurnal tide. | 1 |
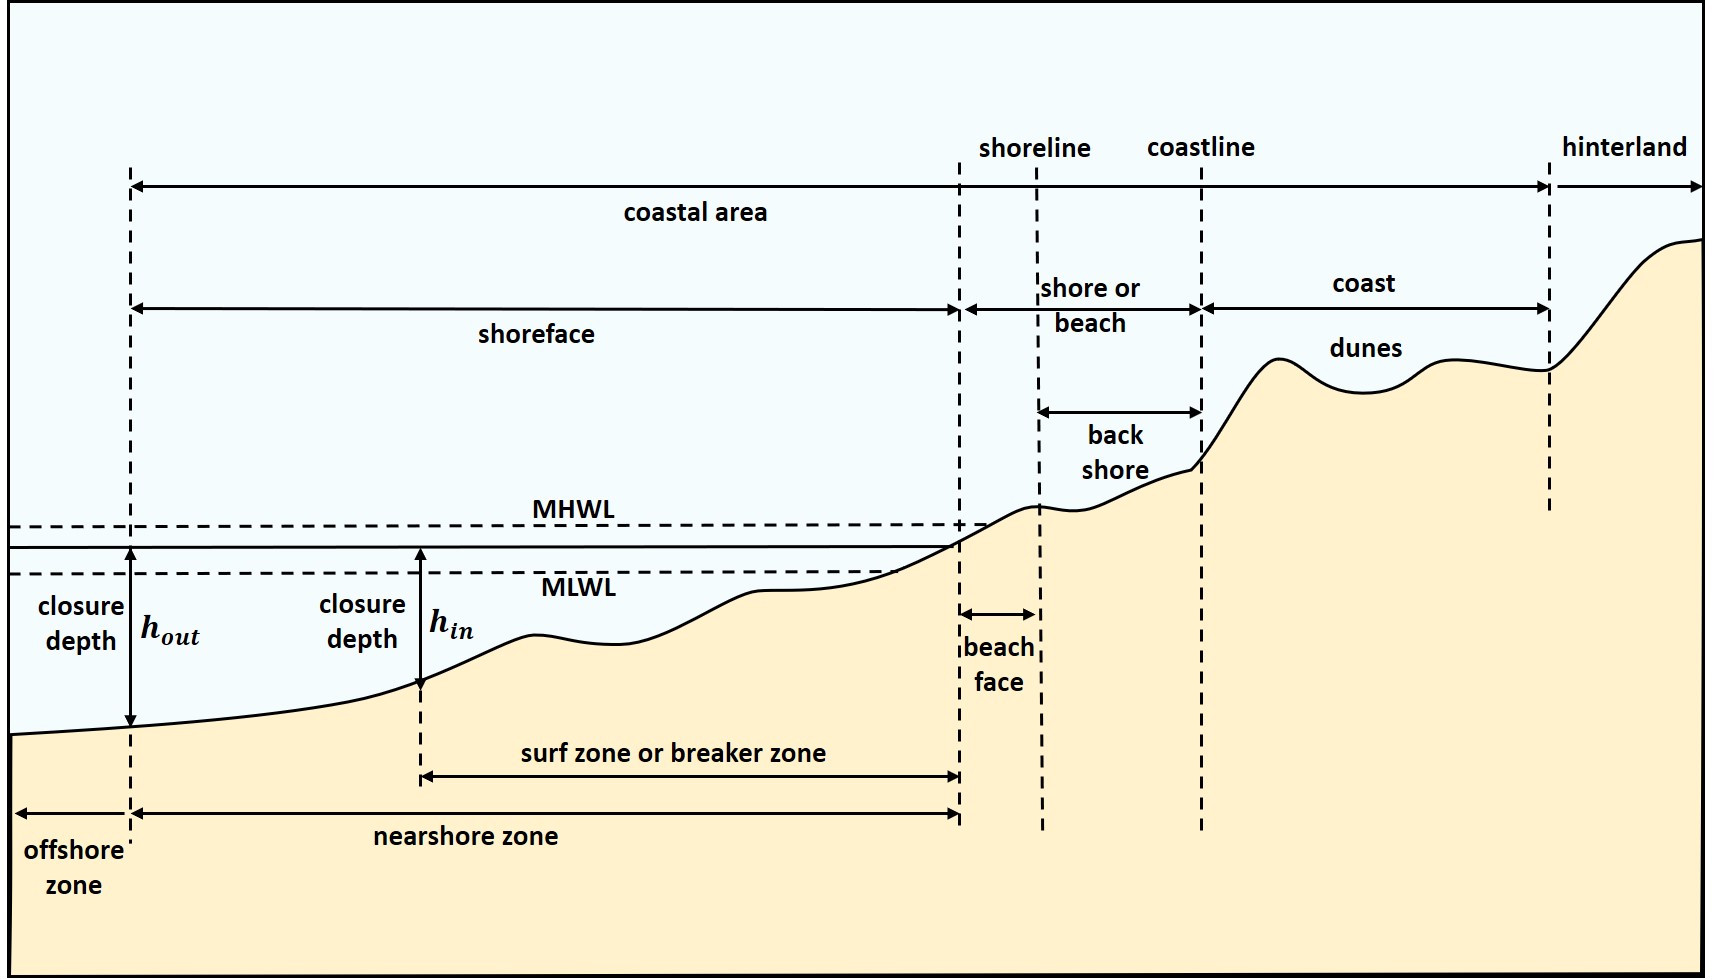
| 17:02, 25 September 2018 | DefinitionsCoastalTerms.jpg (file) |  |
150 KB | Definition of coastal terms, adapted from Shore Protection Manual, 1984.<ref>Coastal engineering Research Center, Department of the Army, Waterways Experiment Station, 1984. "Shore protection manual".</ref> | 1 |
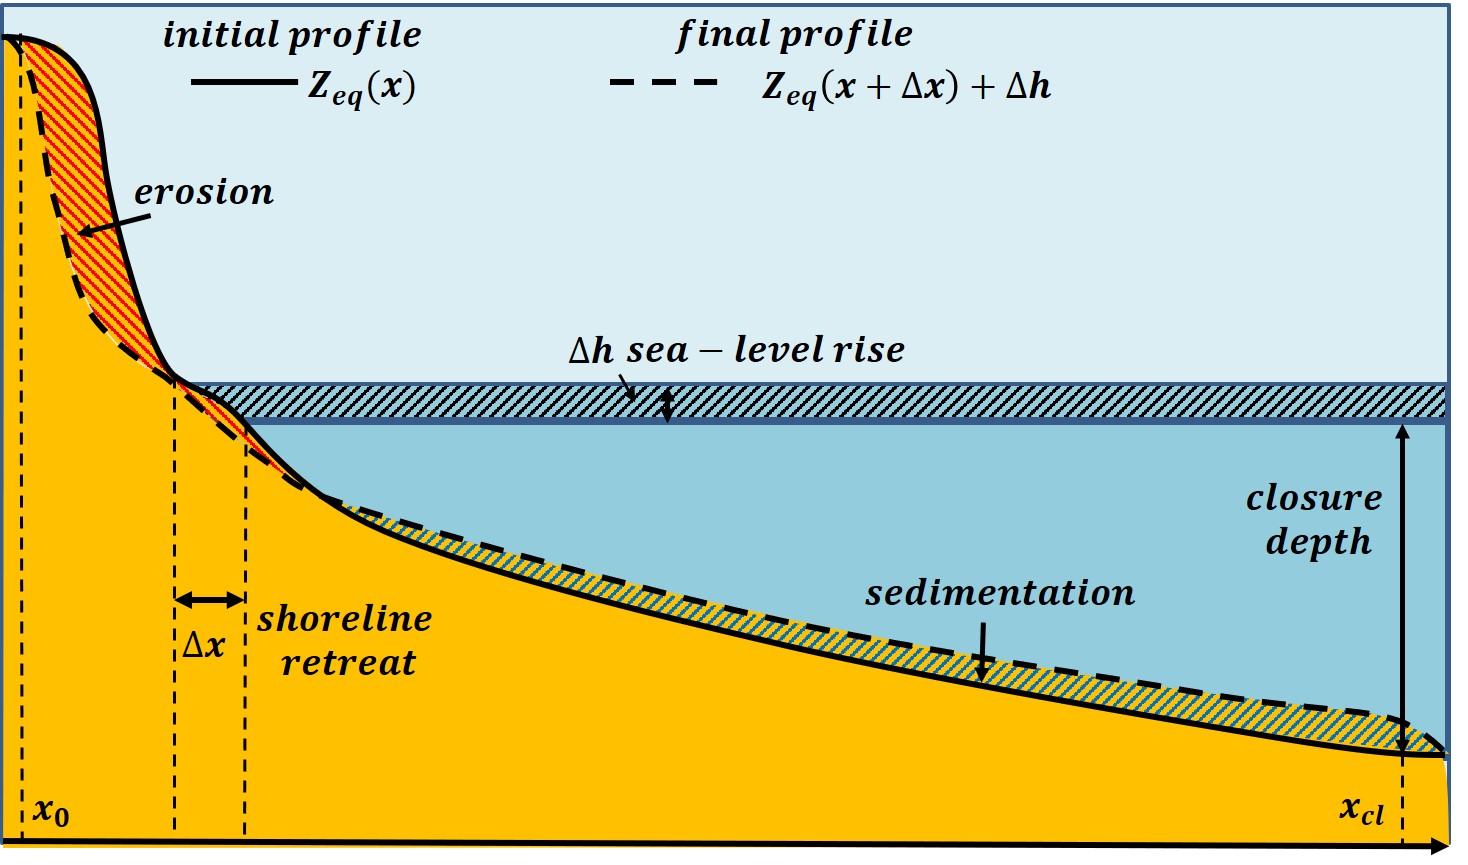
| 10:03, 21 September 2018 | BruunRule.jpg (file) |  |
199 KB | Schematic representation of the shoreface shift in response to sea-level rise. The shaded eroded and deposited volumes are equal. | 1 |