File list
This special page shows all uploaded files.
| Date | Name | Thumbnail | Size | User | Description | Versions |
|---|---|---|---|---|---|---|
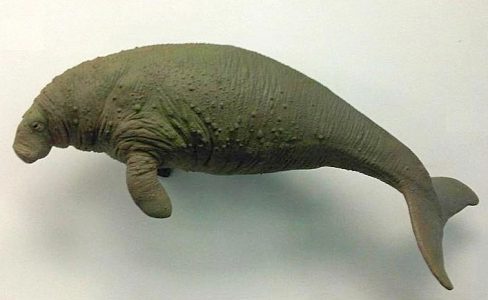
| 21:03, 16 December 2020 | StellersSeaCow.jpg (file) |  |
20 KB | Dronkers J | Steller's sea cow. Photo credit Emoke Denes. | 1 |
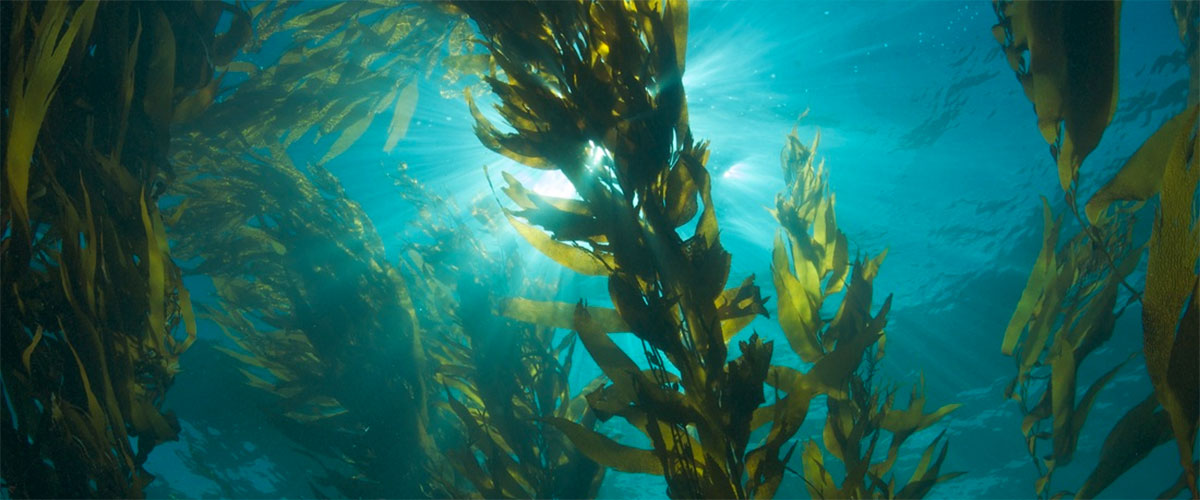
| 21:02, 16 December 2020 | KelpForest.jpg (file) |  |
121 KB | Dronkers J | Kelp forest. Photo credit NOAA | 1 |
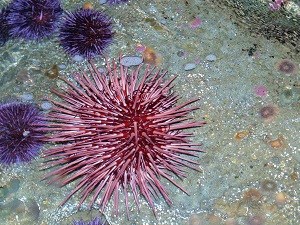
| 21:01, 16 December 2020 | SeaUrchin.jpg (file) |  |
39 KB | Dronkers J | Sea urchin. Photo credit US National Park Service. | 1 |
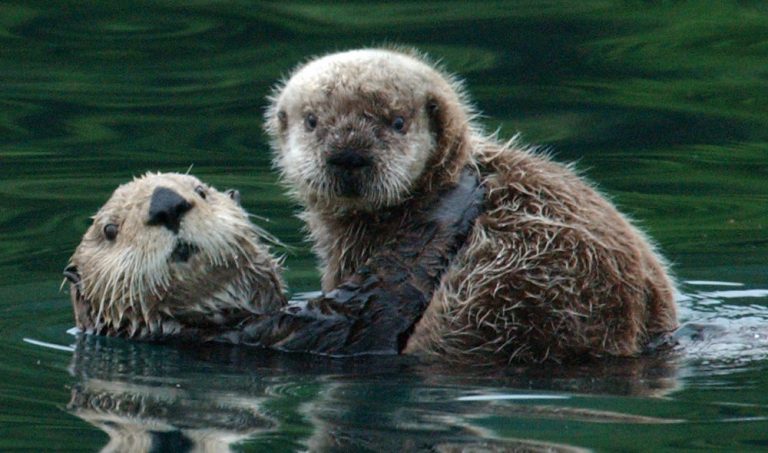
| 21:01, 16 December 2020 | SeaOtter.jpg (file) |  |
68 KB | Dronkers J | Sea otter. Photo credit US Fish and Wildlife. | 1 |
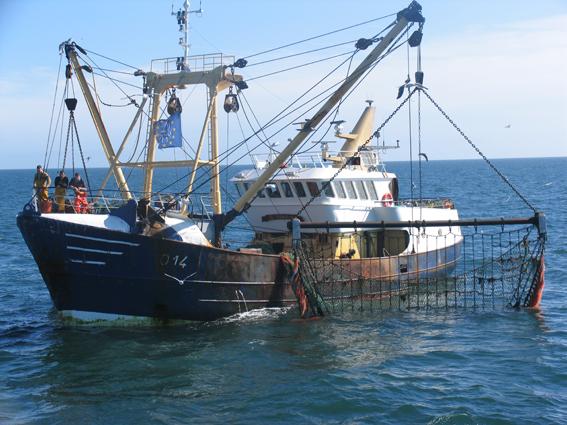
| 21:22, 7 December 2020 | BeamTrawler.jpg (file) |  |
47 KB | Dronkers J | Beam trawler. Photo credit Flanders Government. | 1 |
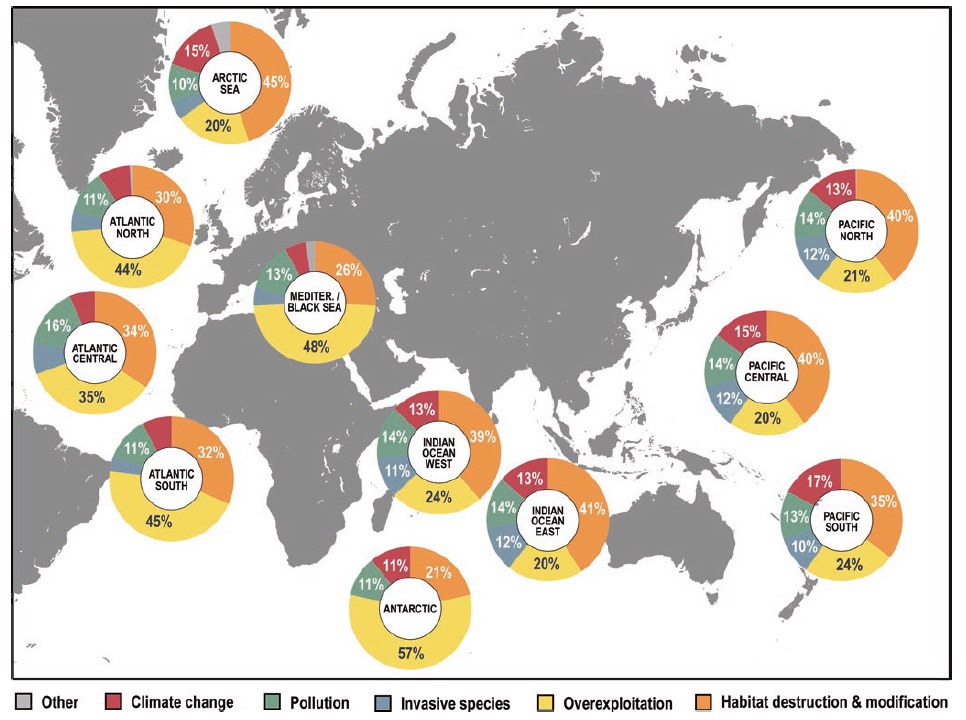
| 12:28, 7 December 2020 | CausesSpeciesLossMap.jpg (file) |  |
190 KB | Dronkers J | Causes of species loss for different marine regions. From Luypert et al., 2020, Creative Commons licence. | 1 |
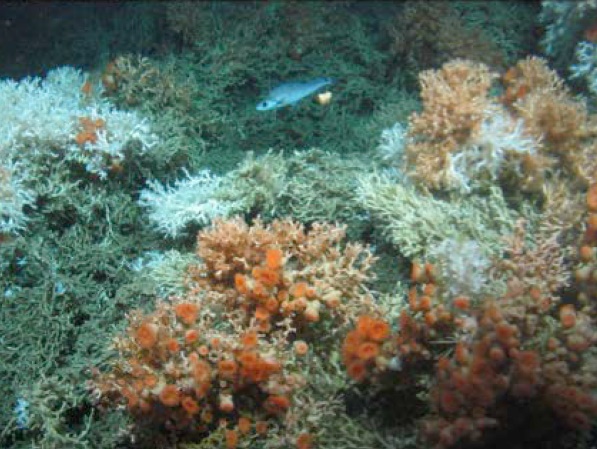
| 23:02, 4 December 2020 | LopheliaPertusa.jpg (file) |  |
123 KB | Dronkers J | ''Lophelia Pertusa''. Photo credit J.M.Roberts. | 1 |
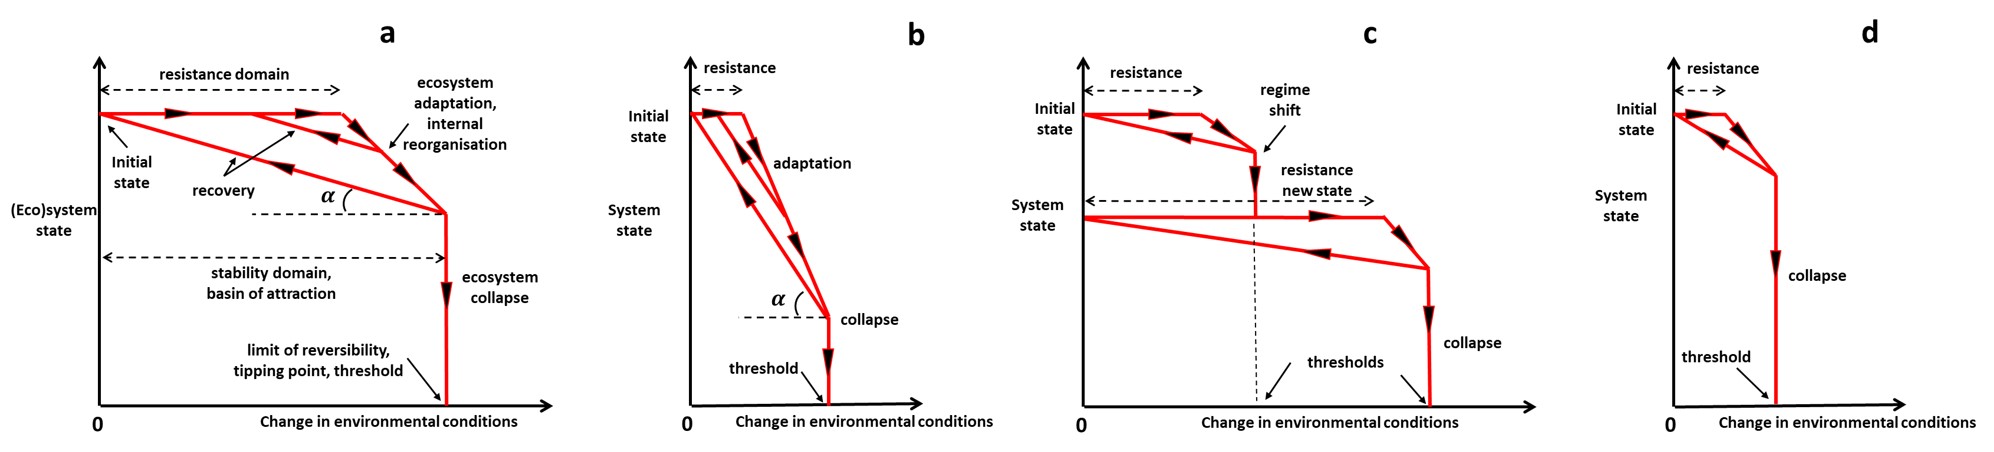
| 18:33, 28 November 2020 | ResilienceTrajectories.jpg (file) | 114 KB | Dronkers J | Schematic representation of the trajectories of a (socio-)ecological system in a plane defined by the system state (fundamental structure, processes, and functioning - vertical axis) and the change of environmental conditions (horizontal axis), for dif... | 2 | |
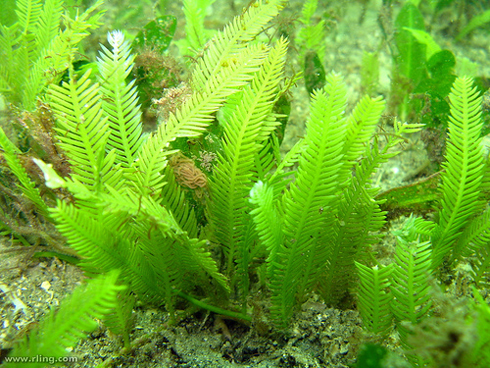
| 21:30, 26 November 2020 | CaulerpaTaxifolia.jpg (file) |  |
307 KB | Dronkers J | The invasive green algae, Caulerpa taxifolia. Photo credit Richard Ling | 1 |
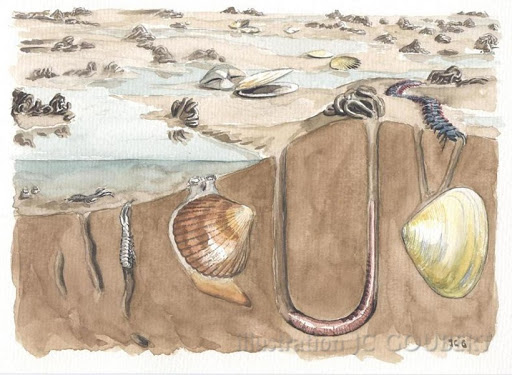
| 11:59, 24 November 2020 | FauneVasiere.jpg (file) |  |
59 KB | Dronkers J | Tidal flats are densely populated with organisms such as worms and bivalves that support the estuarine and marine food web. Illustration J-C. Goubert. | 1 |
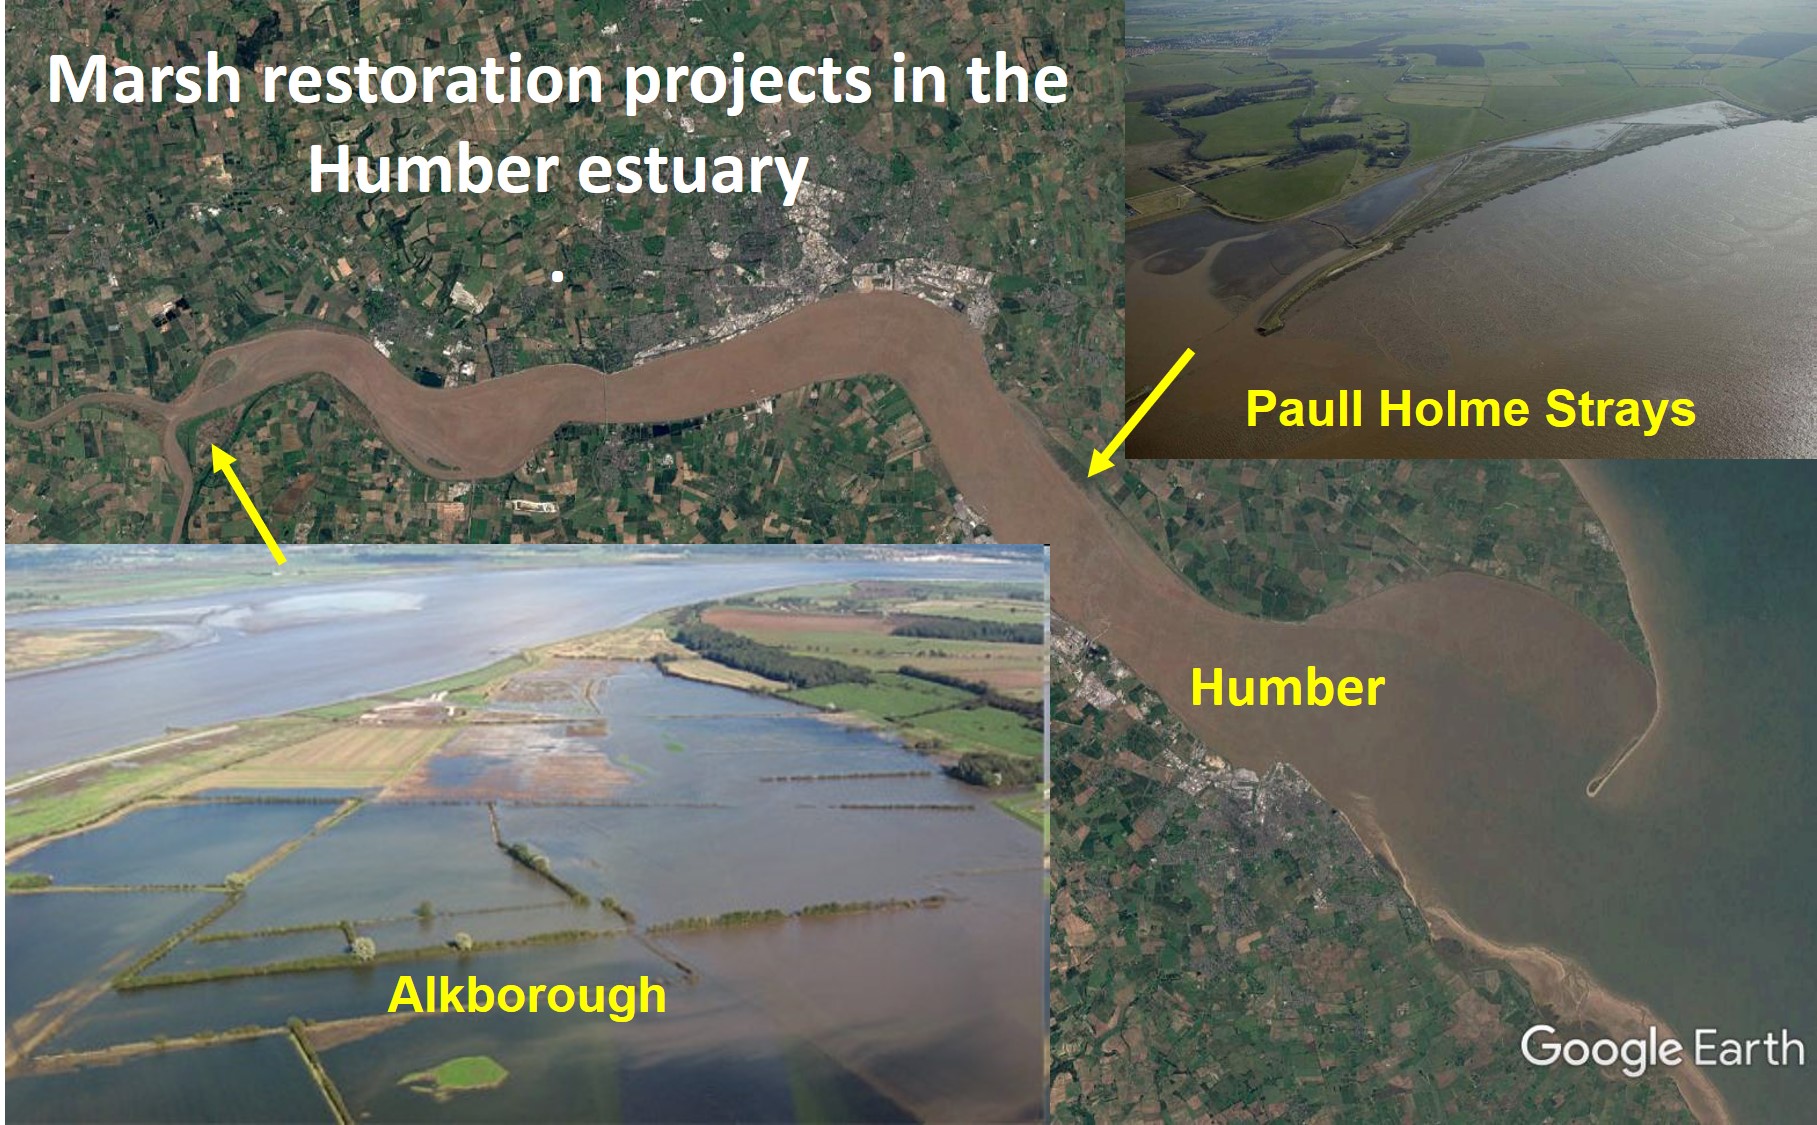
| 18:45, 23 November 2020 | MarshRestorationHumber.jpg (file) |  |
455 KB | Dronkers J | Marsh restoration projects in the Humber estuary. | 1 |
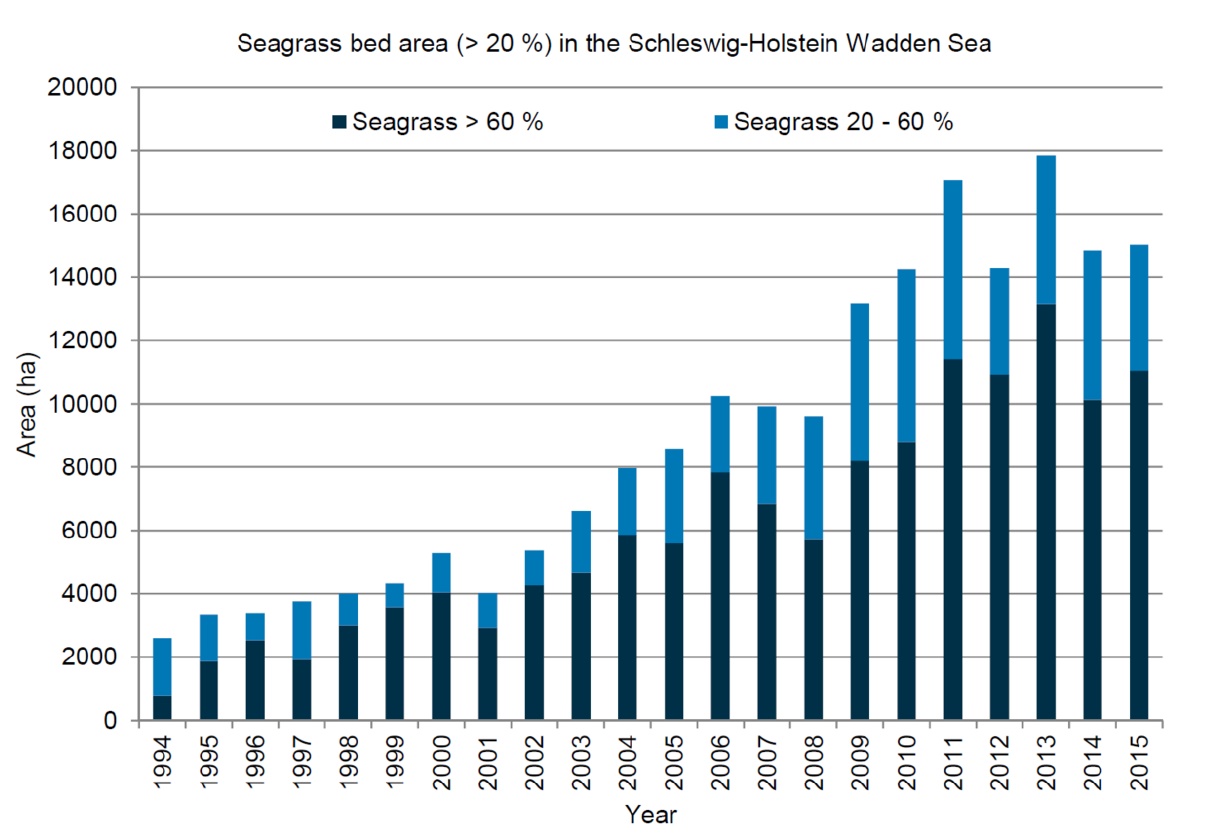
| 17:26, 20 November 2020 | SeagrassWaddenSchleswig-Holstein.jpg (file) |  |
178 KB | Dronkers J | Areal size (ha) of seagrass beds (coverage >60% and coverage 20-60%) in the intertidal zone of the Northfrisian Wadden Sea (Schleswig-Holstein) as estimated from aerial surveys in August or September between 1994 and 2015. Source: Wadden Sea Quality St... | 1 |
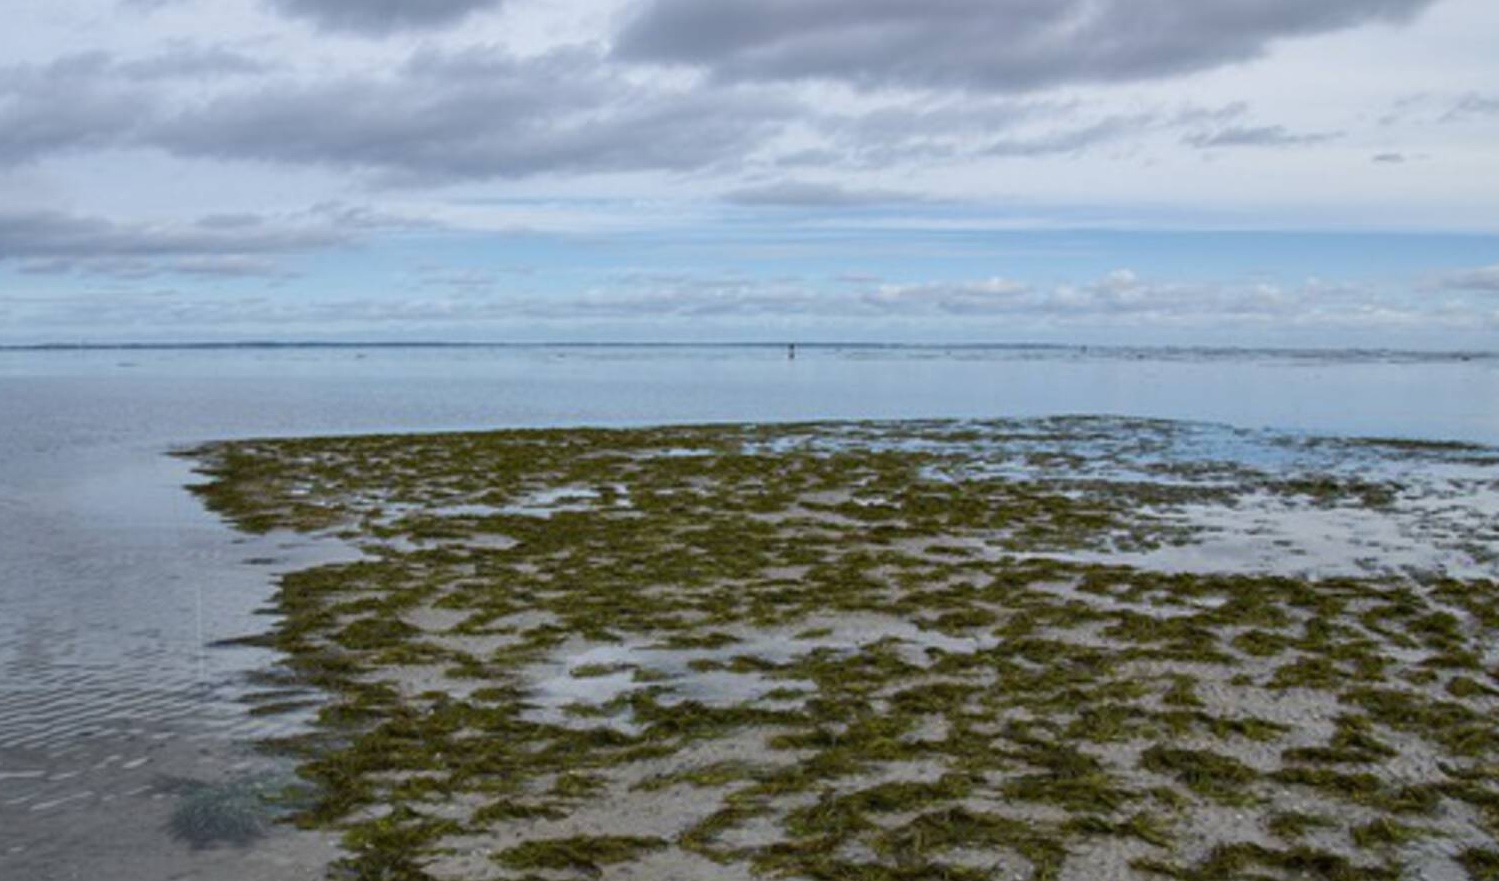
| 17:16, 20 November 2020 | SeagrassWaddenGriend.jpg (file) |  |
297 KB | Dronkers J | Seagrass field on an intertidal flat of the Vlie basin in the western Wadden Sea, 3 years after reintroduction. Source: Omroep Fryslan. | 1 |
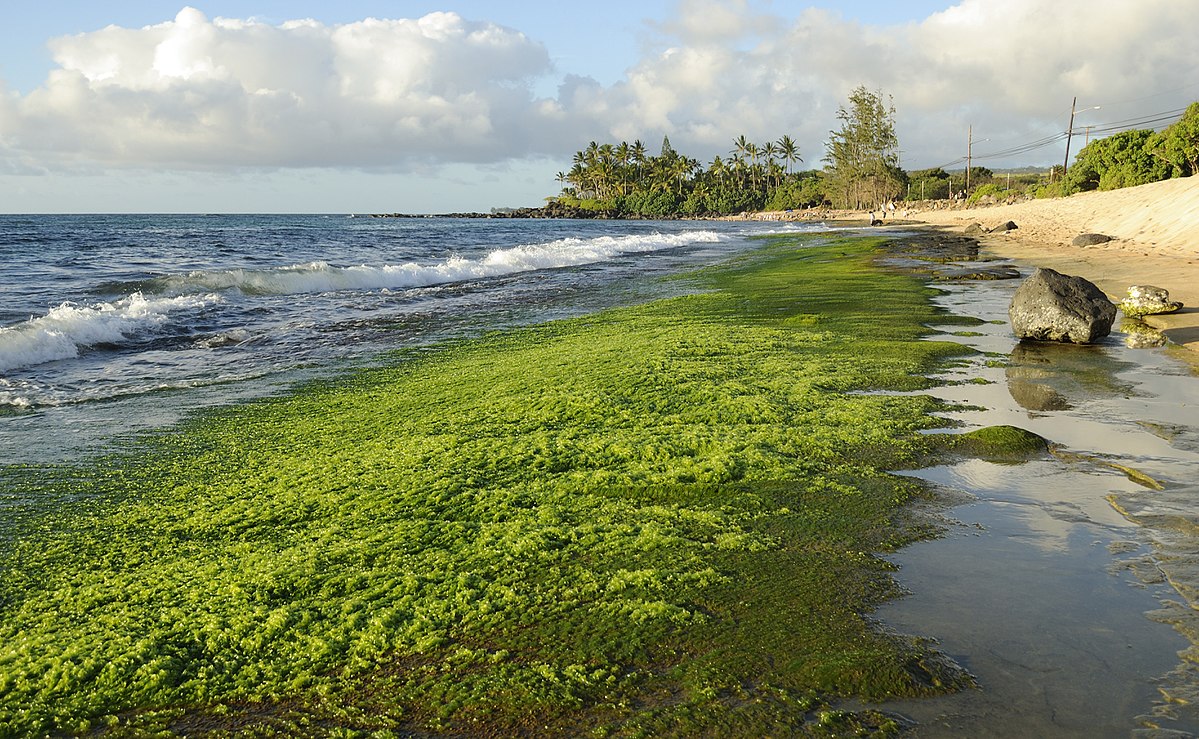
| 23:57, 14 November 2020 | GreenAlgae D Ramirez.jpg (file) |  |
342 KB | Dronkers J | Macroalgae washed ashore. Photo credit D. Ramirez | 1 |
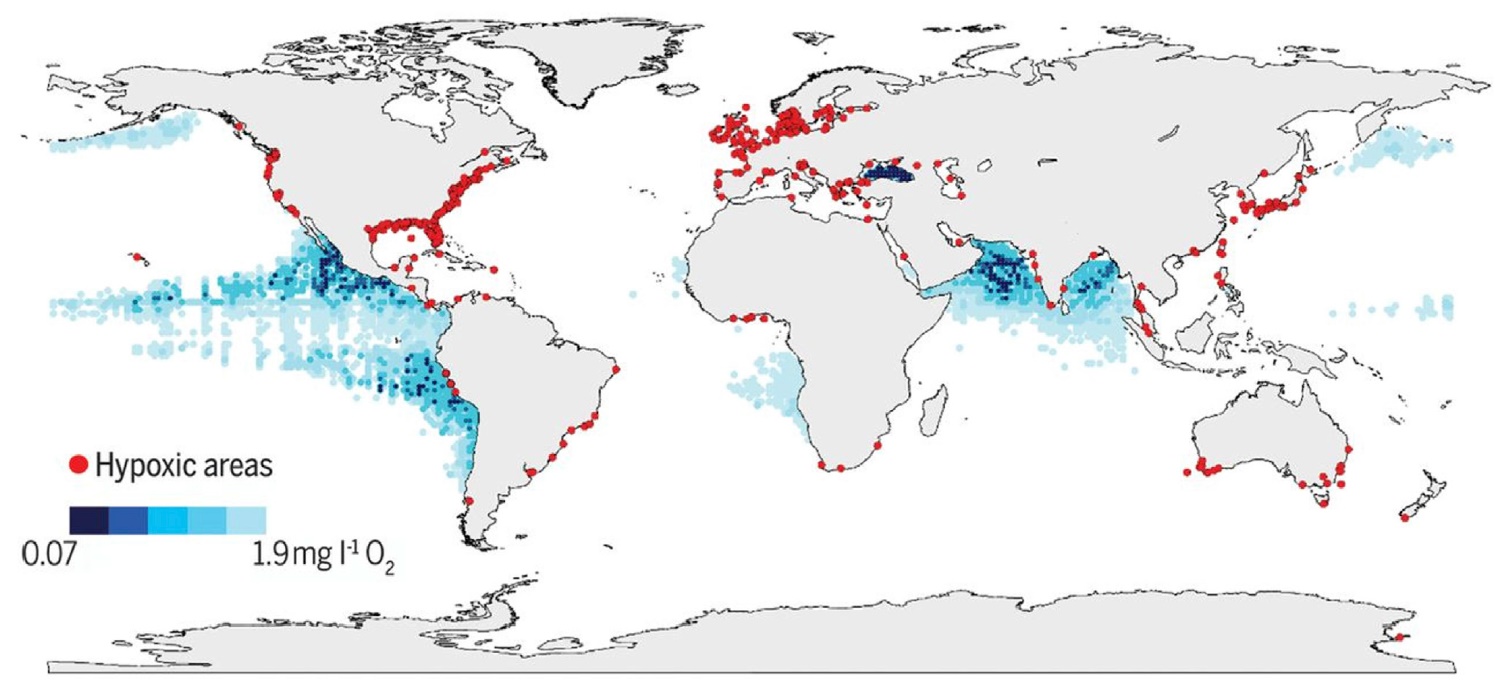
| 16:38, 14 November 2020 | OceanHypoxia.jpg (file) |  |
198 KB | Dronkers J | Areas with hypoxia in coastal seas (red) and in the oceans (blue). From IOC-UNESCO 2018 Creative Commons Licence. | 1 |
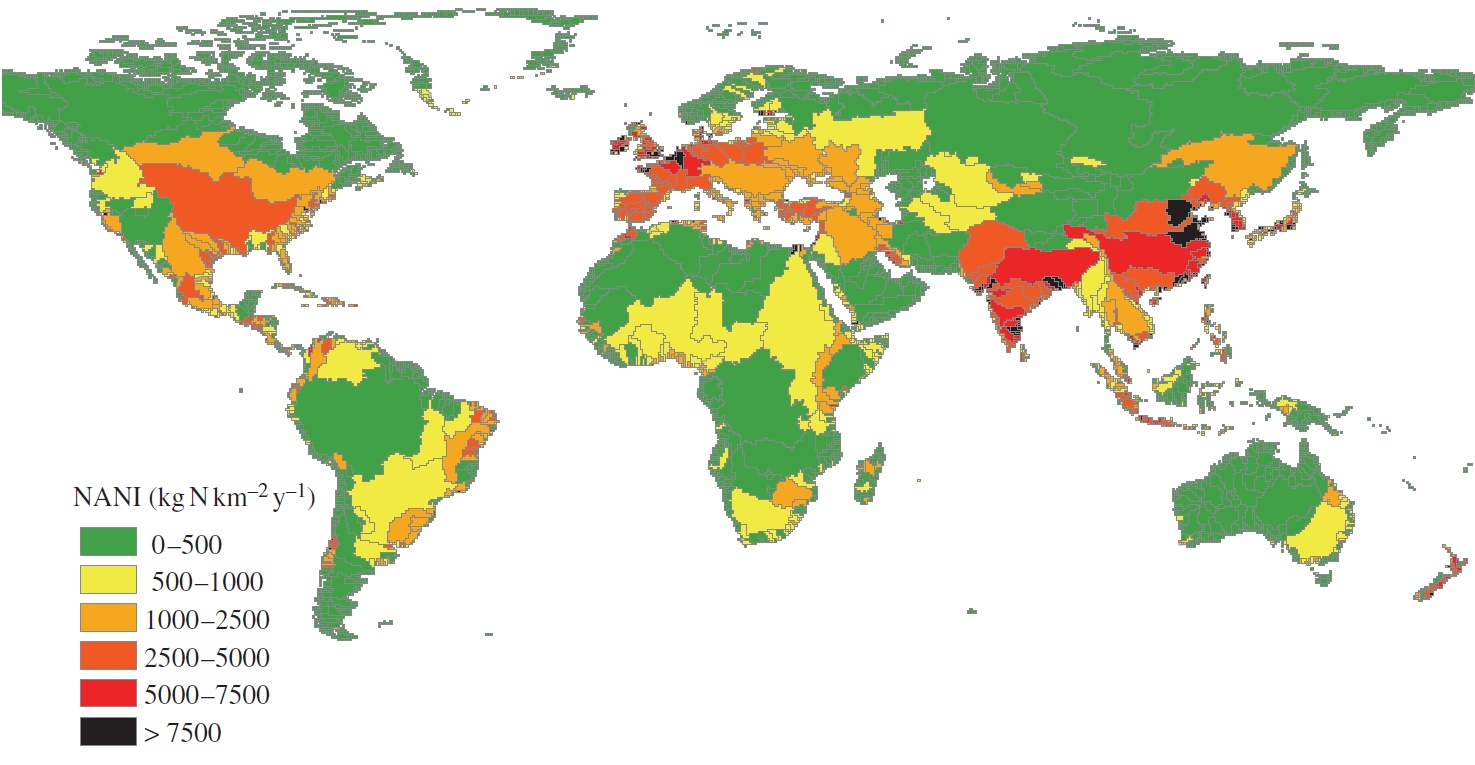
| 17:22, 13 November 2020 | GlobalInputN.jpg (file) |  |
267 KB | Dronkers J | Estimated net anthropogenic nitrogen inputs (NANI) according to the world’s main river catchments. Source: Billen et al., 2013. | 1 |
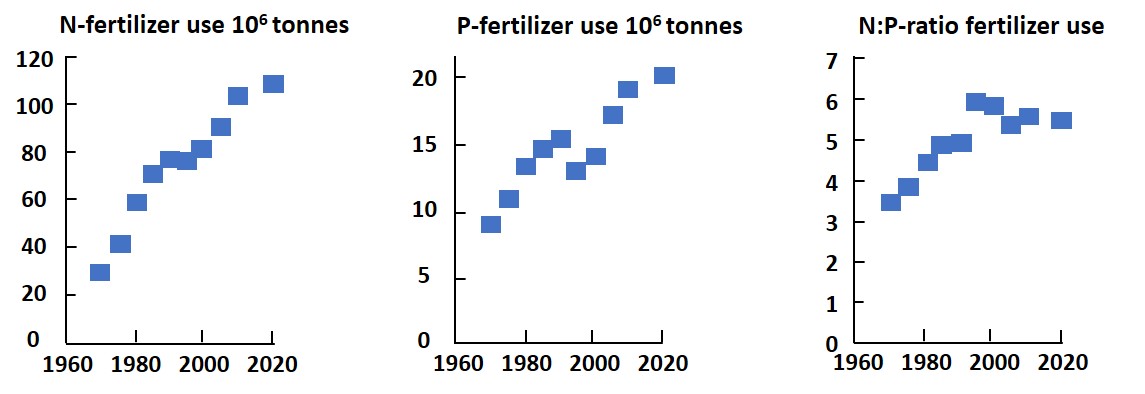
| 23:07, 12 November 2020 | FertilizerUseNP.jpg (file) |  |
58 KB | Dronkers J | N and P content of global fertilizer use. | 1 |
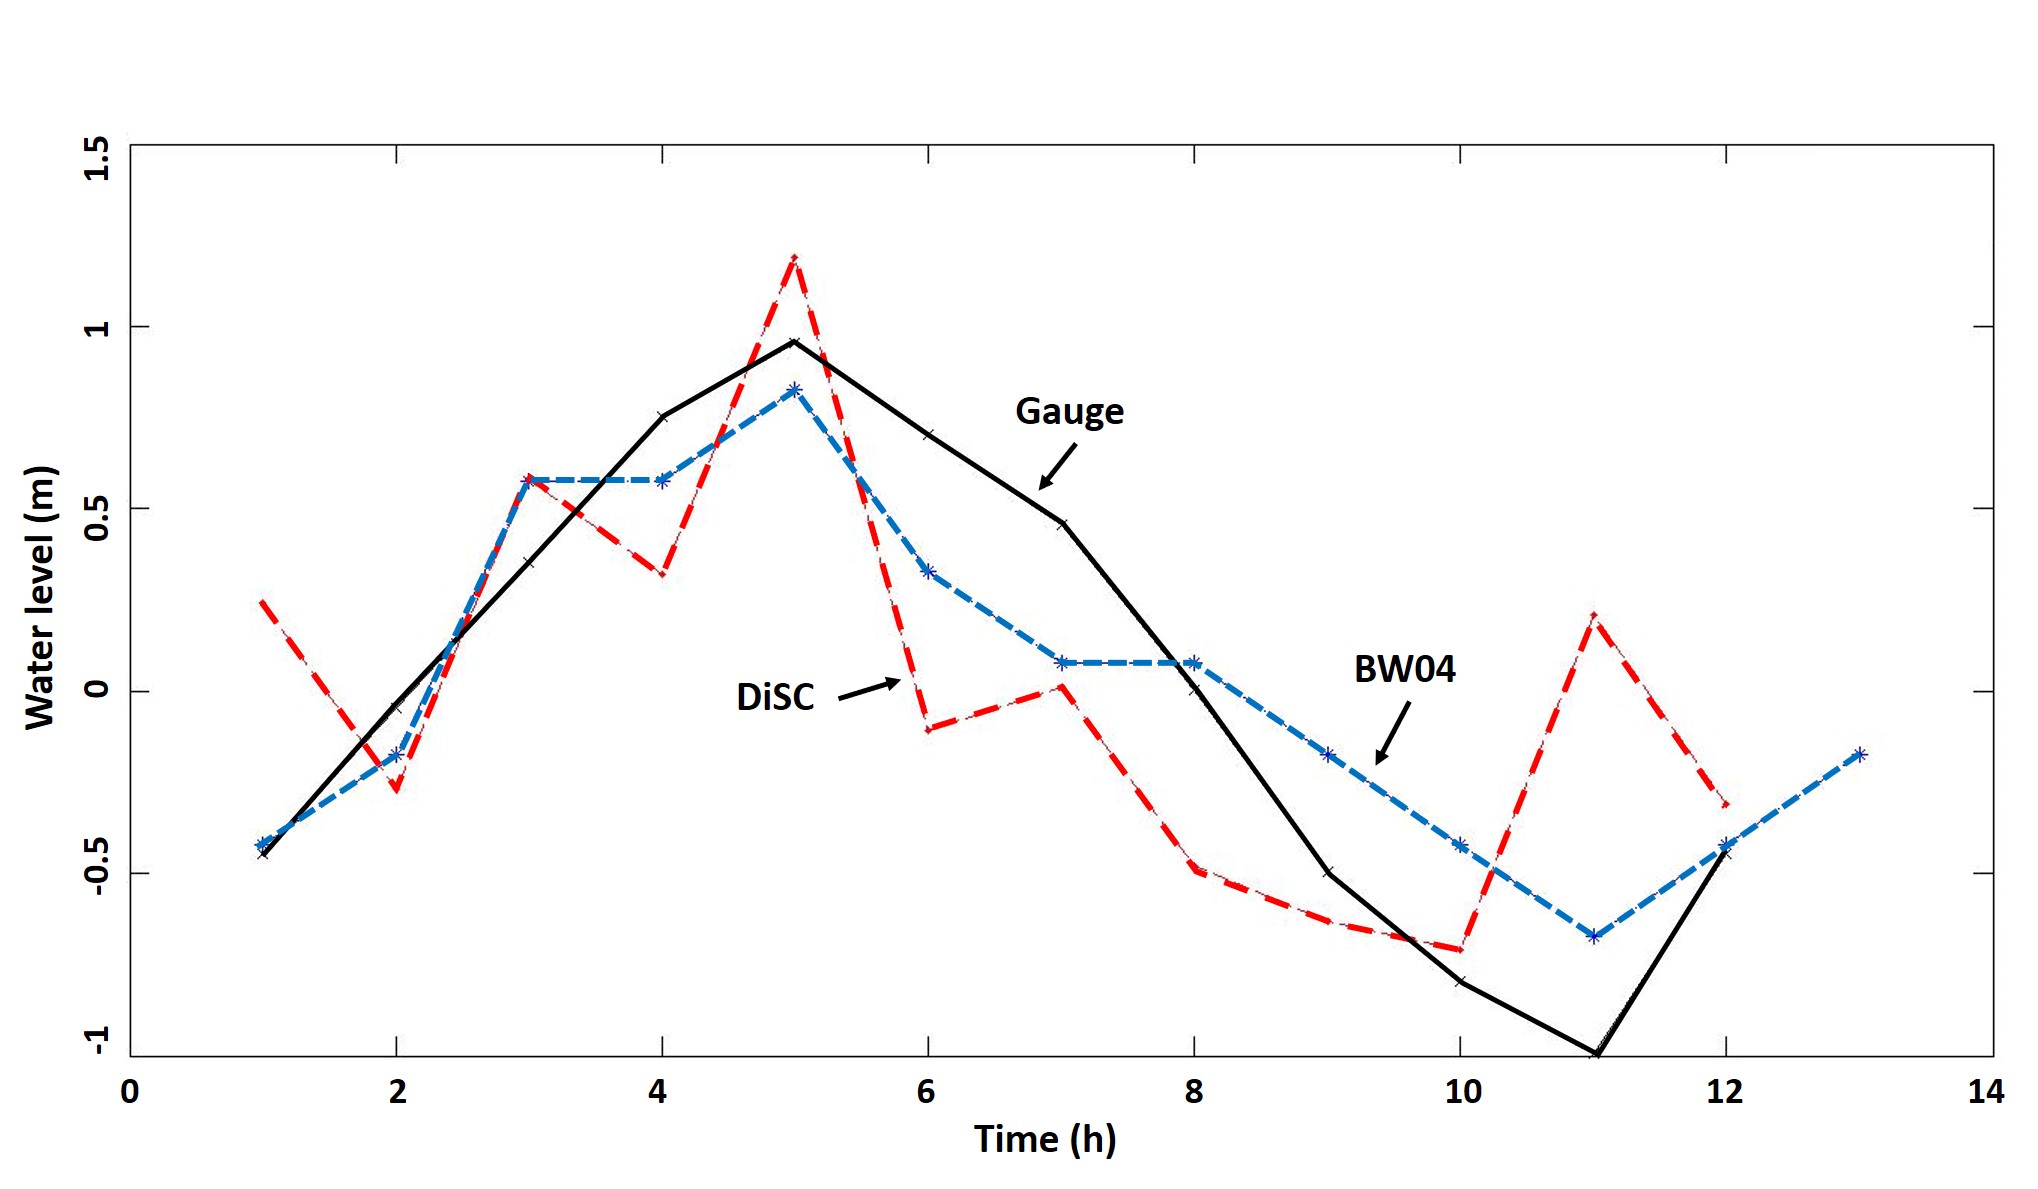
| 12:20, 26 October 2020 | WaterLevels.jpg (file) |  |
163 KB | Dronkers J | Time series of water level calculated with BW04, DiSC in the deepest part of the tidal channel together with the measured water level. | 1 |
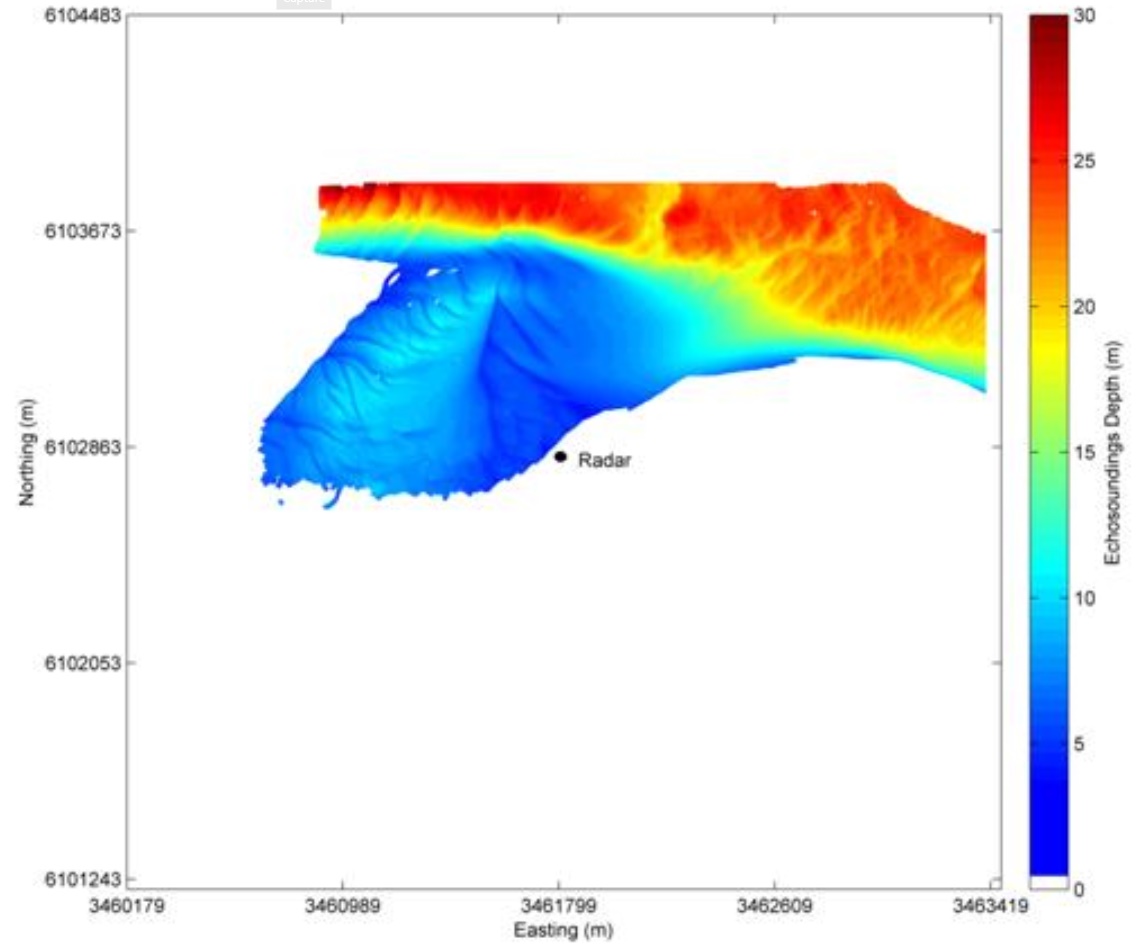
| 11:35, 26 October 2020 | BathyListWest.jpg (file) |  |
107 KB | Dronkers J | Bathymetry of area of investigation acquired by multibeam echosounder. | 1 |
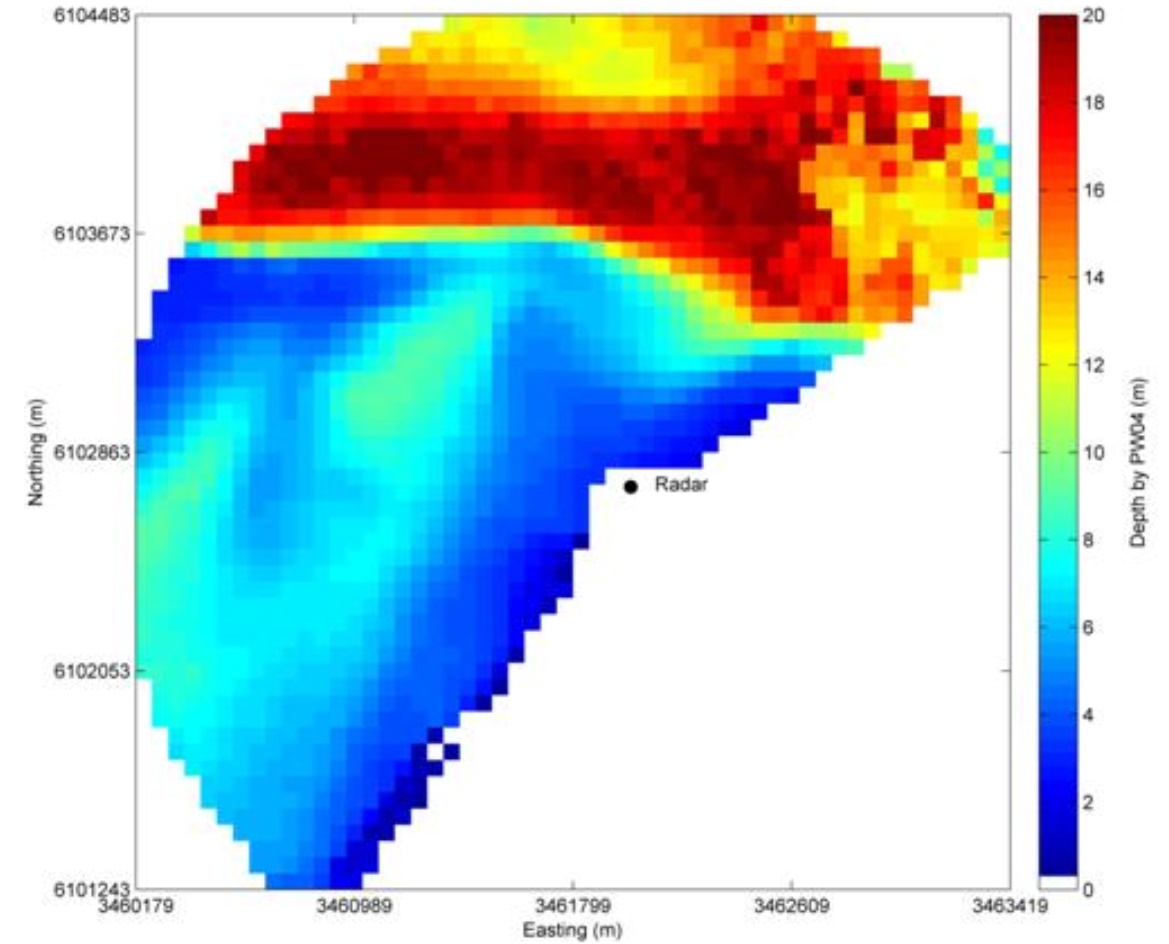
| 11:34, 26 October 2020 | BathyWB04.jpg (file) |  |
150 KB | Dronkers J | Averaged bathymetry over 12h obtained from the BW04 method. | 1 |
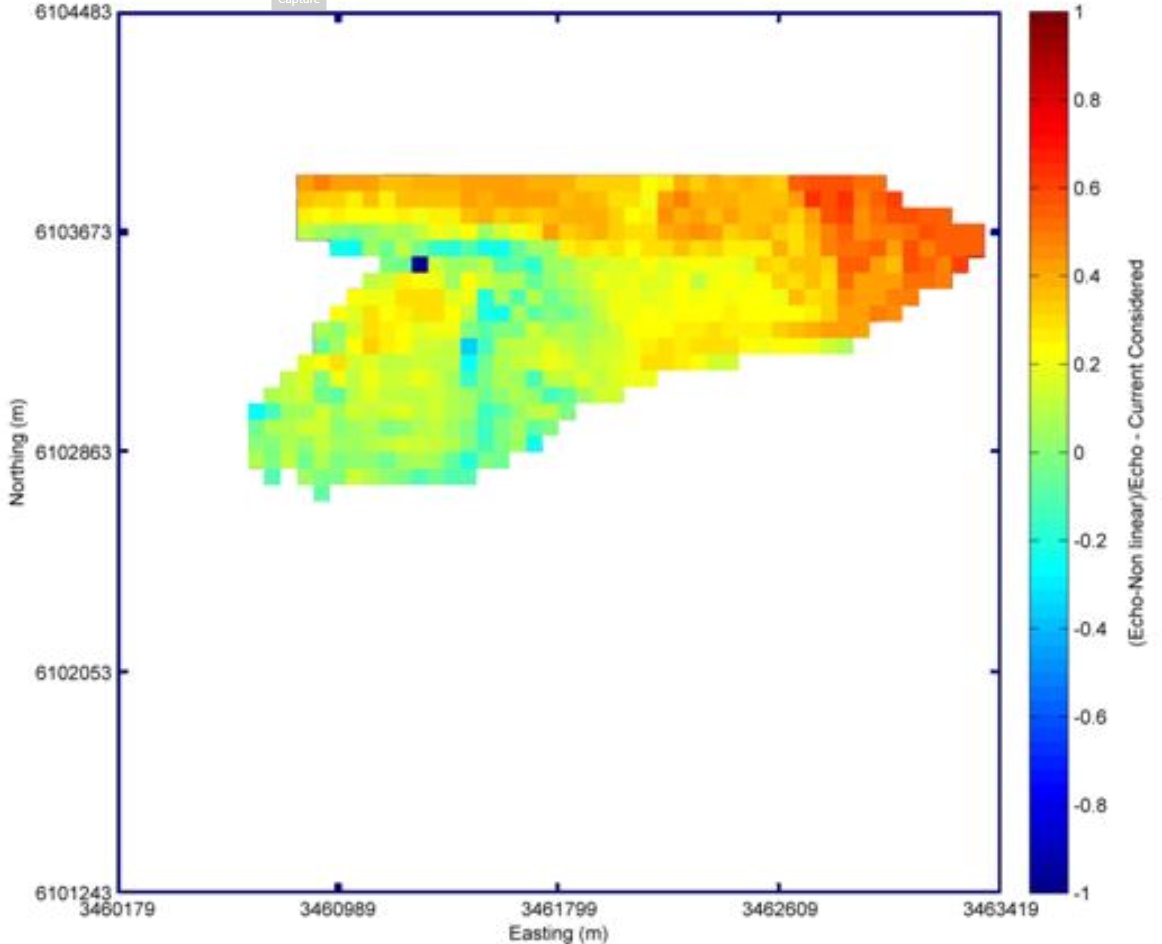
| 11:33, 26 October 2020 | ErrorWB04.jpg (file) |  |
107 KB | Dronkers J | Map of the relative error of the BW04 method. | 1 |
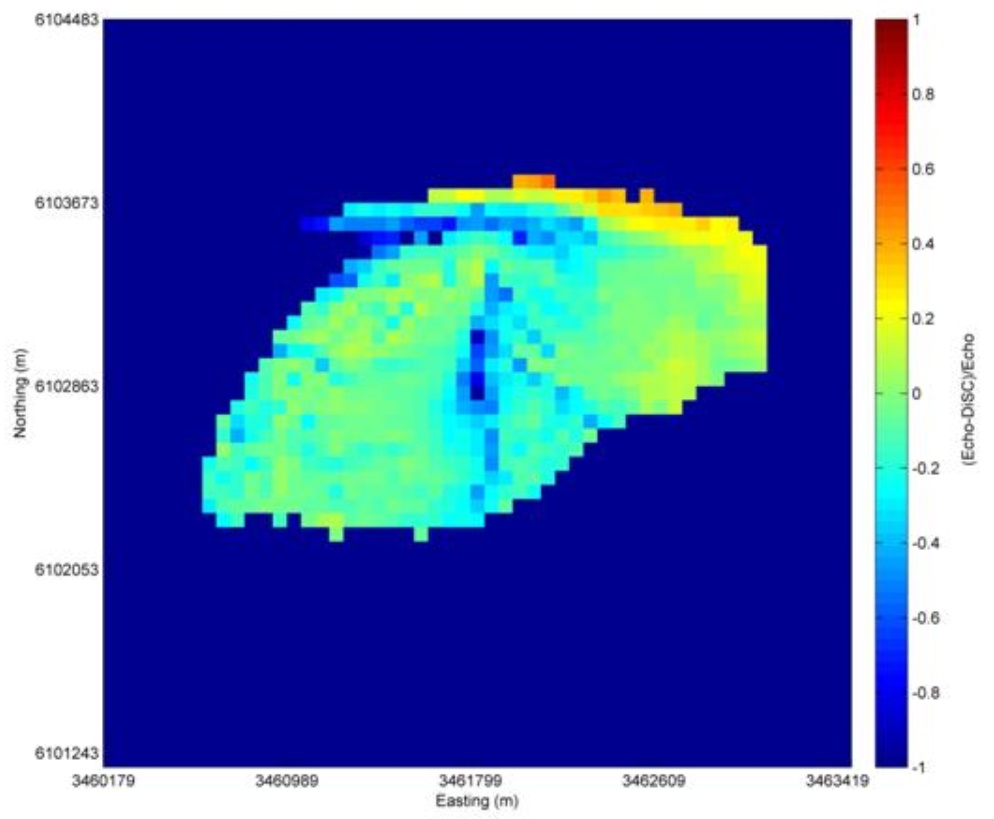
| 11:33, 26 October 2020 | ErrorDiSC.jpg (file) |  |
91 KB | Dronkers J | Map of the relative error of the DiSC method. | 1 |
| 21:08, 24 October 2020 | WERAspectrum.jpg (file) |  |
77 KB | Dronkers J | Typical backscatter spectrum of sea echoes, normalized to the strongest signal measured by WERA. | 1 |
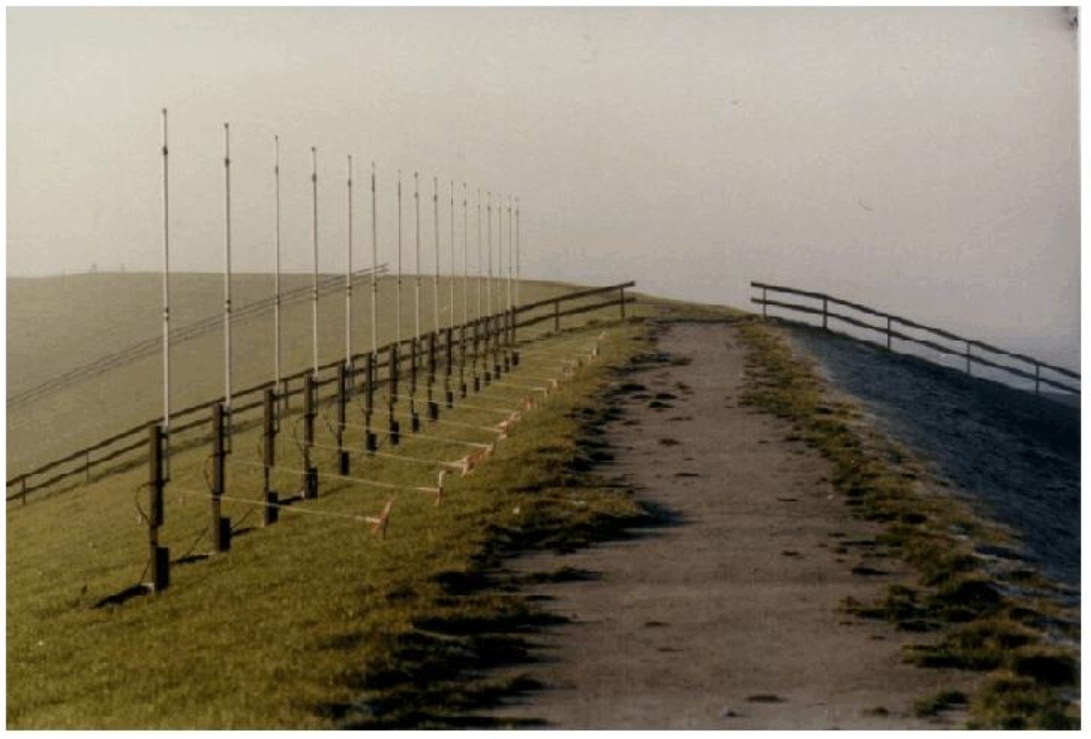
| 21:07, 24 October 2020 | WERAantenna.jpg (file) |  |
162 KB | Dronkers J | Typical example of an antenna installation for WERA radar. | 1 |
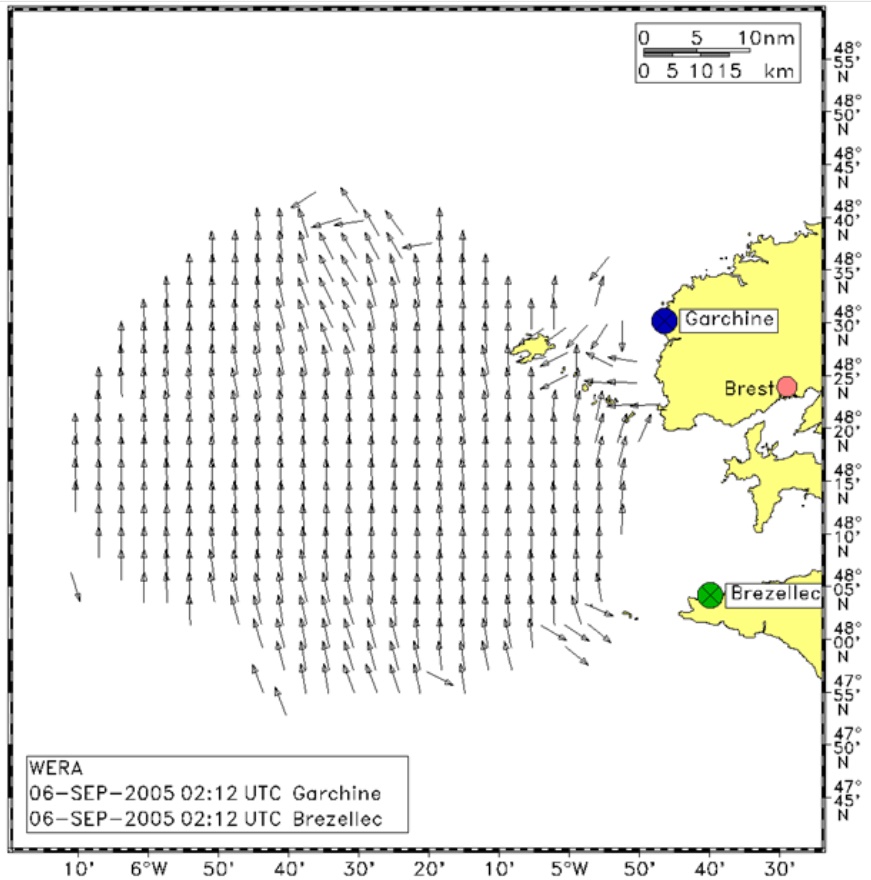
| 21:06, 24 October 2020 | WindFieldOffBrest.jpg (file) |  |
178 KB | Dronkers J | Example of measured wind direction measured by HF radar of the coast of Brest (France). | 1 |
| 21:05, 24 October 2020 | WaveFieldOffBrest.jpg (file) |  |
195 KB | Dronkers J | Wave field measured by HF radar off the coast of Brest. | 1 |
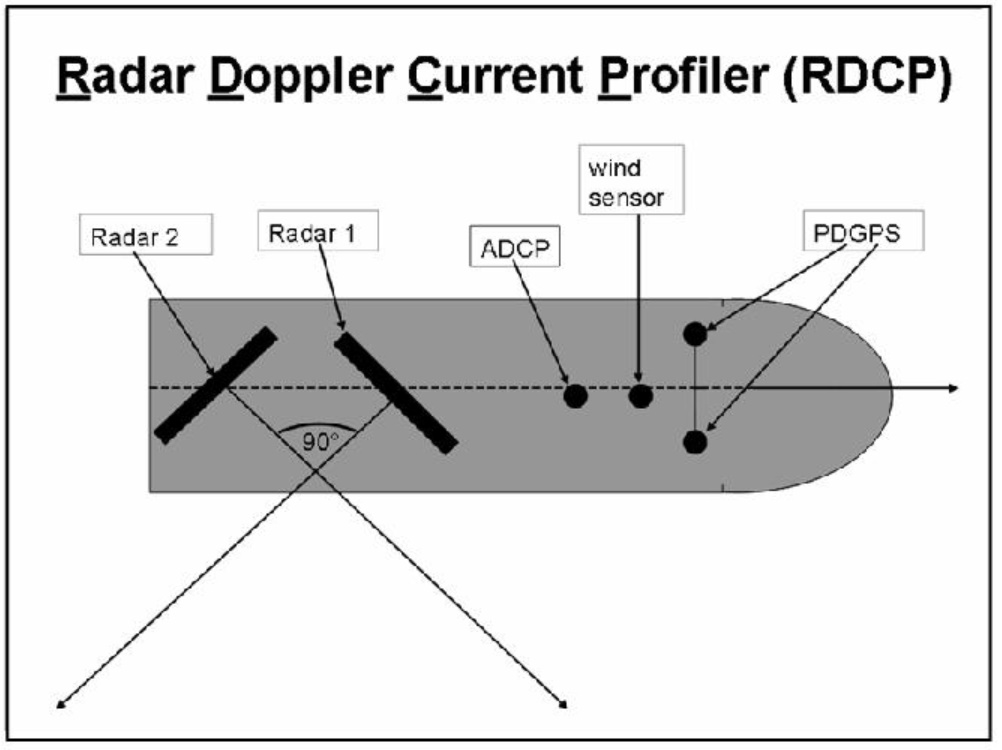
| 21:04, 24 October 2020 | RDCPScheme.jpg (file) |  |
97 KB | Dronkers J | Ship with mounted Radar Doppler Current Profiler (RDCP). | 1 |
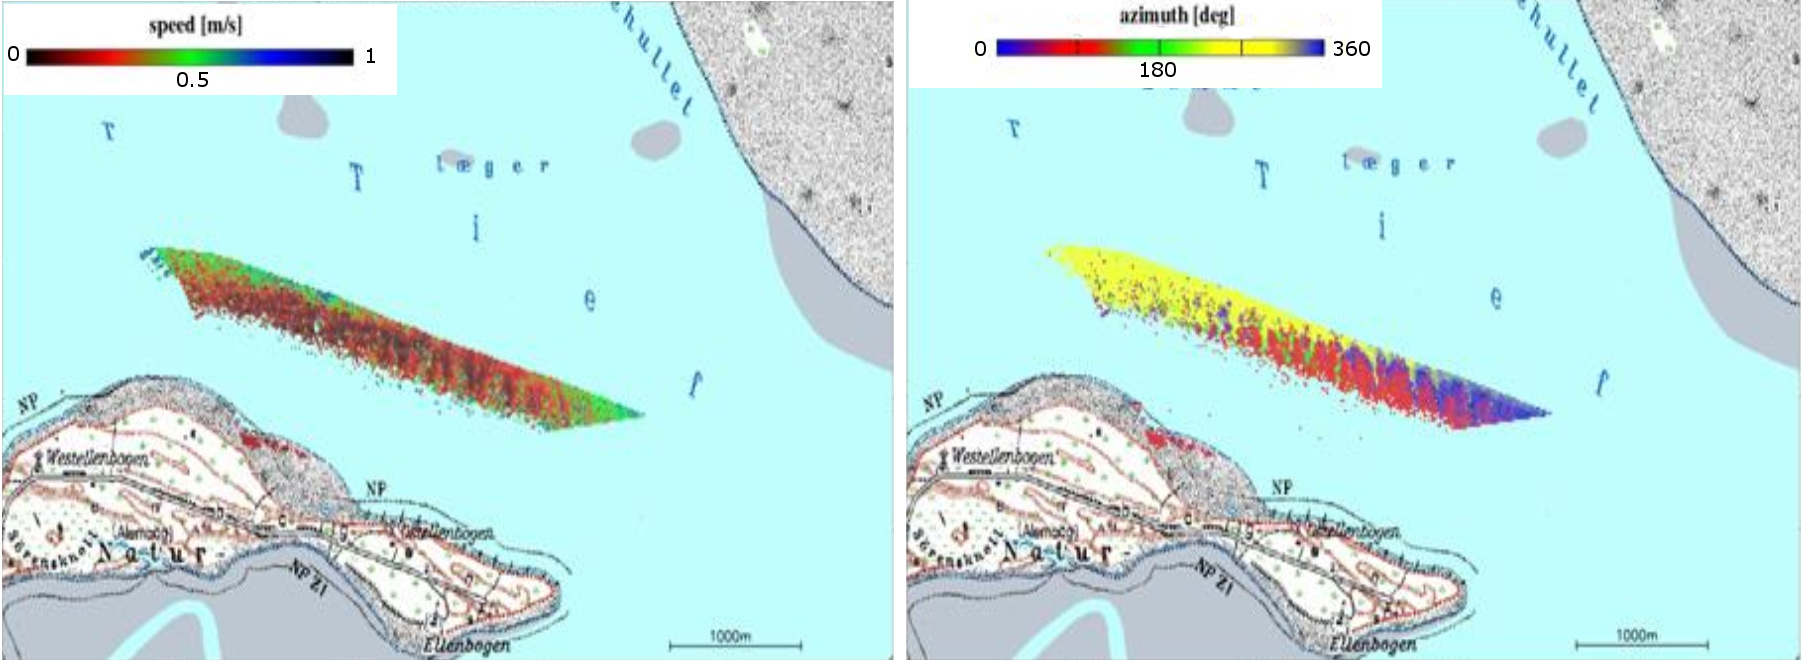
| 21:03, 24 October 2020 | RDCPcurrent.jpg (file) |  |
262 KB | Dronkers J | The two maps show the current distribution within a tidal channel in the German bight (Lister Tief) obtained with RDCP. Left panel: current speed; right panel: current direction. | 1 |
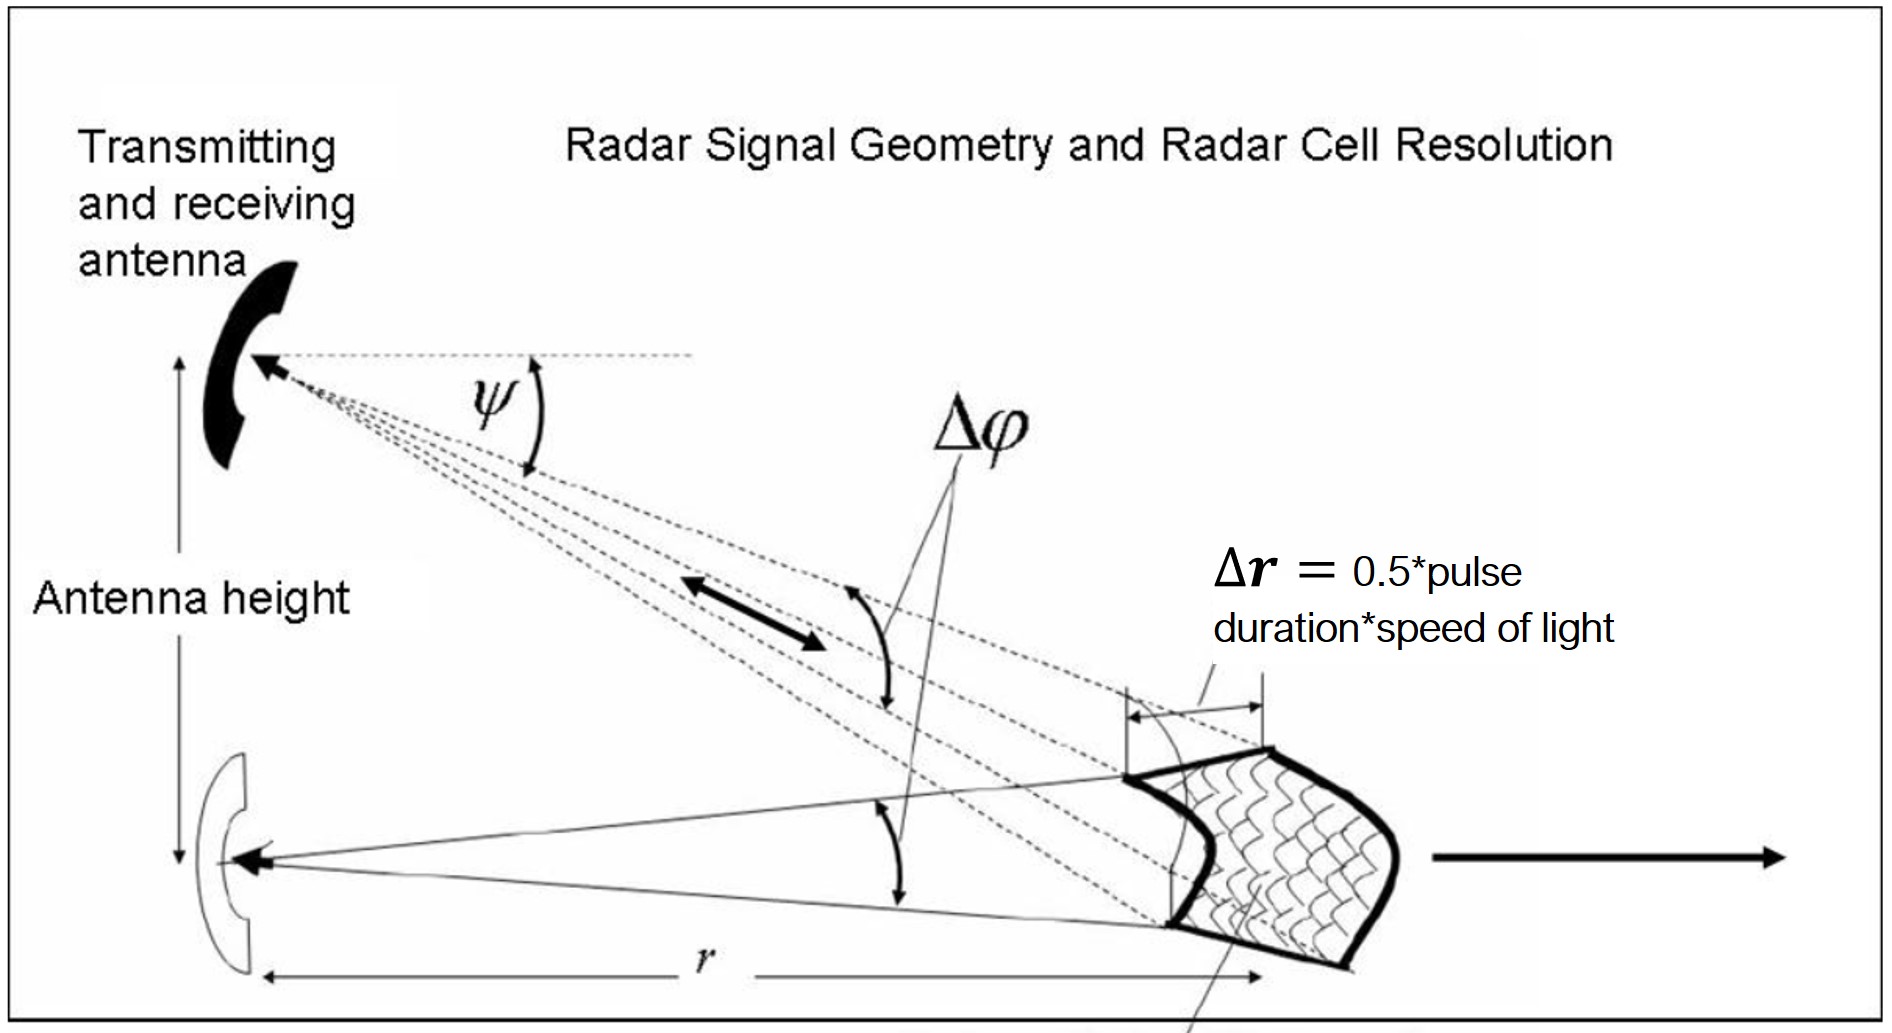
| 21:02, 24 October 2020 | RadarGeometry.jpg (file) |  |
168 KB | Dronkers J | Geometry microwave radar. | 1 |
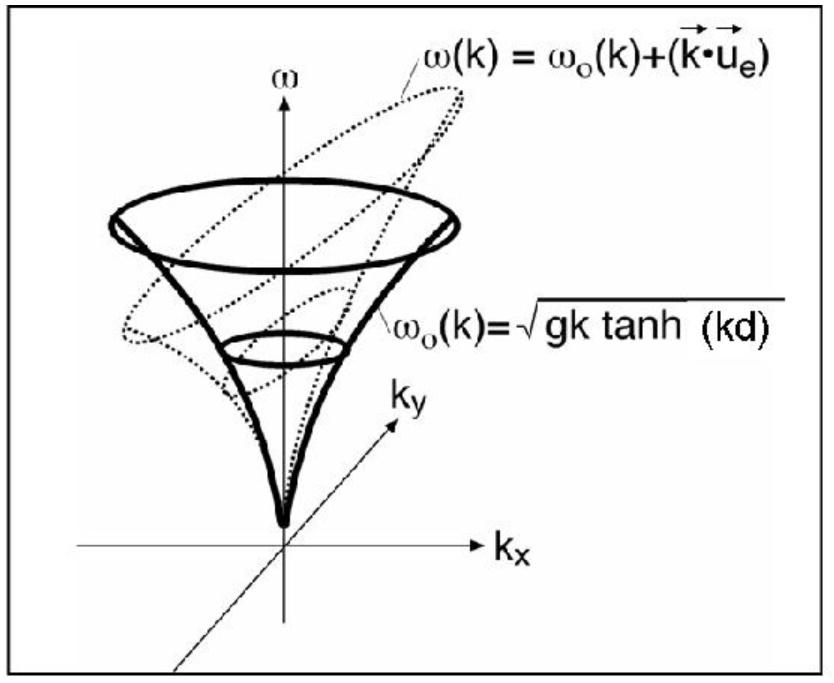
| 20:51, 24 October 2020 | DispersionShell.jpg (file) |  |
78 KB | Dronkers J | Gravity wave-dispersion shell in the wave vector-frequency domain . | 1 |
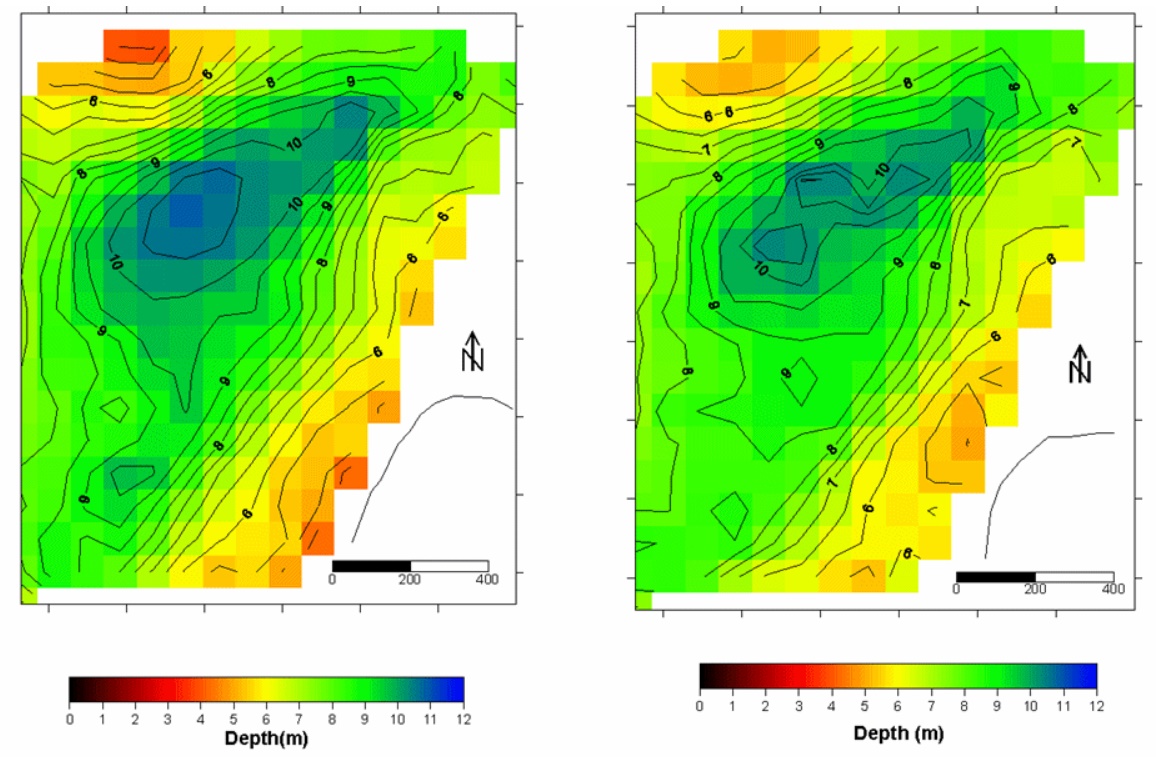
| 20:51, 24 October 2020 | DiSCbathymetries.jpg (file) |  |
272 KB | Dronkers J | Bathymetries of List West (north end of the Island Sylt in the German bight) derived by DiSC for February 20 (left) and February 28 (right). | 1 |
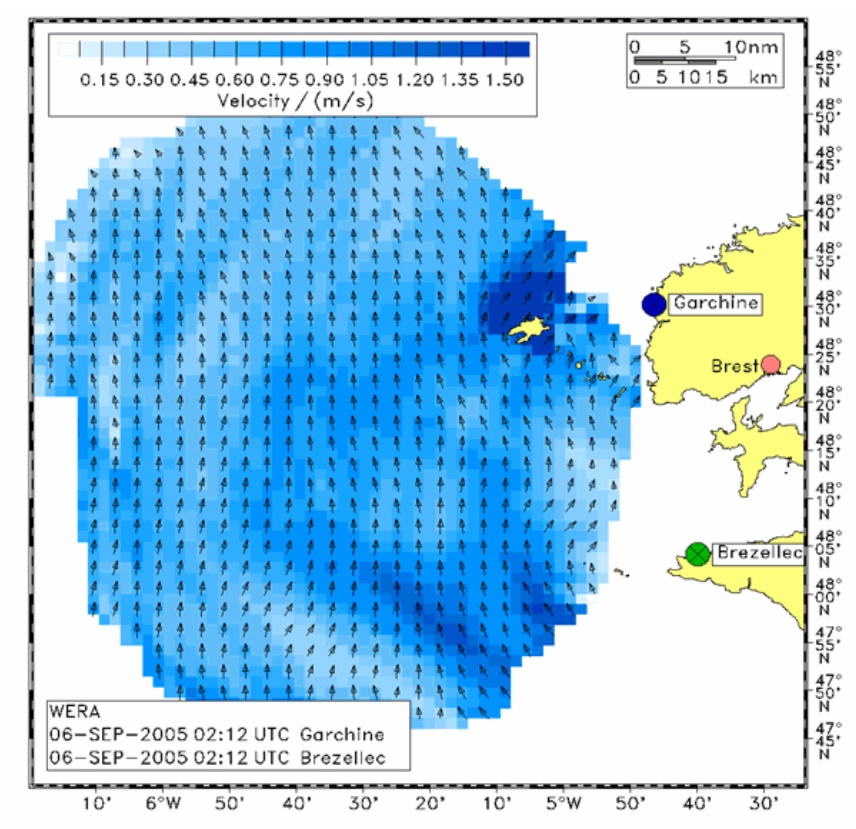
| 20:46, 24 October 2020 | CurrentFieldOffBrest.jpg (file) |  |
240 KB | Dronkers J | Example of a surface velocity field measured by HF radar off the coast of Brest (France). | 1 |
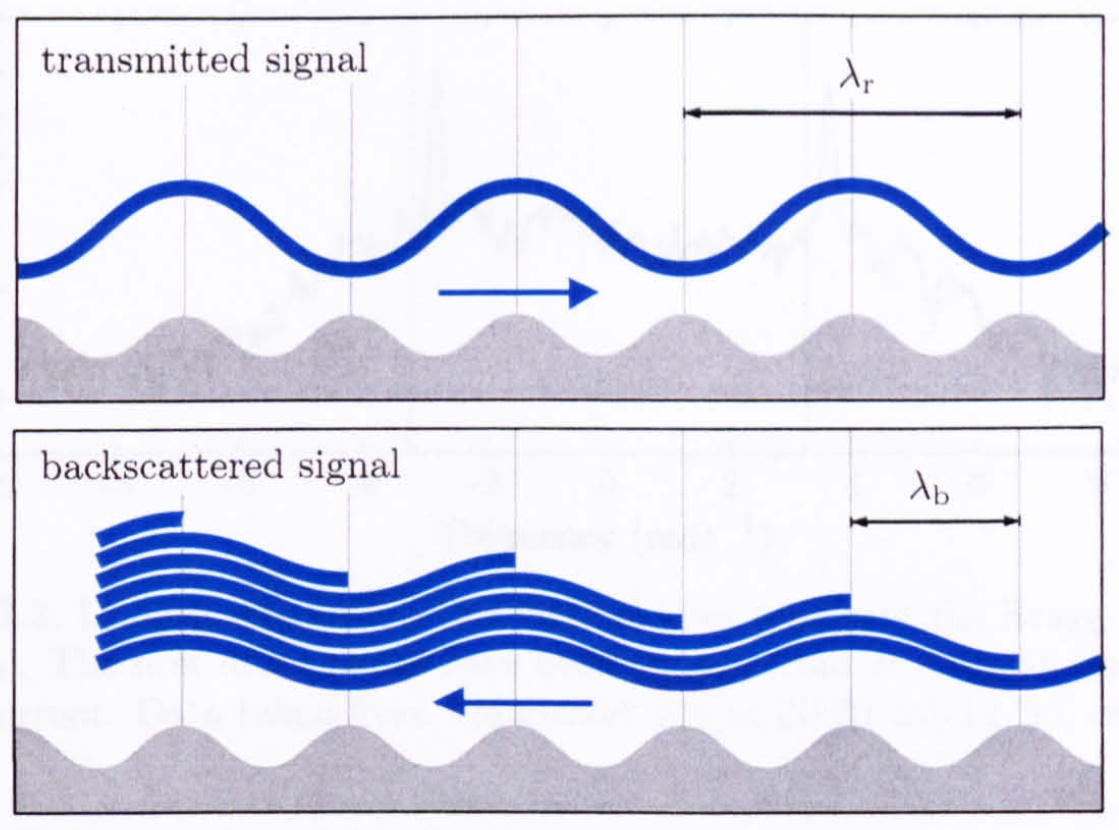
| 15:55, 24 October 2020 | BraggResonanceMechanism.jpg (file) |  |
190 KB | Dronkers J | Successive reflections of an electromagnetic signal by a surface wave are in phase if the wavelength of the emitted signal is twice the wavelength of the surface wave. This positive interference is called 'Bragg scattering'. Image from Middleditch (2006). | 1 |
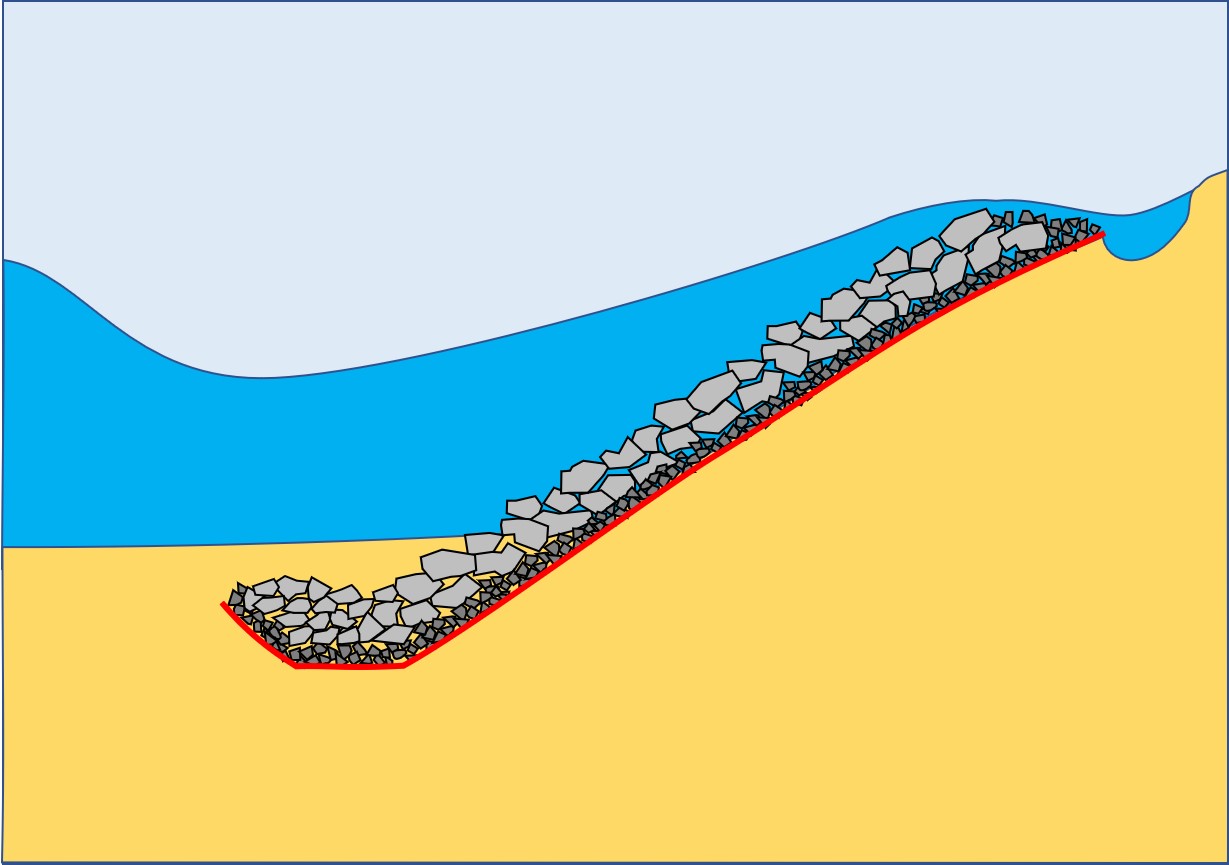
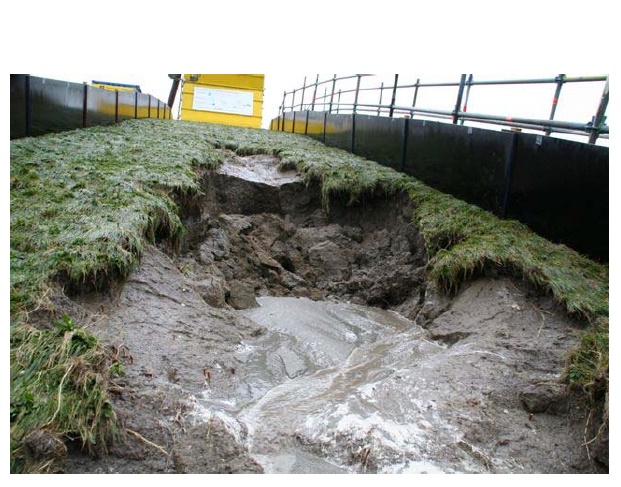
| 20:23, 22 October 2020 | RevetmentOvertopping.jpg (file) |  |
89 KB | Dronkers J | Overtopping of revetment by wave run-up and subsequent erosion. | 1 |
| 23:04, 5 October 2020 | SpeciesAbundance.jpg (file) |  |
107 KB | Dronkers J | Species abundance plots for occasional, persistent and total estuarine fish species. After Mugarran and Henderson (2003). | 1 |
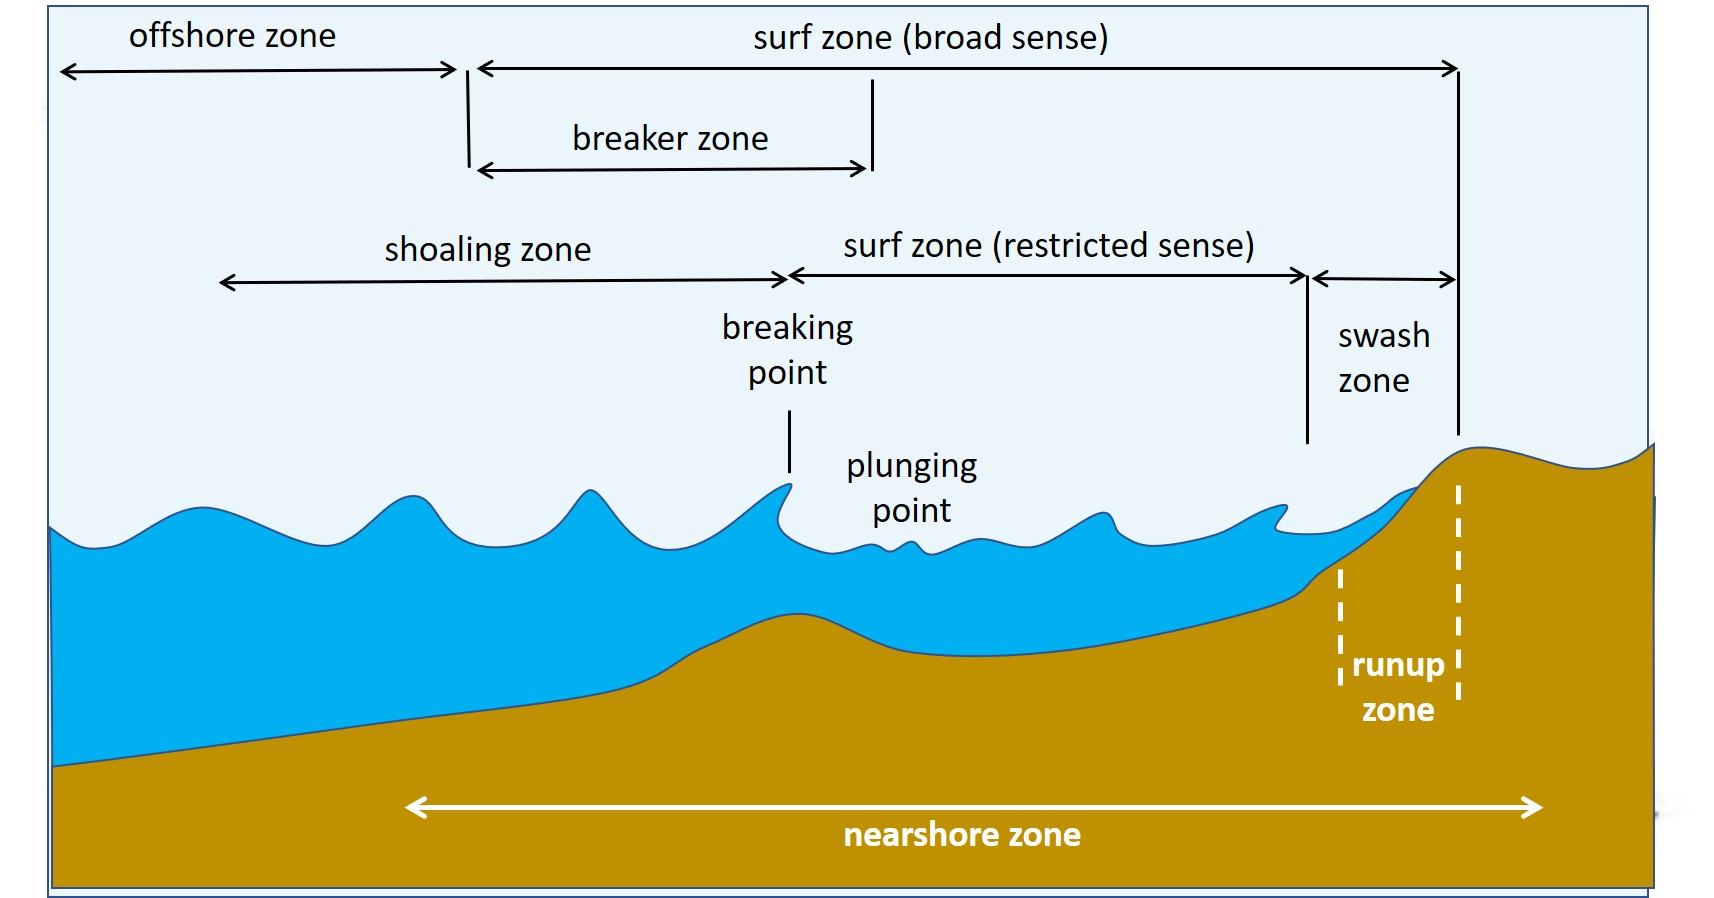
| 17:31, 18 September 2020 | ZoneDivisionNearshore.jpg (file) |  |
135 KB | Dronkers J | Zone division in the nearshore region. | 1 |
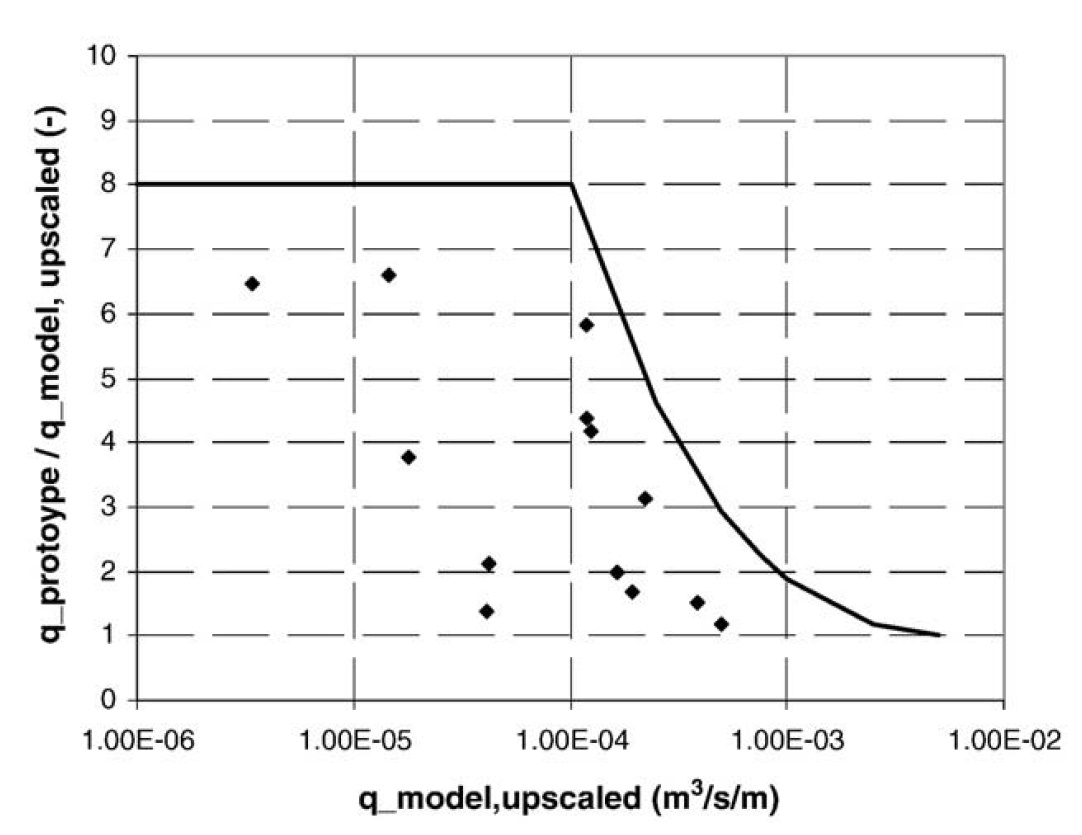
| 17:30, 18 September 2020 | OvertoppingDischargeRatioPrototypeModel.jpg (file) |  |
117 KB | Dronkers J | Ratio between prototype overtopping discharge and upscaled model overtopping discharge . | 1 |
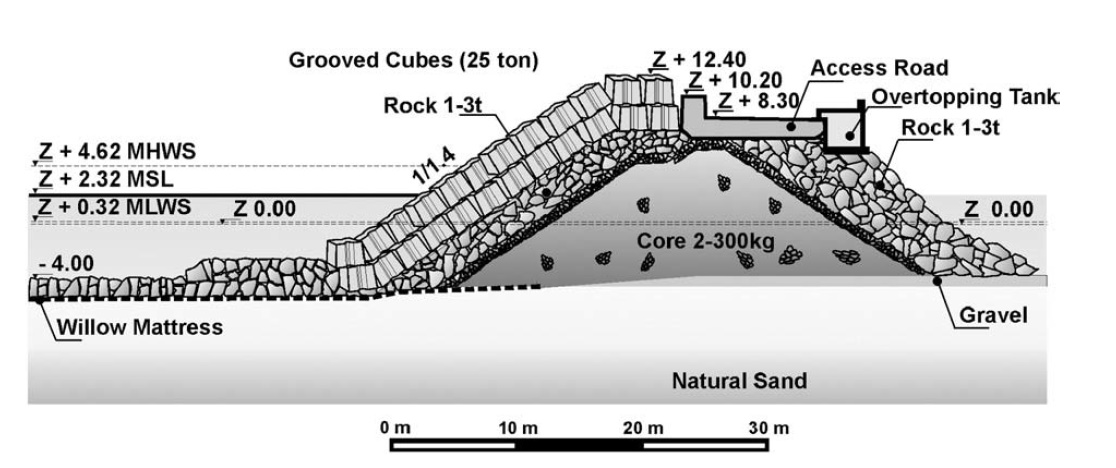
| 17:29, 18 September 2020 | ZeebruggeBreakwater.jpg (file) |  |
134 KB | Dronkers J | Cross-section of Zeebrugge rubble mound breakwater. | 1 |
| 12:35, 17 September 2020 | WaveOvertoppingDamage1.jpg (file) |  |
139 KB | Dronkers J | Example of damage by the wave overtopping simulation. | 1 |
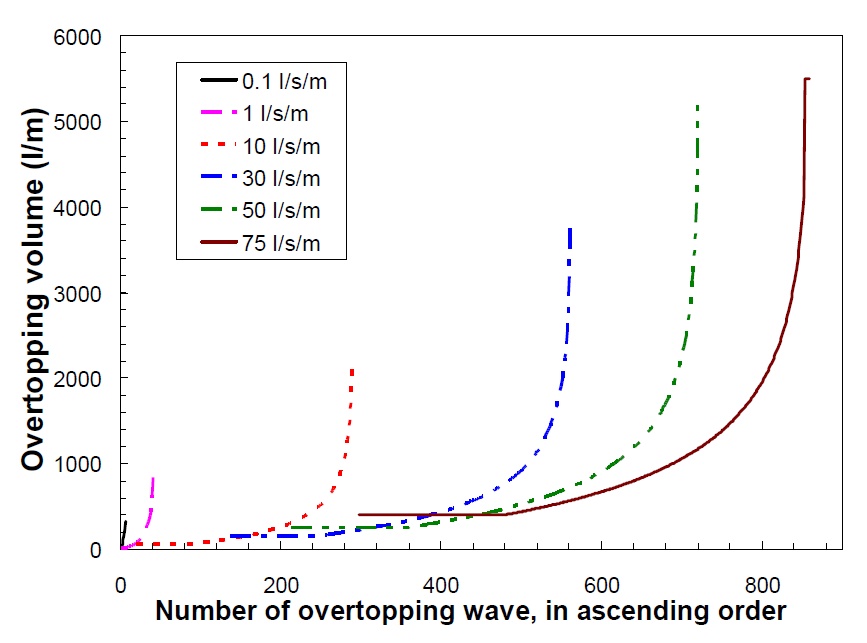
| 12:34, 17 September 2020 | WaveOvertoppingVolume.jpg (file) |  |
98 KB | Dronkers J | Distribution of overtopping volumes of waves for sea dikes and various mean overtopping discharges, as simulated by the Wave Overtopping Simulator. | 1 |
| 12:33, 17 September 2020 | WaveOvertoppingExperiment.jpg (file) |  |
96 KB | Dronkers J | Release of a wave from the simulator. | 1 |
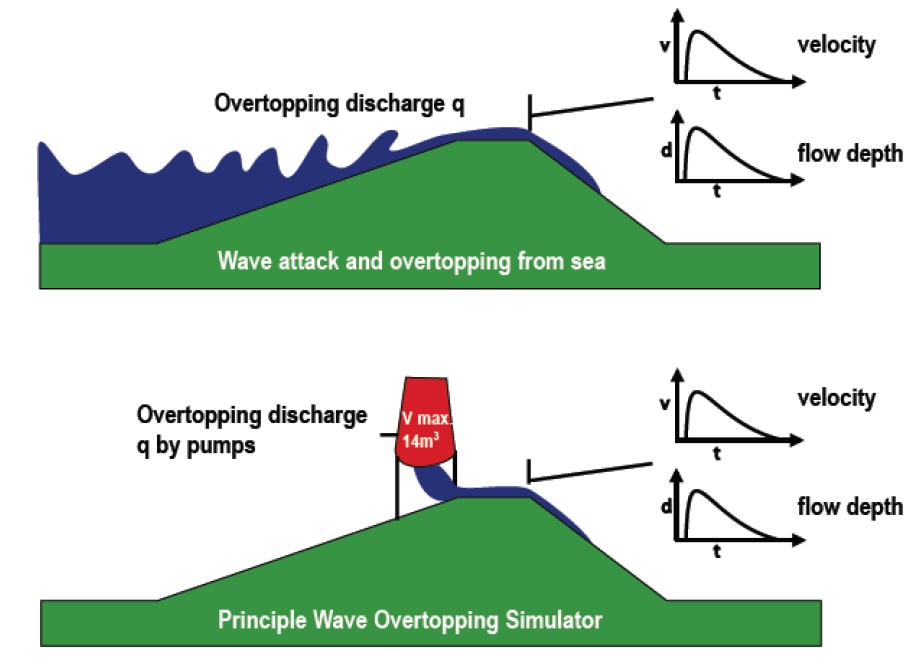
| 12:32, 17 September 2020 | WaveOvertoppingSimulator.jpg (file) |  |
85 KB | Dronkers J | Principle of the Wave Overtopping Simulator. | 1 |
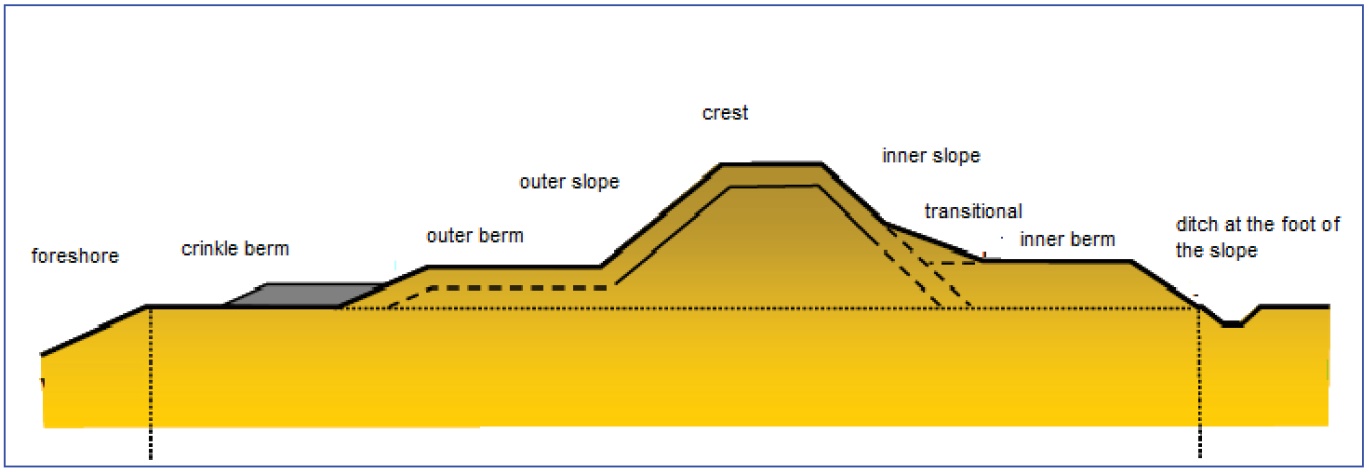
| 15:43, 16 September 2020 | DutchSeadike.jpg (file) |  |
92 KB | Dronkers J | Cross-section of a Dutch seadike. | 1 |
| 22:16, 12 September 2020 | EuropeMarineProtectedAreas2015.gif (file) |  |
819 KB | Dronkers J | Map of Marine Protected Areas designated under the Regional Sea Conventions, situation 2015. From EEA report 3/2015: Marine protected areas in Europe's seas. An overview and perspectives for the future. | 1 |
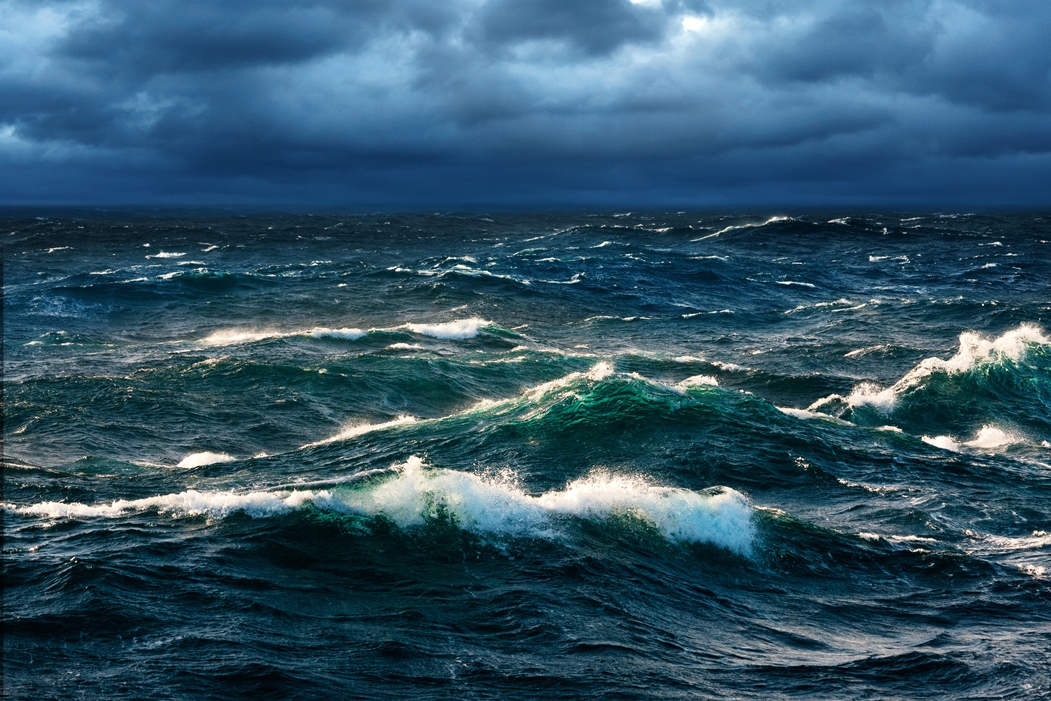
| 15:55, 1 September 2020 | WhiteCappedWaves.jpg (file) |  |
483 KB | Dronkers J | White-capped waves. Credit recon.sccf.org | 1 |
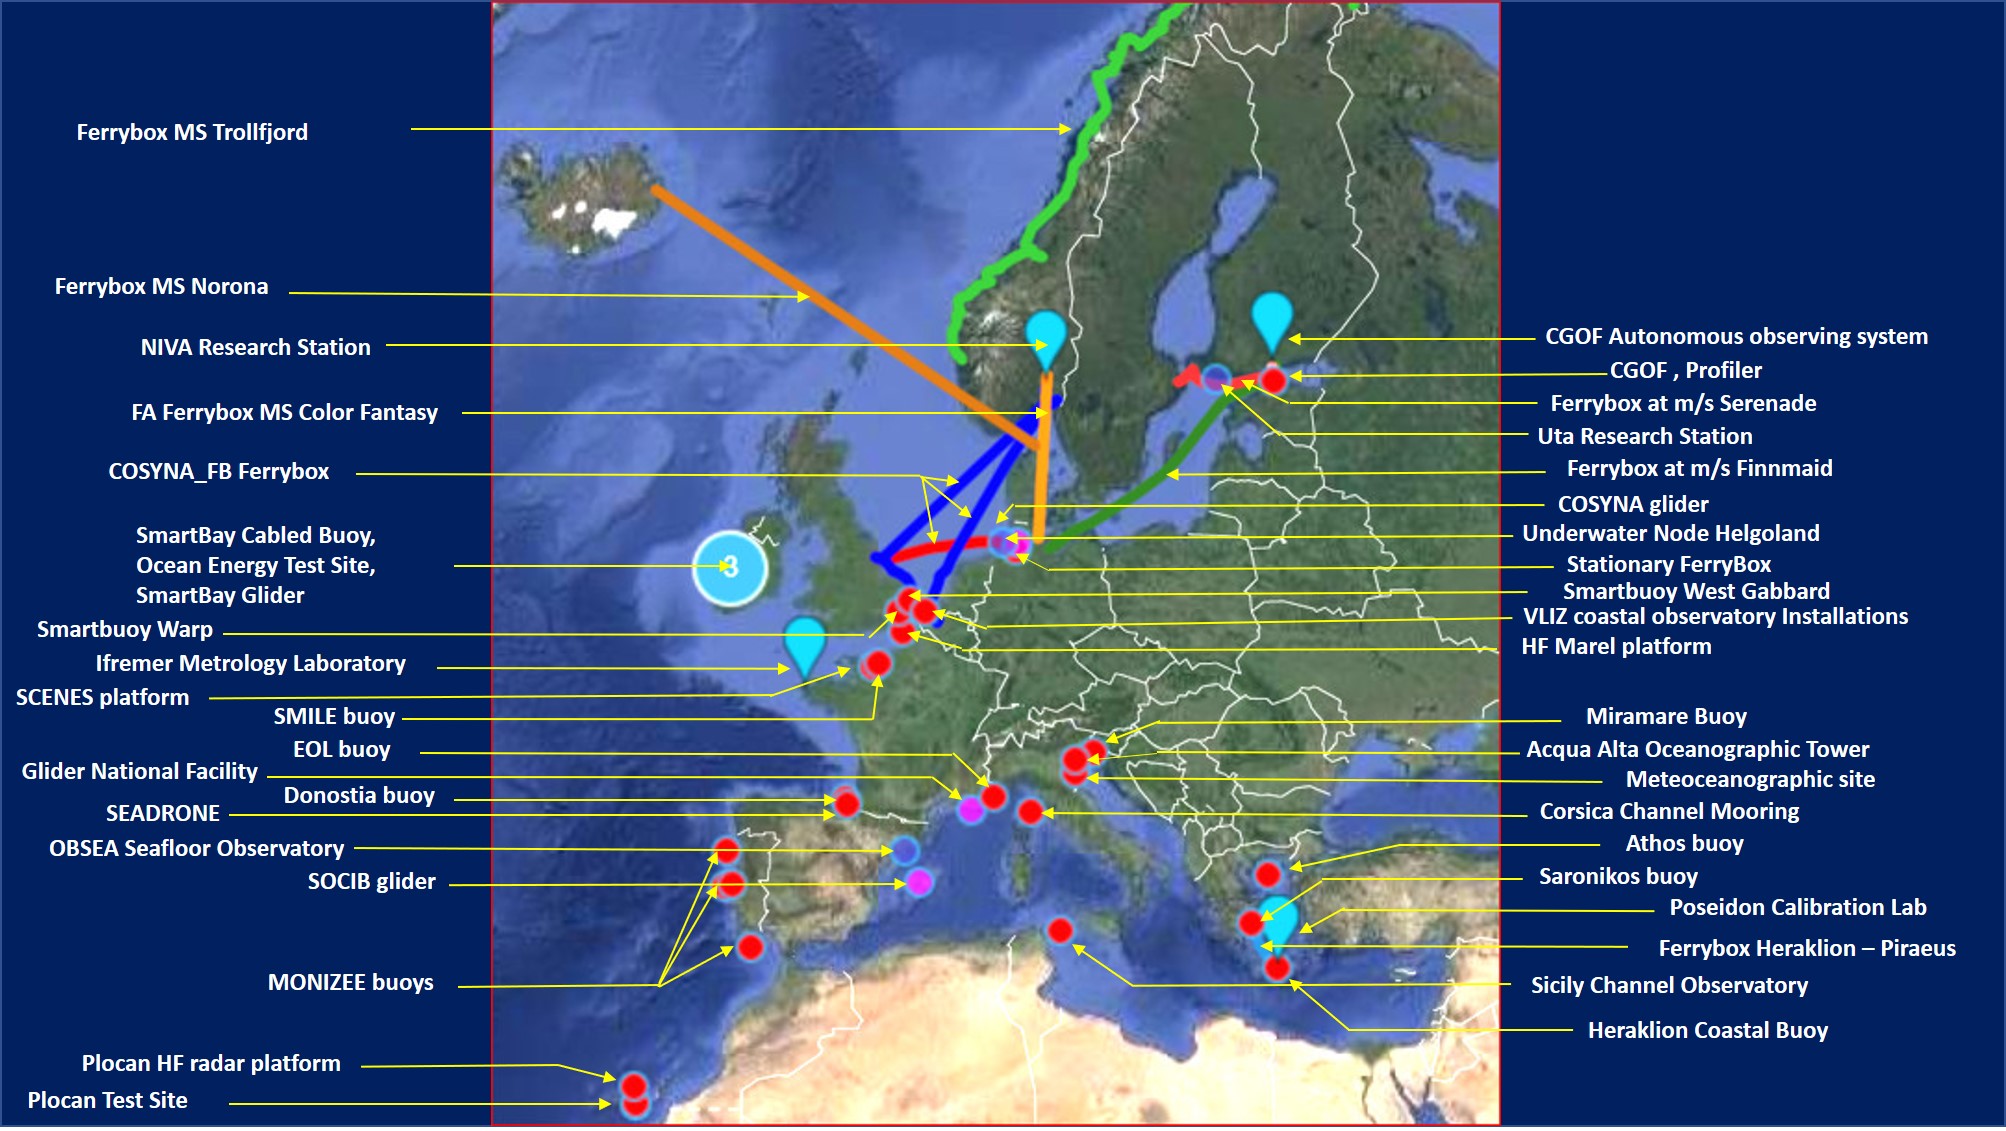
| 14:37, 18 August 2020 | EUmapObservatories.jpg (file) |  |
445 KB | Dronkers J | Location of field observatories participating in the JERICO network. | 1 |
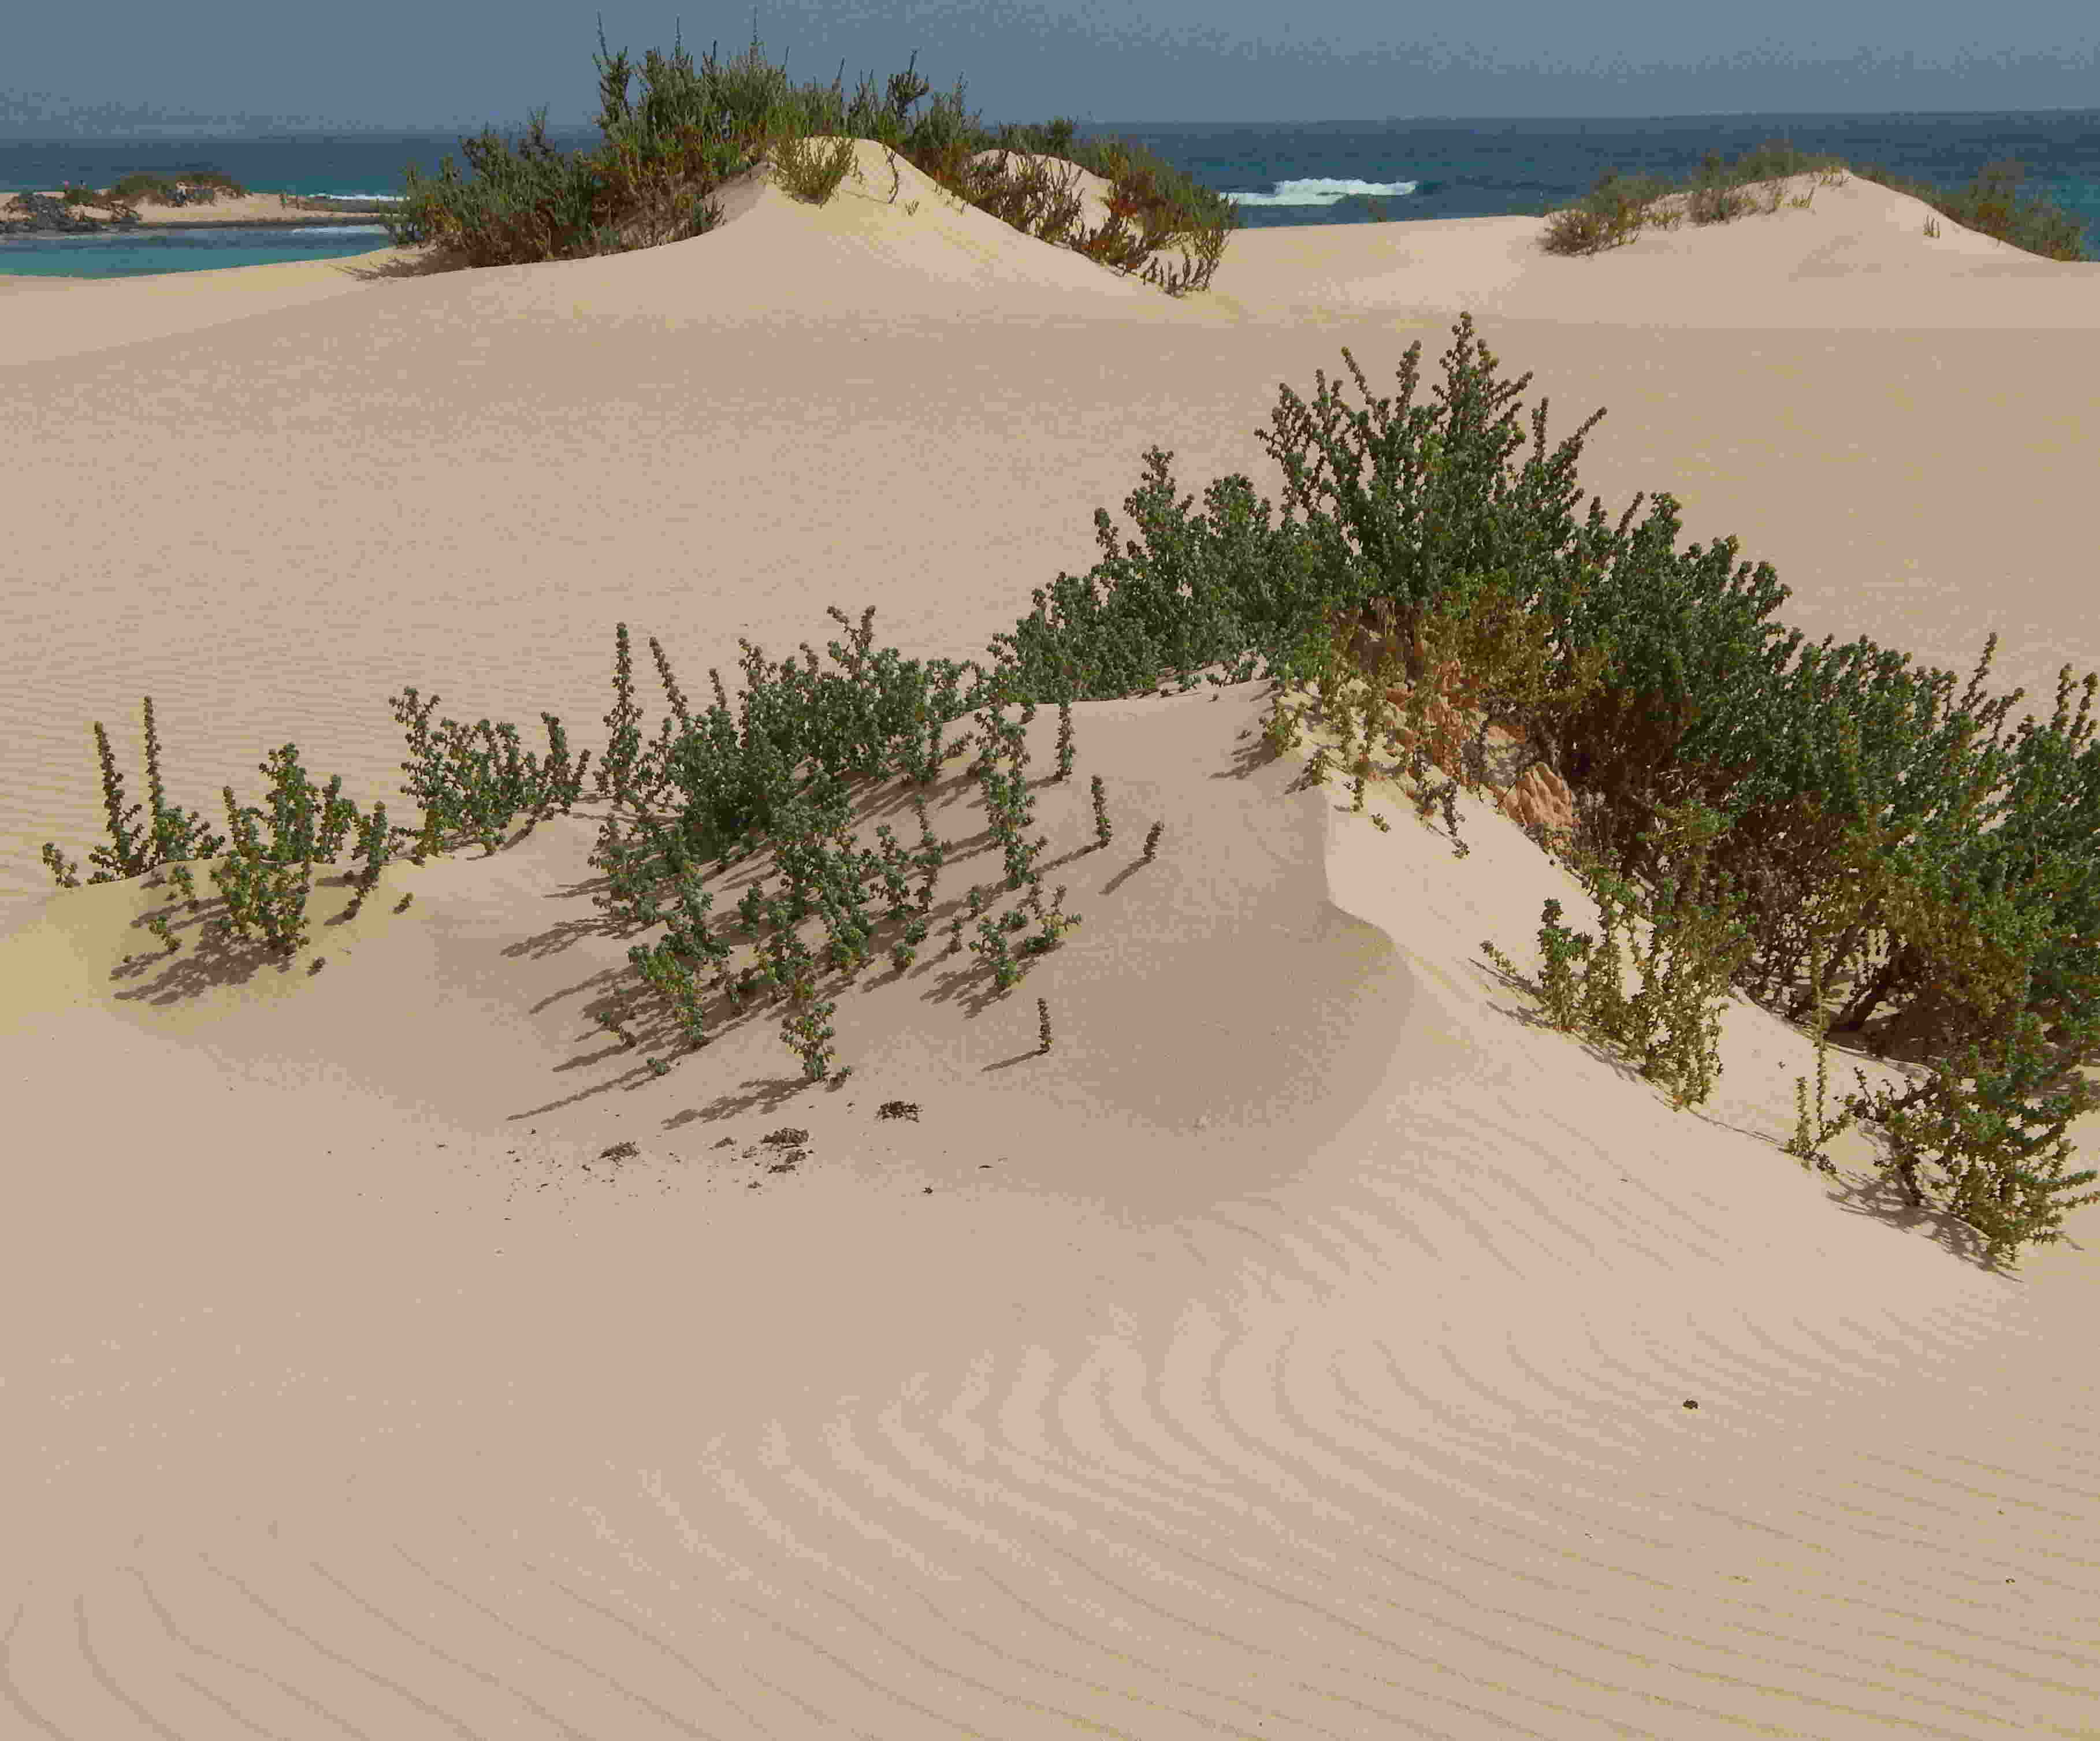
| 11:55, 6 August 2020 | TraganumMoquinii.jpg (file) |  |
206 KB | Dronkers J | Traganum Moquinii. | 1 |
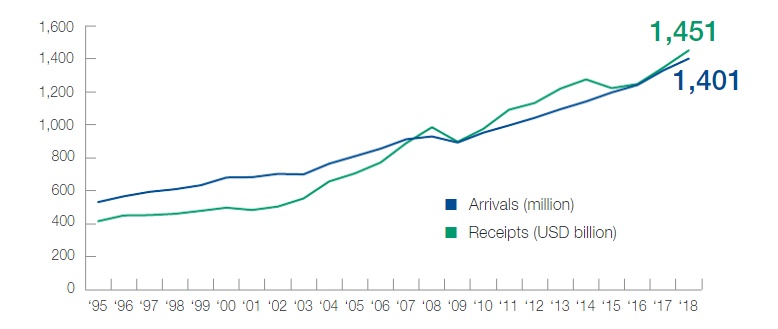
| 22:41, 8 July 2020 | TouristArrivals.jpg (file) |  |
54 KB | Dronkers J | International tourist arrivals (million) and tourism receipts (USD billion). | 1 |
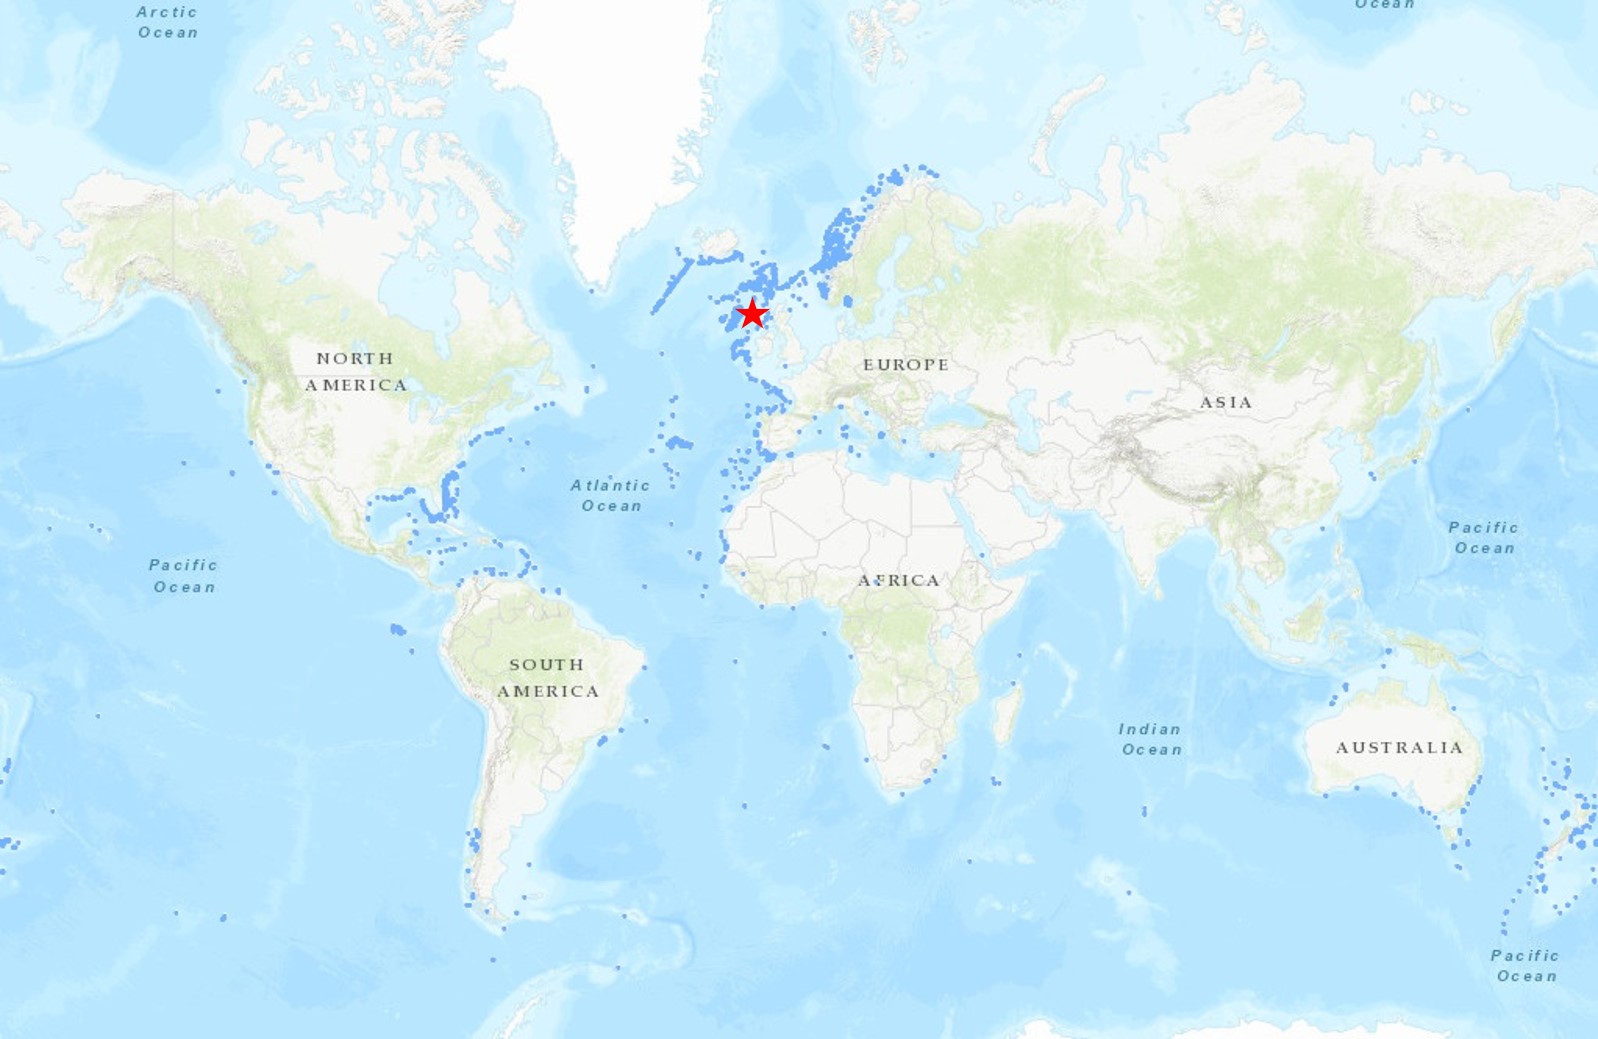
| 22:45, 6 July 2020 | ColdWaterReefMap AnthonDohrnSeamount.jpg (file) |  |
201 KB | Dronkers J | World map of cold water coral reefs (UNEP, 2003). The red star indicates Anthon Dohrn Seamount. | 1 |
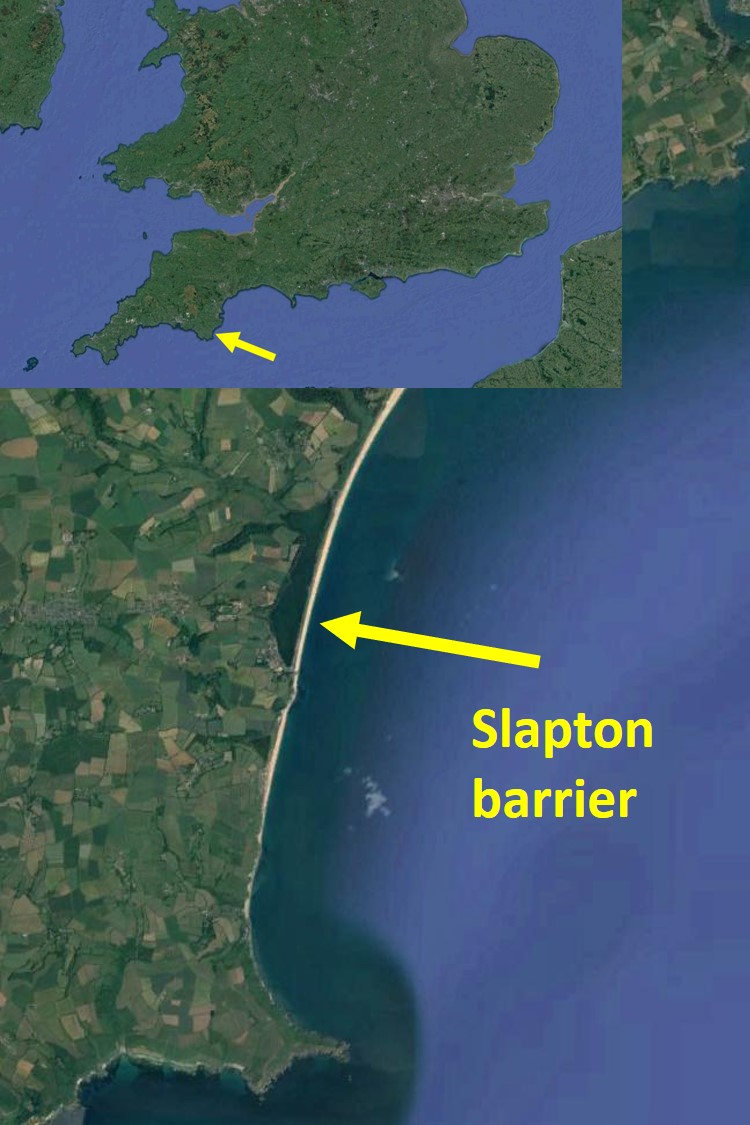
| 12:45, 6 July 2020 | Slapton.jpg (file) |  |
143 KB | Dronkers J | Location Slapton barrier. | 1 |