File list
This special page shows all uploaded files.
| Date | Name | Thumbnail | Size | User | Description | Versions |
|---|---|---|---|---|---|---|
| 20:39, 13 September 2021 | RotatingComponents.jpg (file) |  |
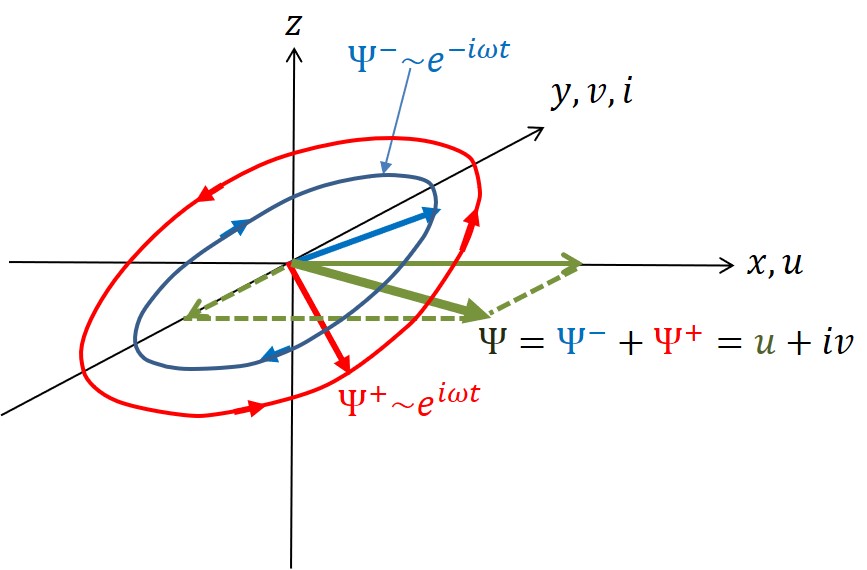
54 KB | Dronkers J | Definition of right-handed reference scheme with cyclonic and anticyclonic velocity components. | 1 |
| 15:08, 30 August 2021 | DuneBeltsGoeree2005.jpg (file) |  |
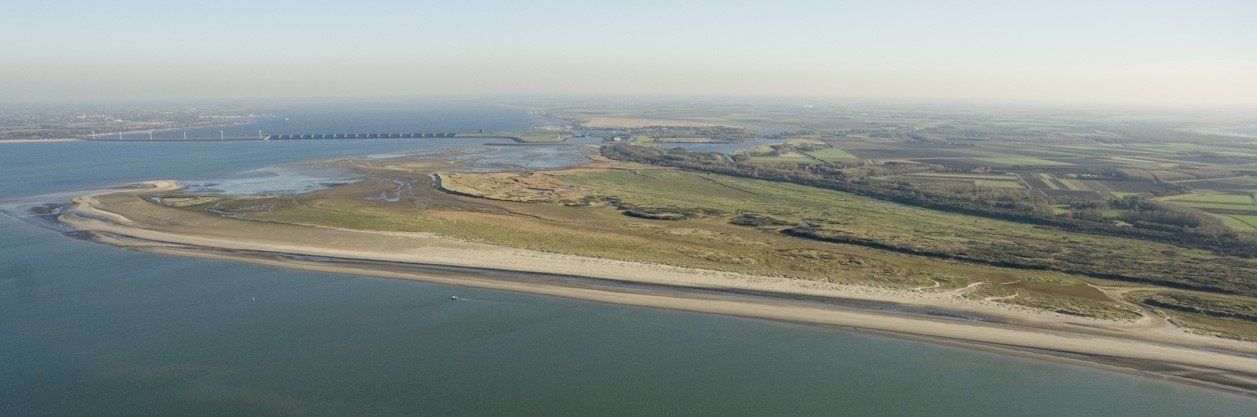
93 KB | Dronkers J | Following the construction of the Rhine discharge sluices ('Haringvliet sluices') in 1970, a strong progradation occurred at the adjacent coast of Goeree. The image from 2005 shows new dune ridges that formed on the accreted strand plain. Photo credit... | 1 |
| 15:07, 30 August 2021 | NebkhaMarramGrass.jpg (file) |  |
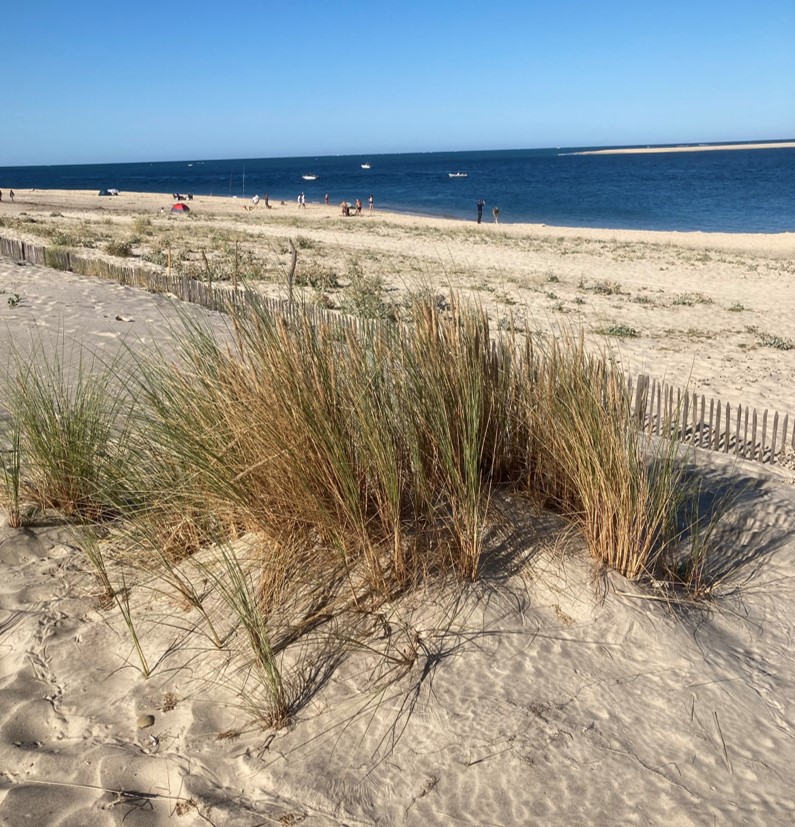
232 KB | Dronkers J | Development of an embryo dune induced by sand trapping marram grass (''Ammophila arenaria''). | 1 |
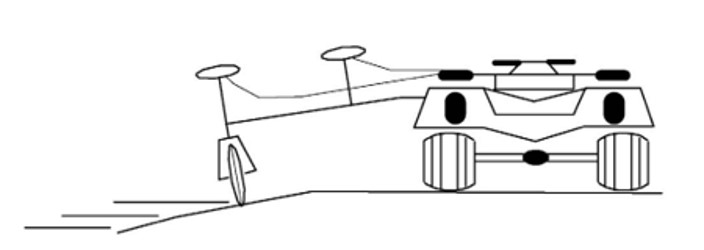
| 15:06, 30 August 2021 | BackshoreGroundwaterUpwelling.jpg (file) |  |
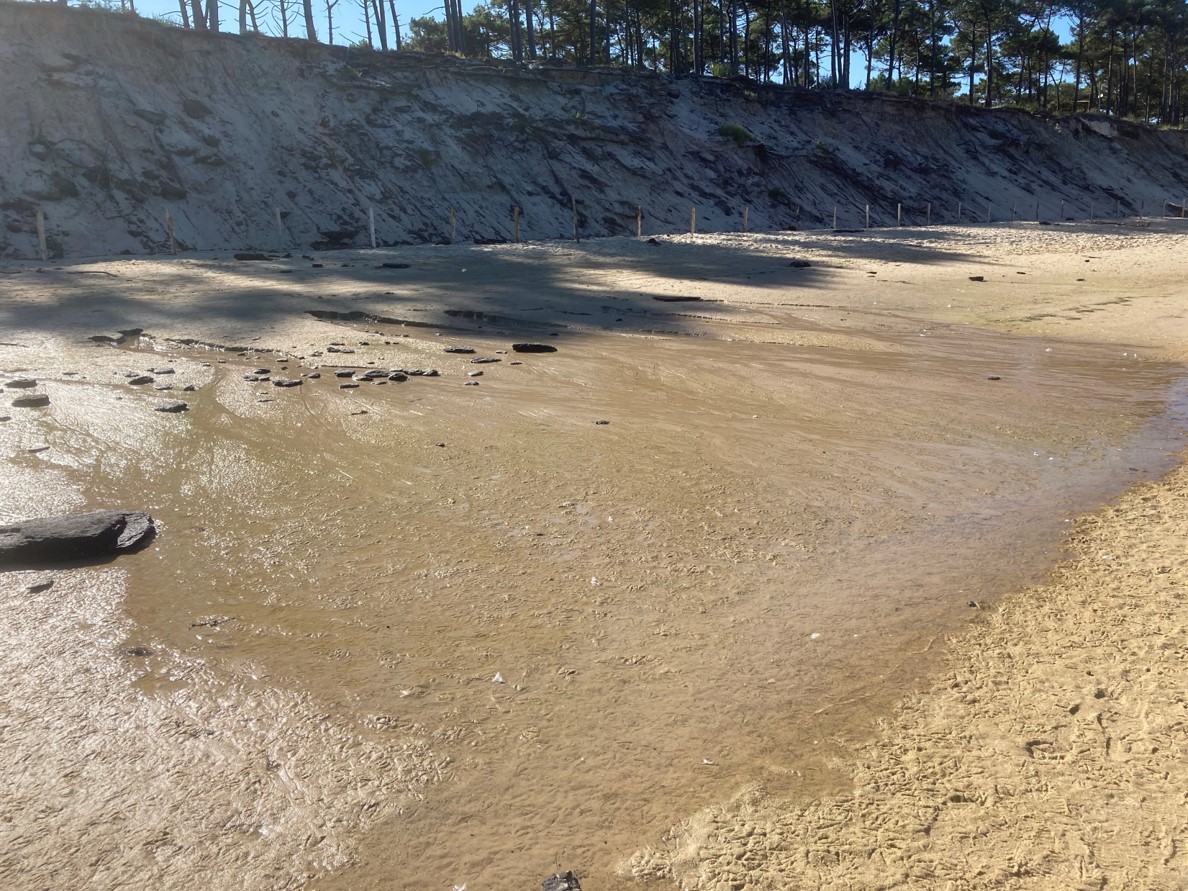
384 KB | Dronkers J | Backshore groundwater upwelling, near the foot of the eroded dune face, Aquitaine coast, France. | 1 |
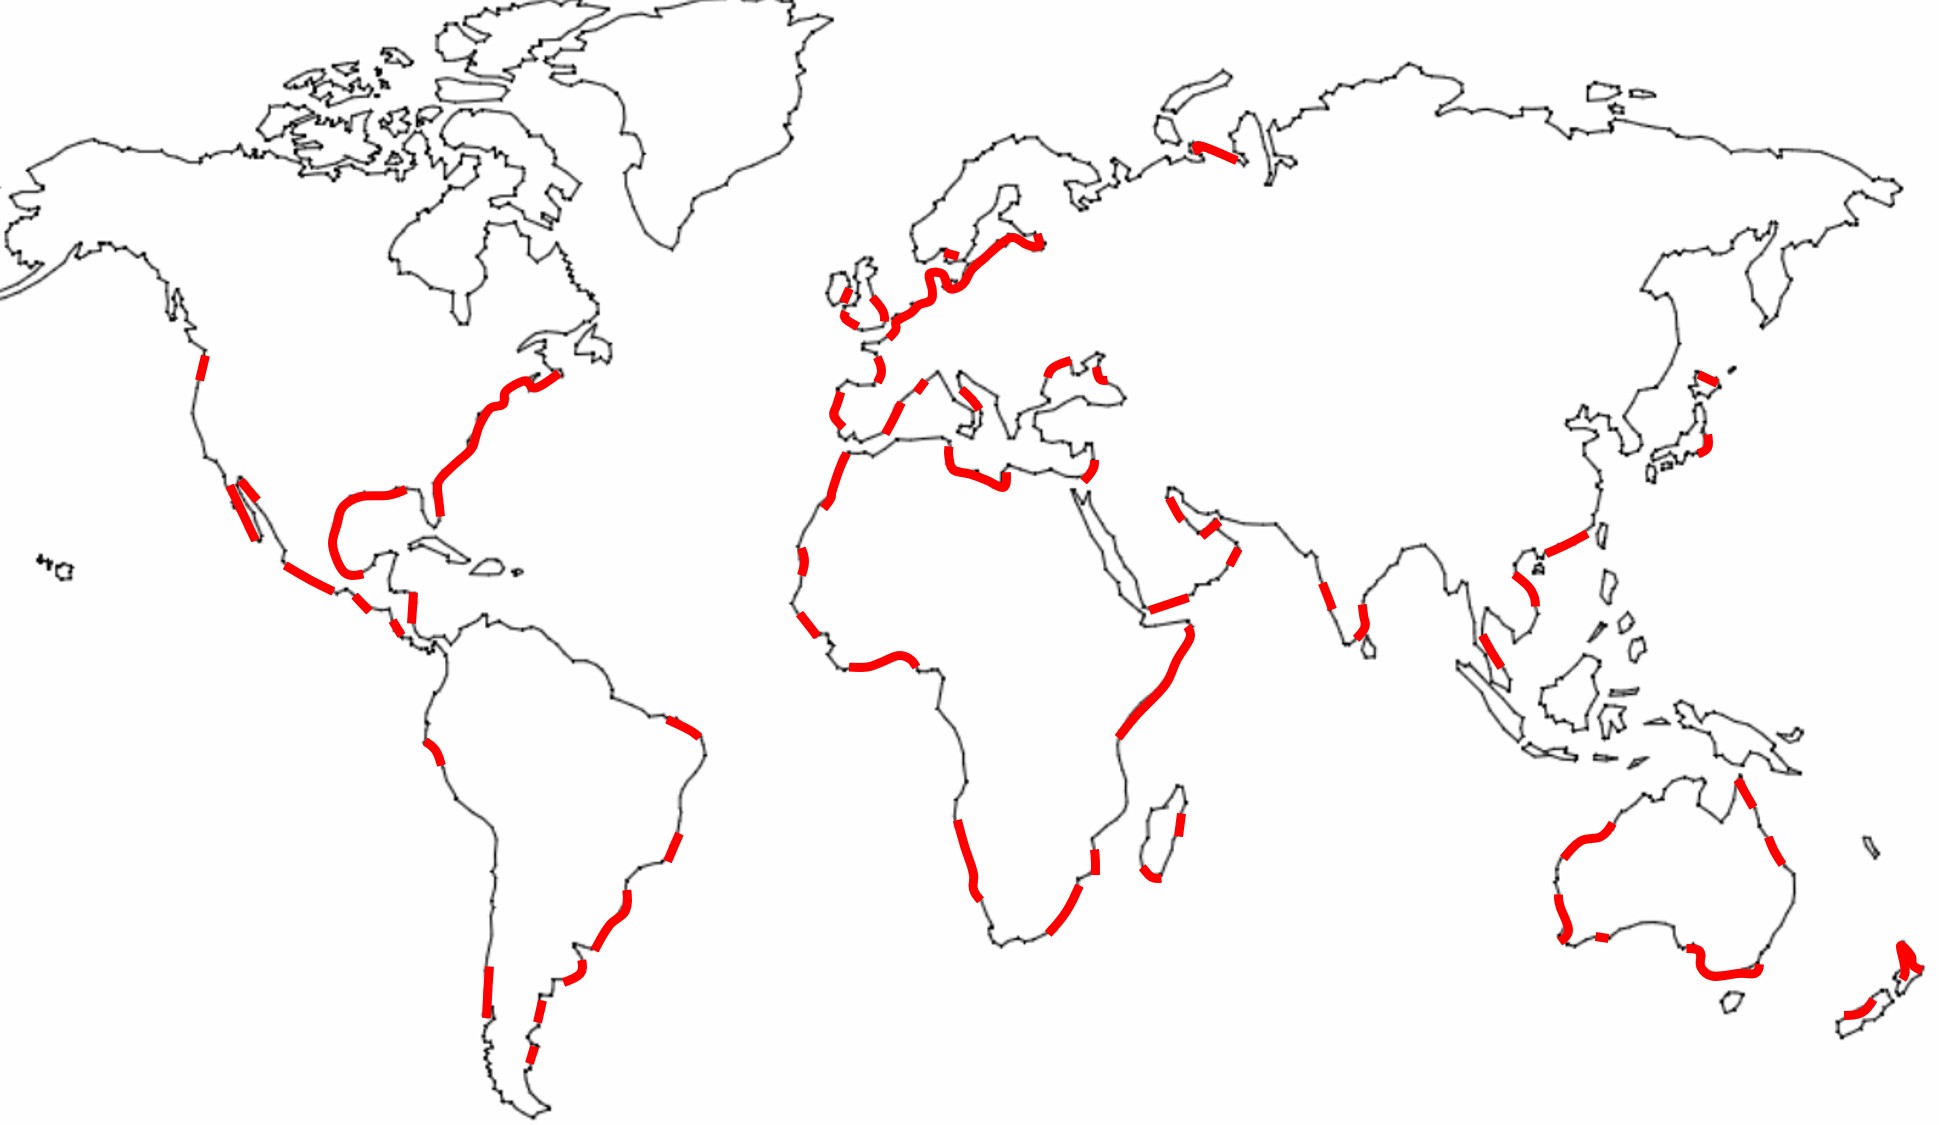
| 15:05, 30 August 2021 | WorldDuneMap.jpg (file) |  |
169 KB | Dronkers J | World map of coastal zones where well-developed coastal dune belts occur. Adapted from Martinez and Psuty (2008) | 1 |
| 17:33, 17 August 2021 | FlocDepositionFlux.jpg (file) |  |
85 KB | Dronkers J | Deposition flux of flocculated sediment from the San Francisco Bay tested in a flume (modified from Mehta, A.J., Manning, A.J. and Khare, Y.P. 2014. A note of the Krone deposition equation and significance of floc aggregation, Marine Geology 354: 34-39) | 2 |
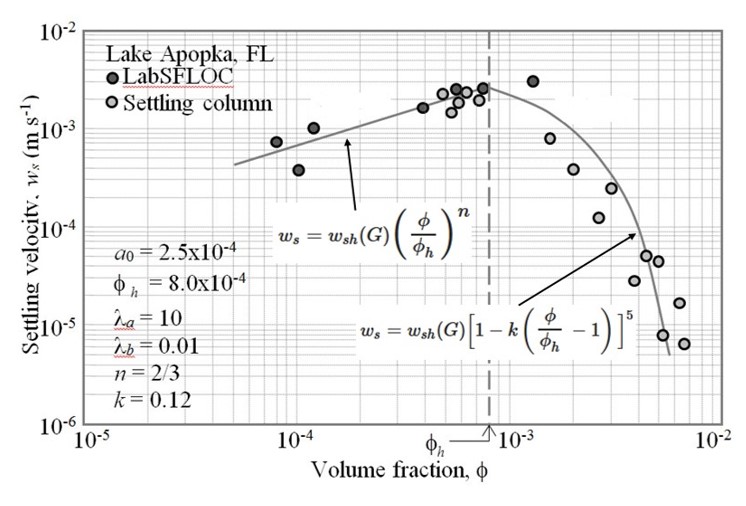
| 17:31, 17 August 2021 | HinderedFlocSettling.jpg (file) |  |
80 KB | Dronkers J | Settling velocity as a function of volume fraction; data from Lake Apopka. | 2 |
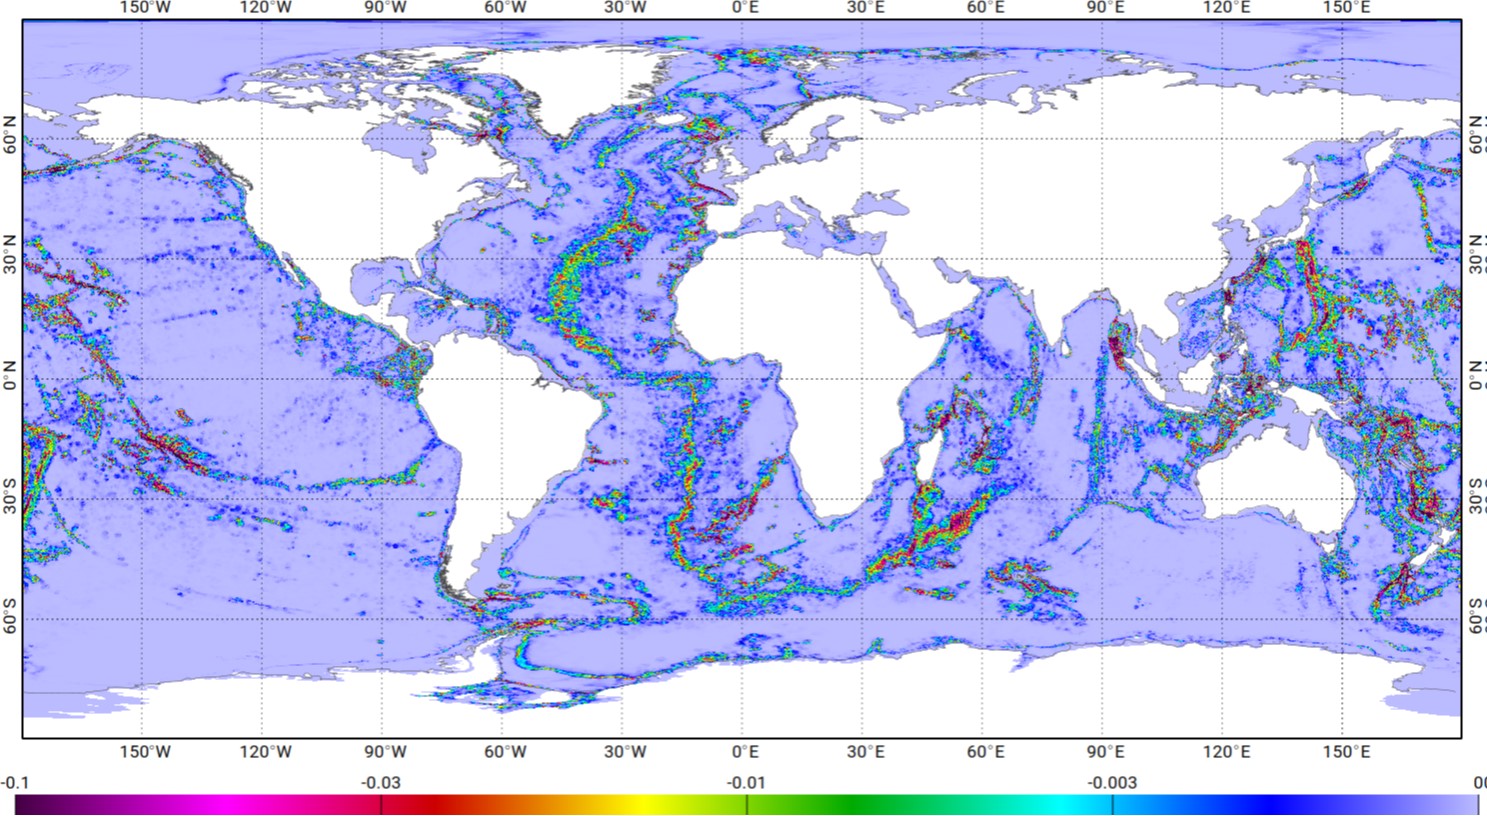
| 21:55, 10 August 2021 | M2BaroclinicDissipationFES.jpg (file) |  |
351 KB | Dronkers J | M2 barotropic energy conversion rate (W/m2) toward baroclinic internal tides computed from the FES2014 hydrodynamic model. From Lyard et al. (2021) Creative Commons Licence. | 1 |
| 21:54, 10 August 2021 | M2EnergyDissipationFES.jpg (file) |  |
330 KB | Dronkers J | Energy (W/m2) dissipated by bottom friction in the FES2014 hydrodynamic model for the M2 wave. From Lyard et al. (2021) Creative Commons Licence. | 1 |
| 22:55, 26 July 2021 | ResistanceResilienceSystemEvolution.jpg (file) |  |
163 KB | Dronkers J | Schematic plot of the (eco)system response to a temporal change in environmental conditions that exert a pressure (red) on the system. The time evolution of the ecosystem state is represented by blue lines corresponding to different resistance-resilien... | 1 |
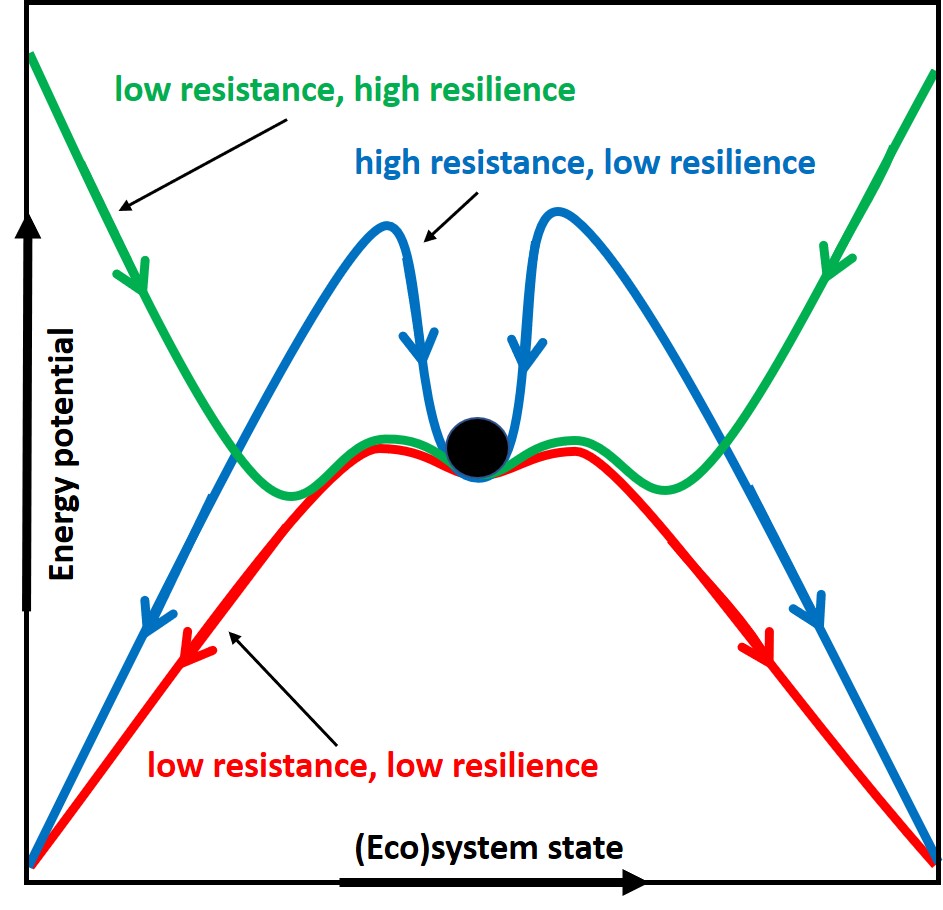
| 22:54, 26 July 2021 | ResistanceResiliencePotential.jpg (file) |  |
125 KB | Dronkers J | Schematic plot of different combinations of resistance and resilience, where the ecosystem state is represented by a black marble and the resistance-resilience characteristics by a fictitious energy potential. | 1 |
| 12:32, 13 June 2021 | GPS shoreline.jpg (file) |  |
19 KB | Dronkers J | GPS shoreline monitoring. | 1 |
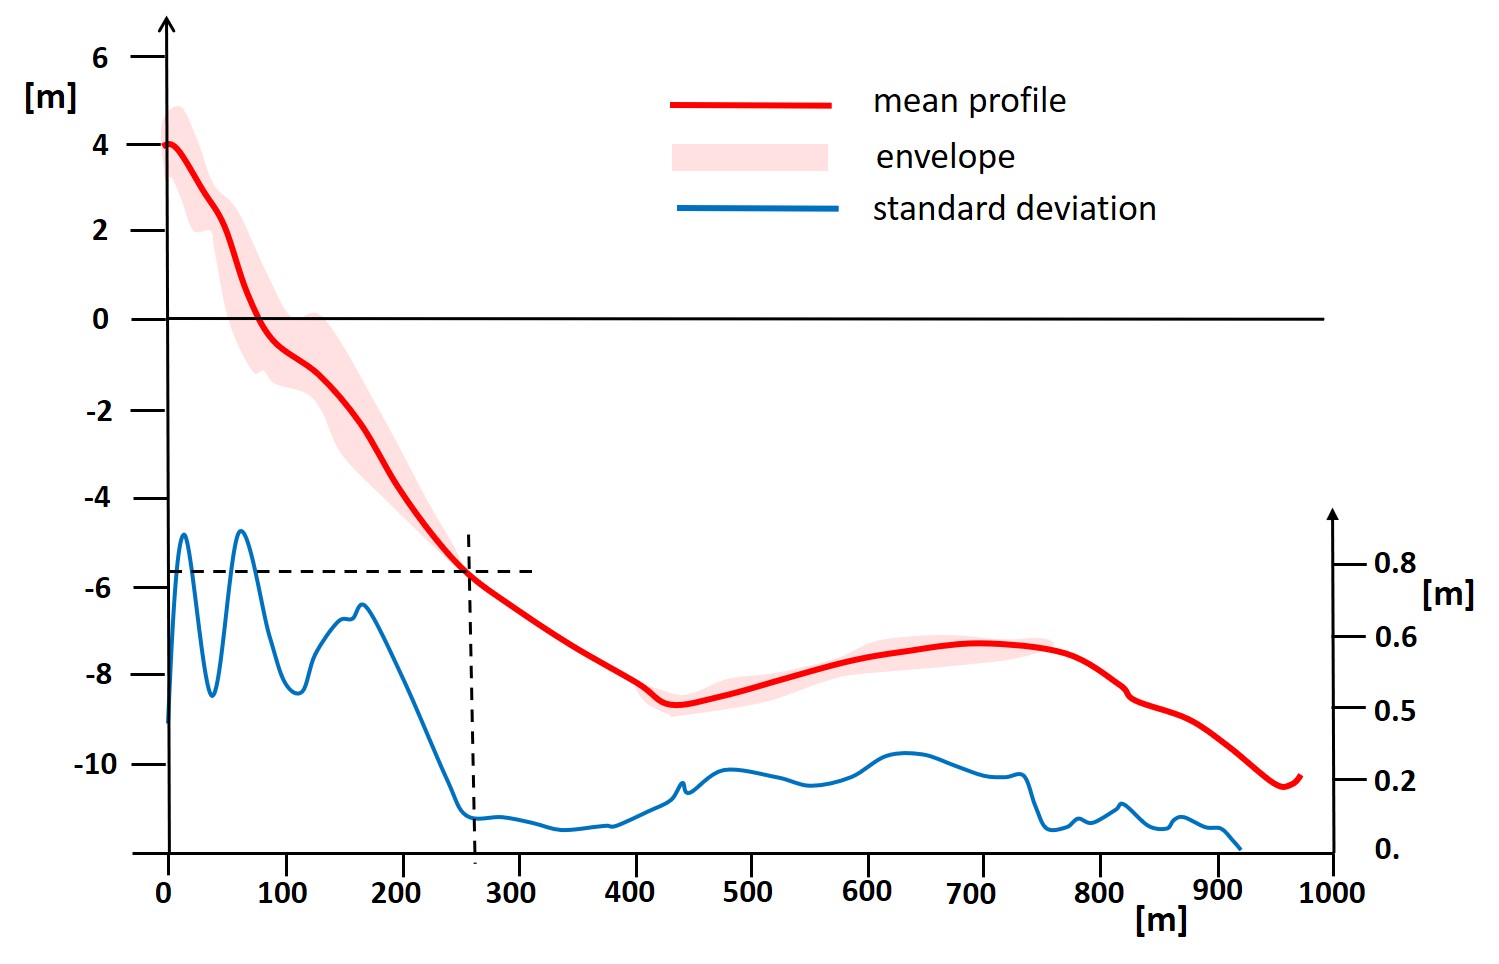
| 12:43, 12 June 2021 | OceanCityProfiles.jpg (file) |  |
114 KB | Dronkers J | Mean, envelope and standard deviation of profile survey elevations 56th Street, Ocean City, Maryland, from Krauss et al. (1998). | 1 |
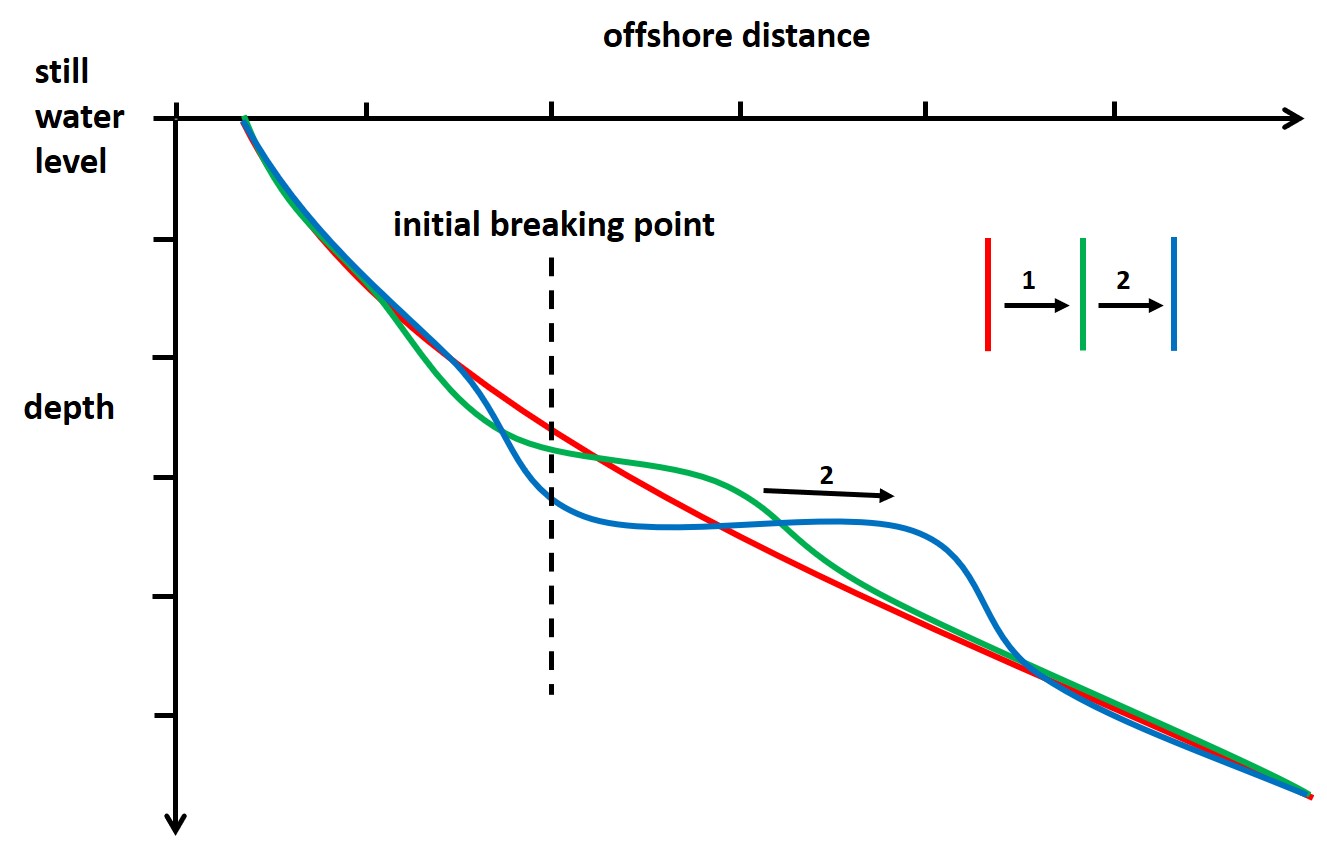
| 21:17, 1 June 2021 | BarFormation.jpg (file) |  |
82 KB | Dronkers J | Profiles (green and blue) schematically representing two successive stages of bar formation by wave breaking on an initially non-barred shoreface (red). | 1 |
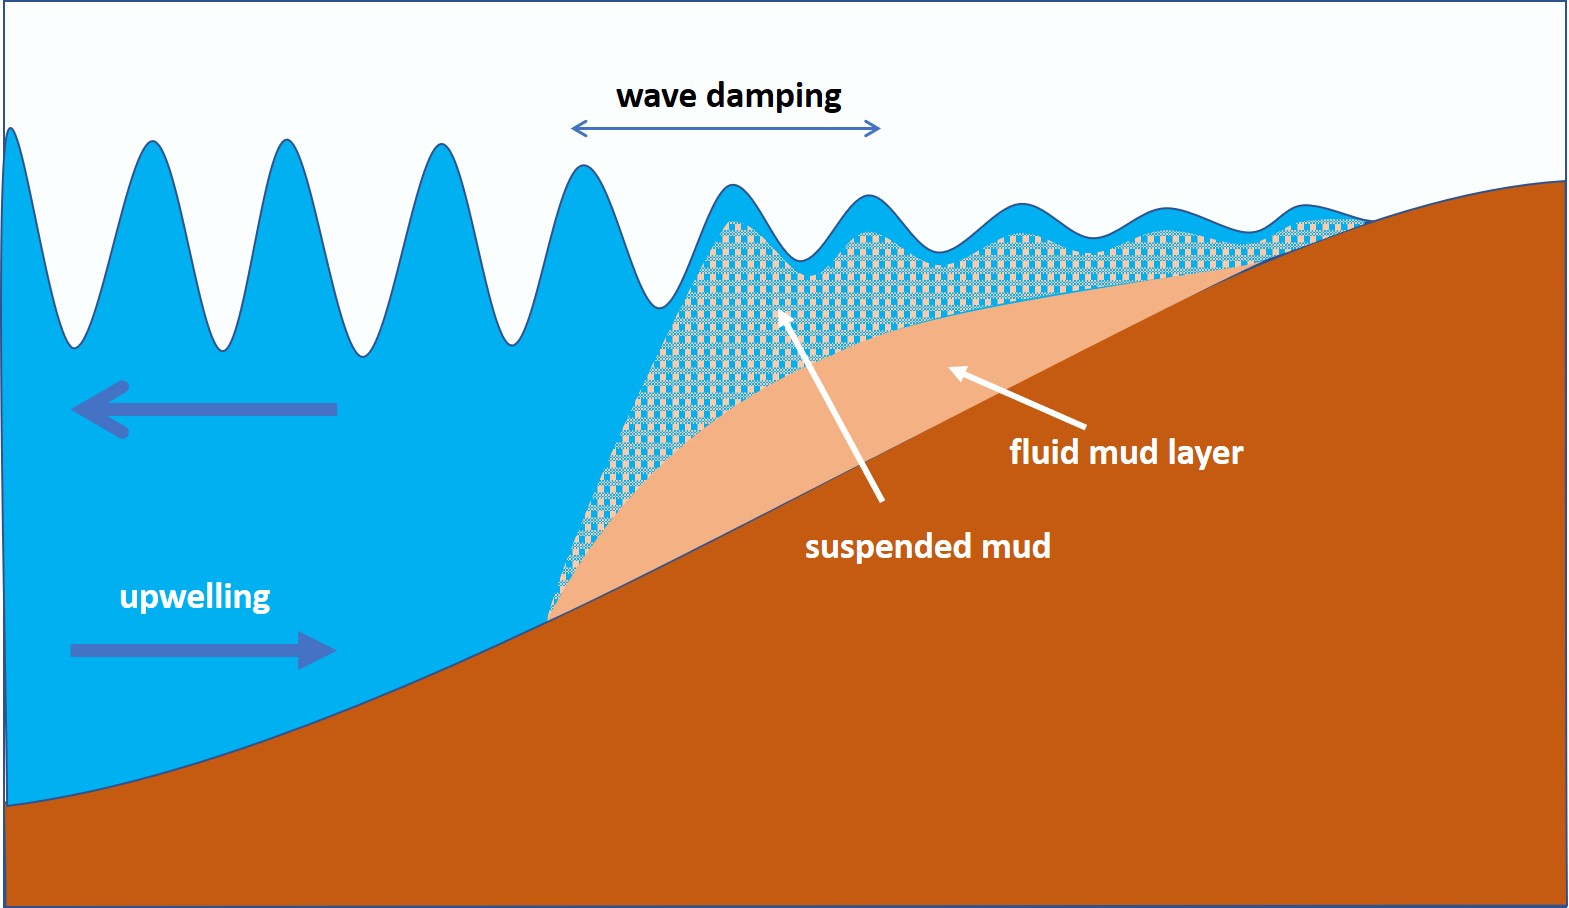
| 15:29, 15 May 2021 | FluidMudWaveDamping1.jpg (file) |  |
138 KB | Dronkers J | Schematic representation of wave damping by a fluid mud layer (strongly exaggerated vertical scale). | 1 |
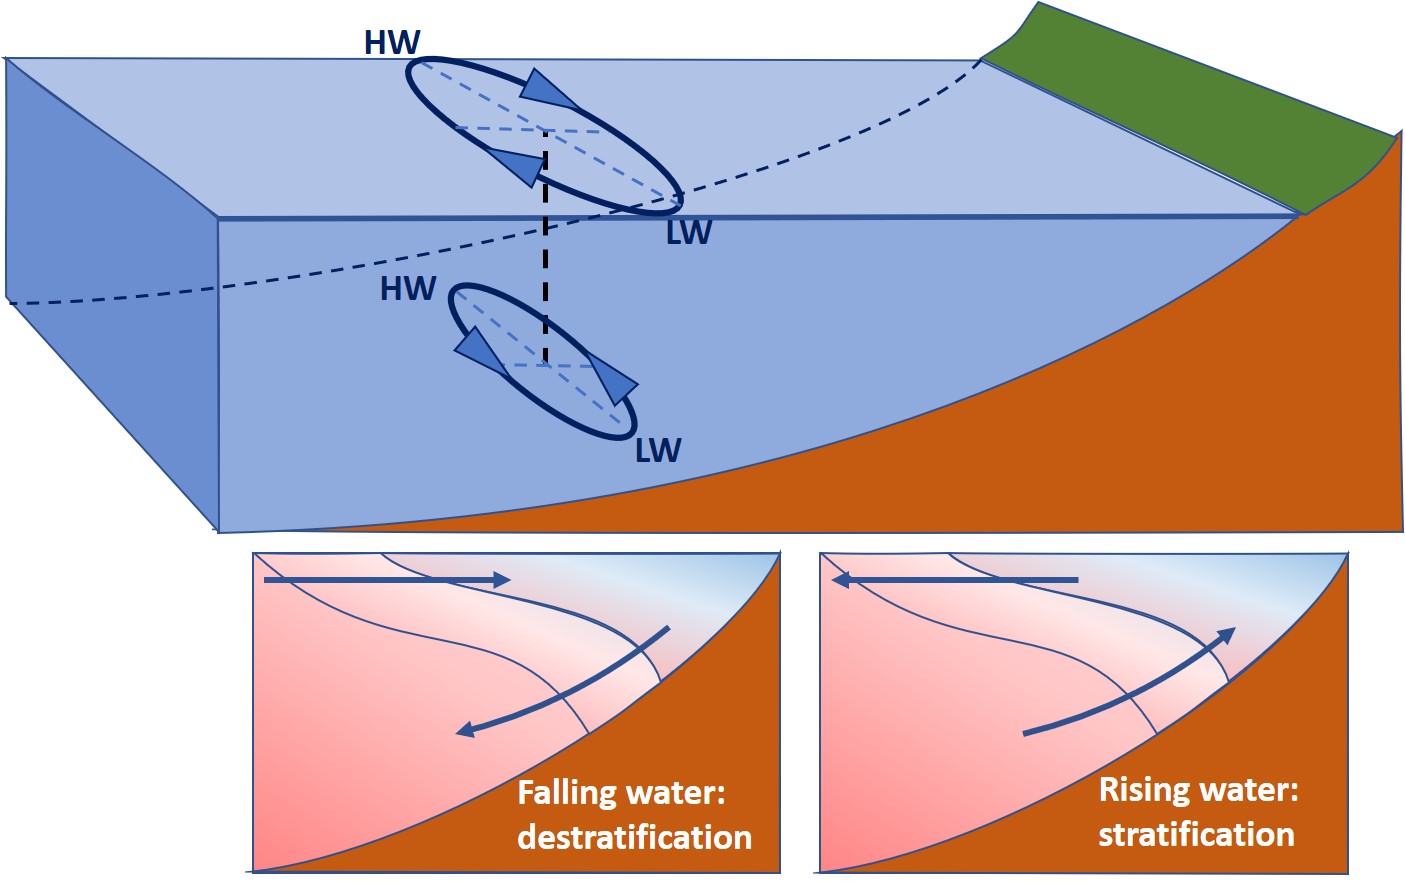
| 13:01, 14 May 2021 | GeoTidalStraitication.jpg (file) |  |
131 KB | Dronkers J | Top: Near-surface and near-bottom current ellipses of a progressive longshore tidal wave. Bottom: Resulting tilting of haloclines during falling tide and rising tide. | 1 |
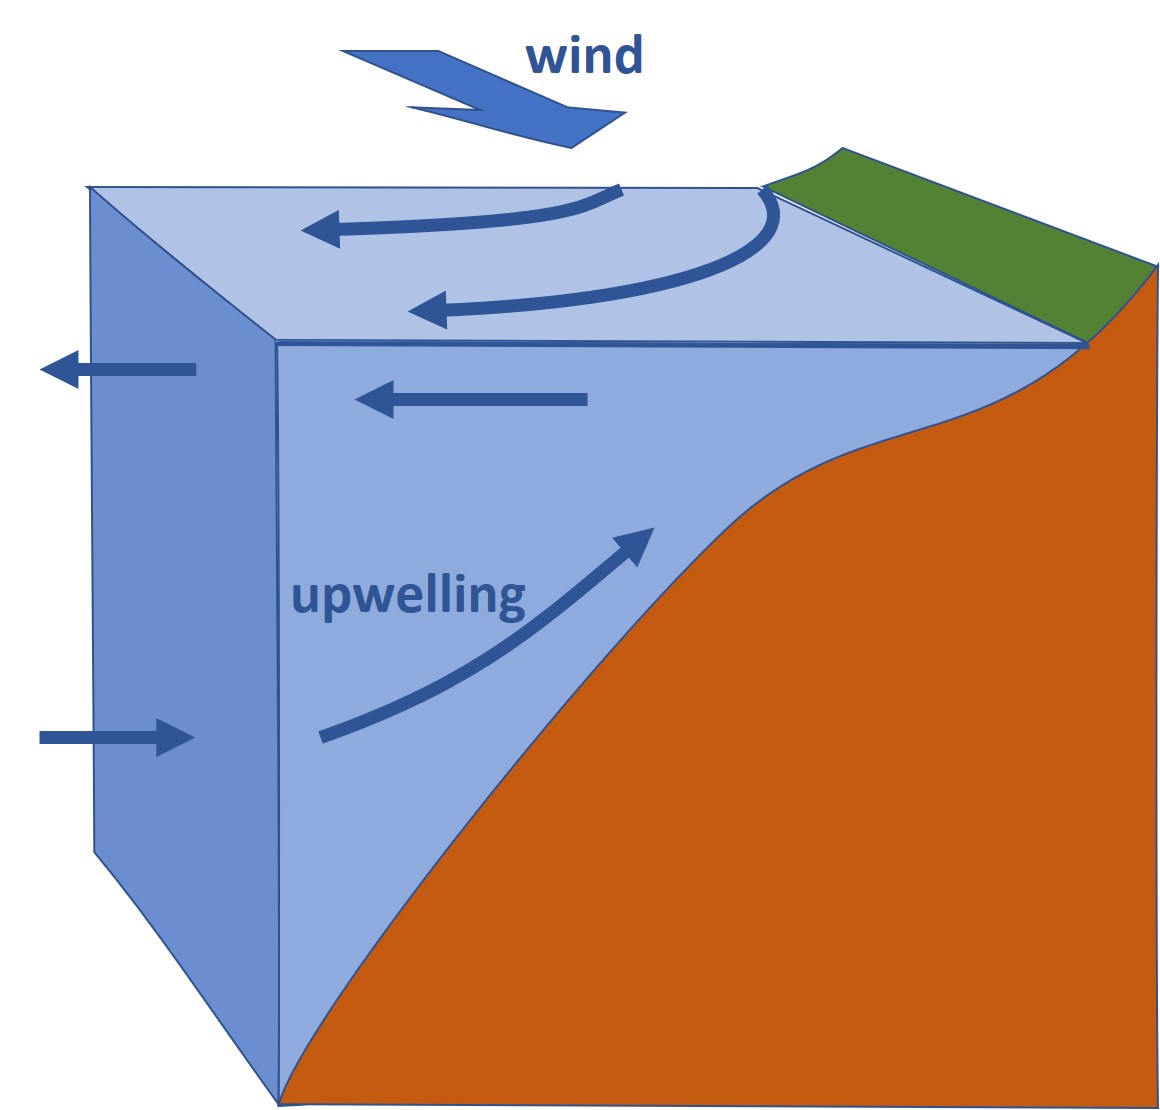
| 15:36, 3 May 2021 | UpwellingEkman.jpg (file) |  |
75 KB | Dronkers J | Principle of coastal upwelling by Ekman transport. | 1 |
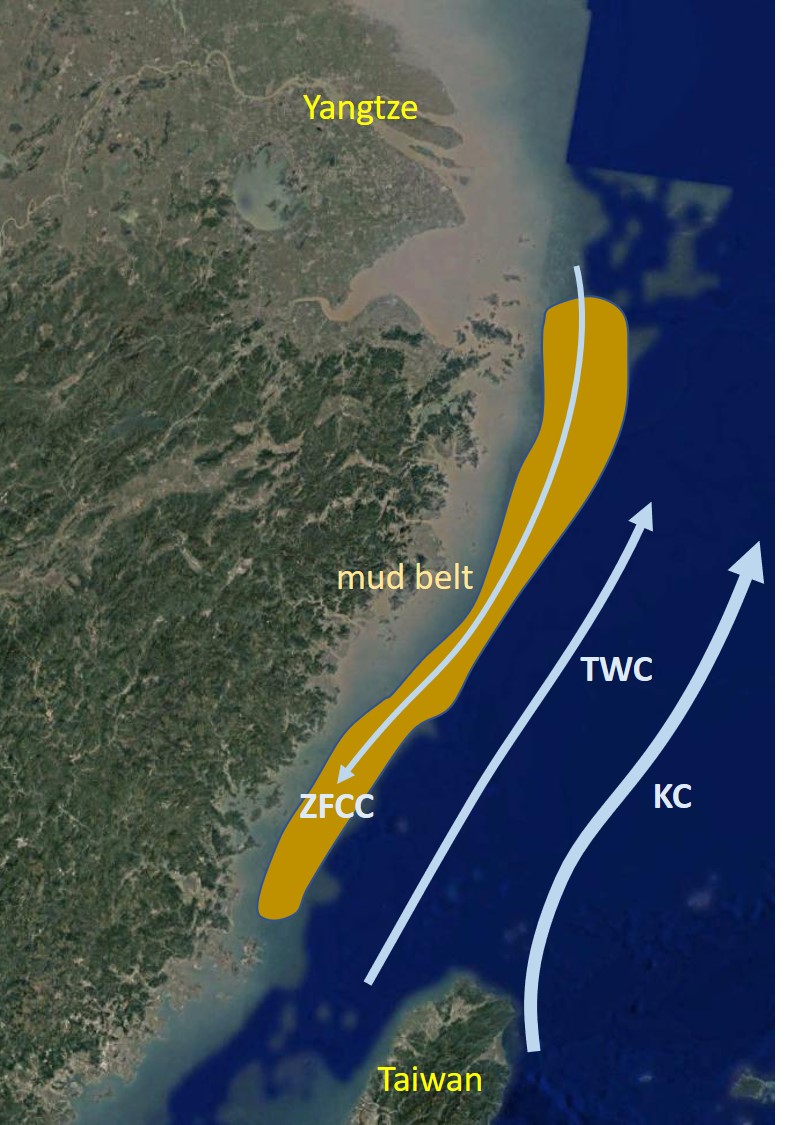
| 11:57, 1 May 2021 | EastChinaMudBelt.jpg (file) |  |
178 KB | Dronkers J | Location of the mud belt on the East China Sea shelf. | 1 |
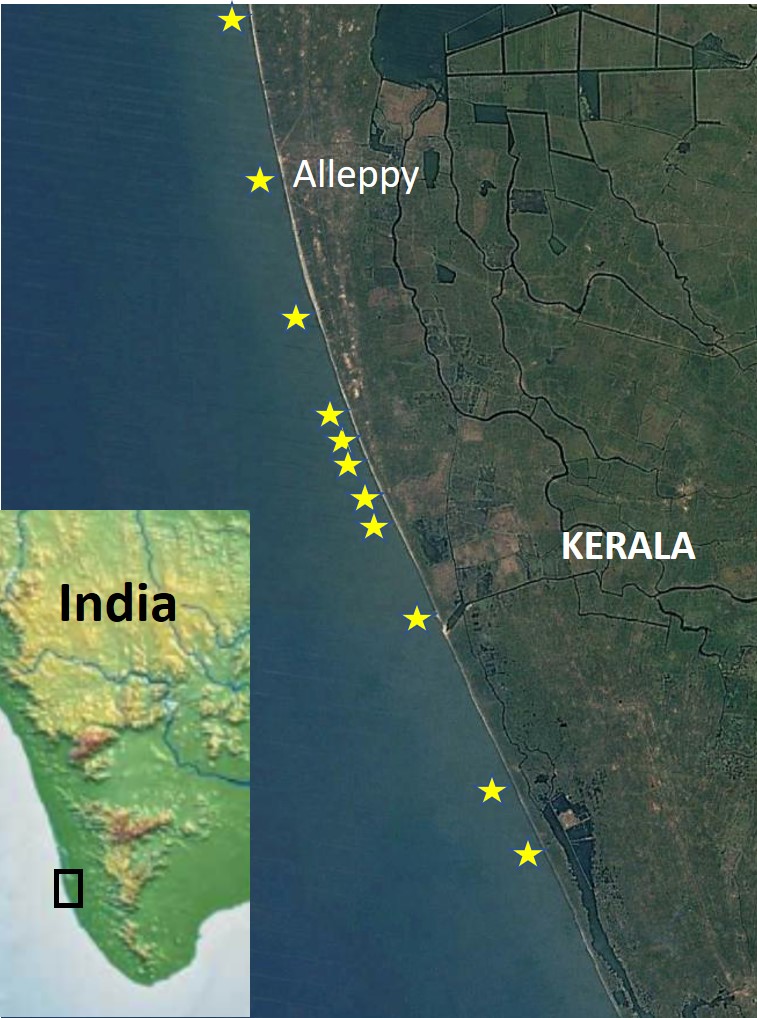
| 11:56, 1 May 2021 | KeralaMudBanks.jpg (file) |  |
163 KB | Dronkers J | Locations along the coast of Kerala (southwest India) where mud banks are observed. | 1 |
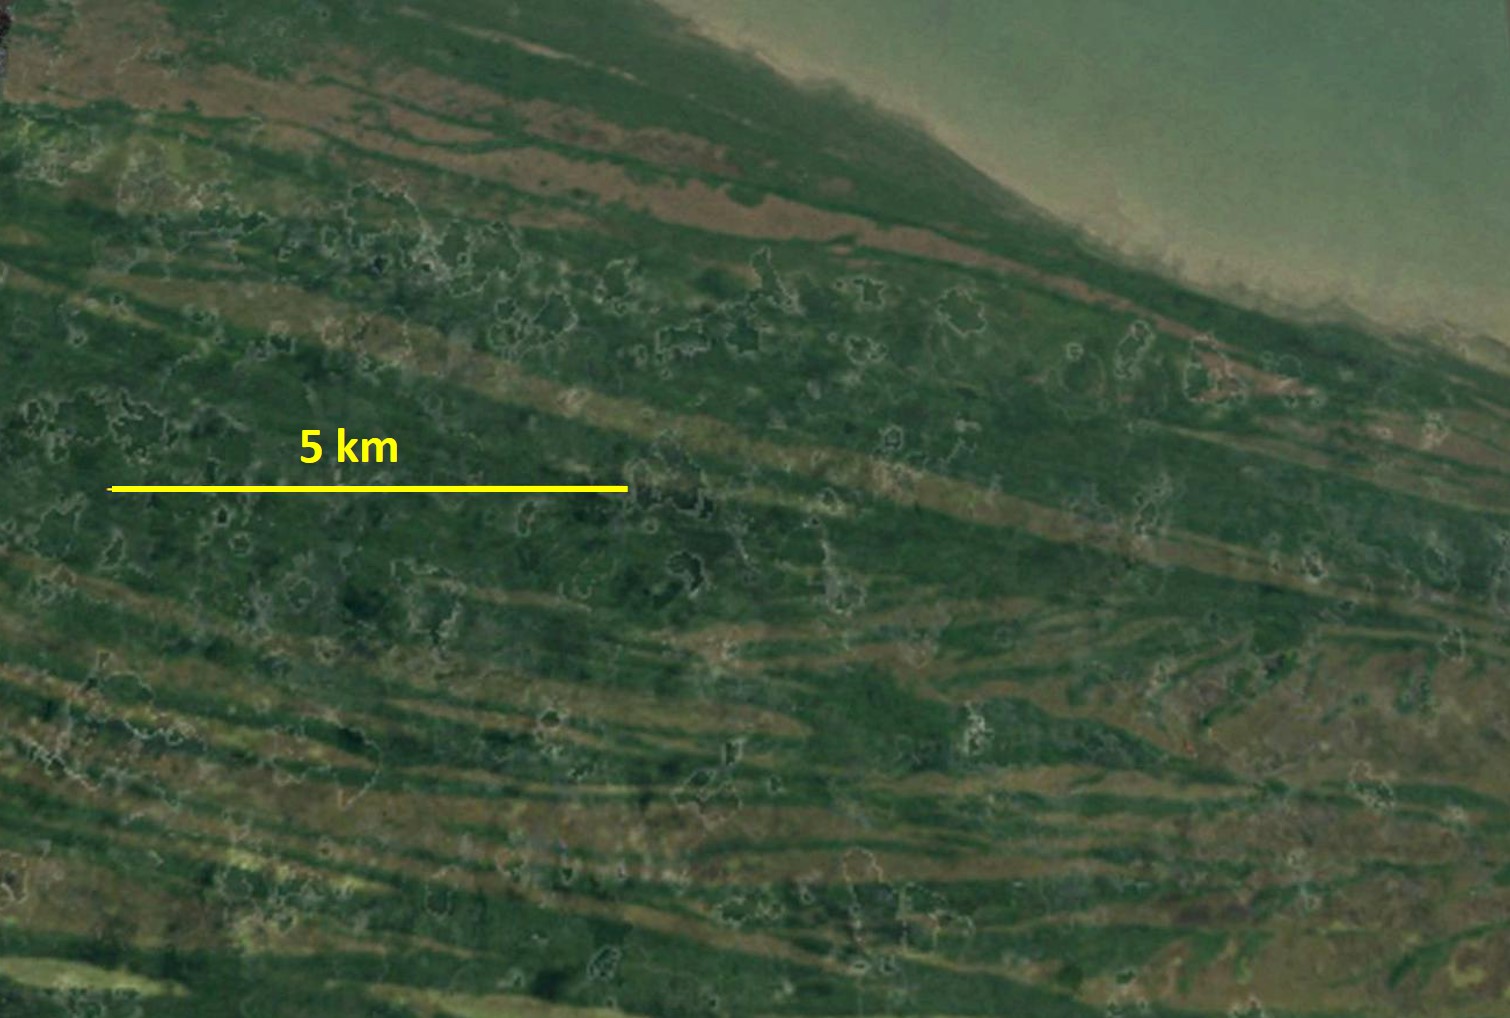
| 11:56, 1 May 2021 | ChenierPlainSurinam.jpg (file) |  |
215 KB | Dronkers J | Satellite picture of a chenier plain in Surinam. The cheniers are the brown stripes on the image. | 1 |
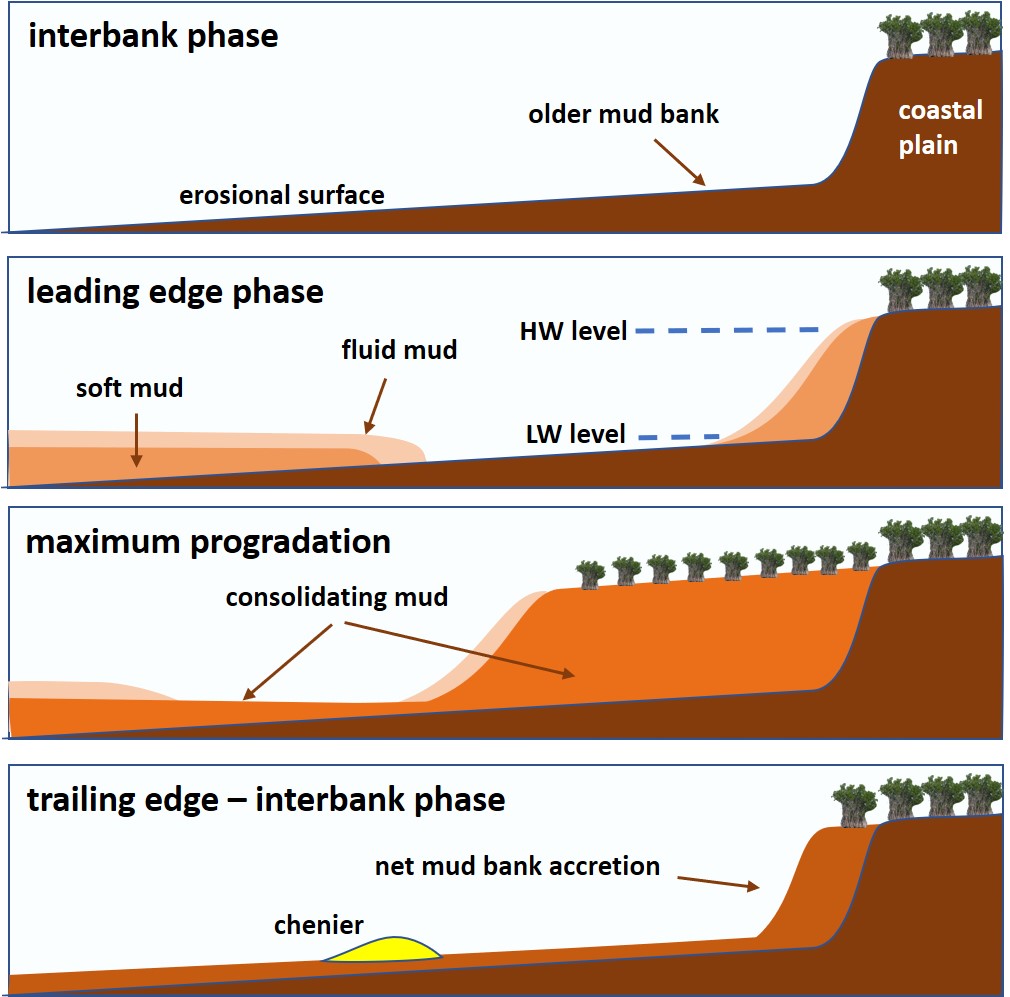
| 11:54, 1 May 2021 | BankAccretionCycle.jpg (file) |  |
153 KB | Dronkers J | Schematic representation of the different phases of the accretion-erosion cycle related to the passage of mud banks along the Guyana coast. | 1 |
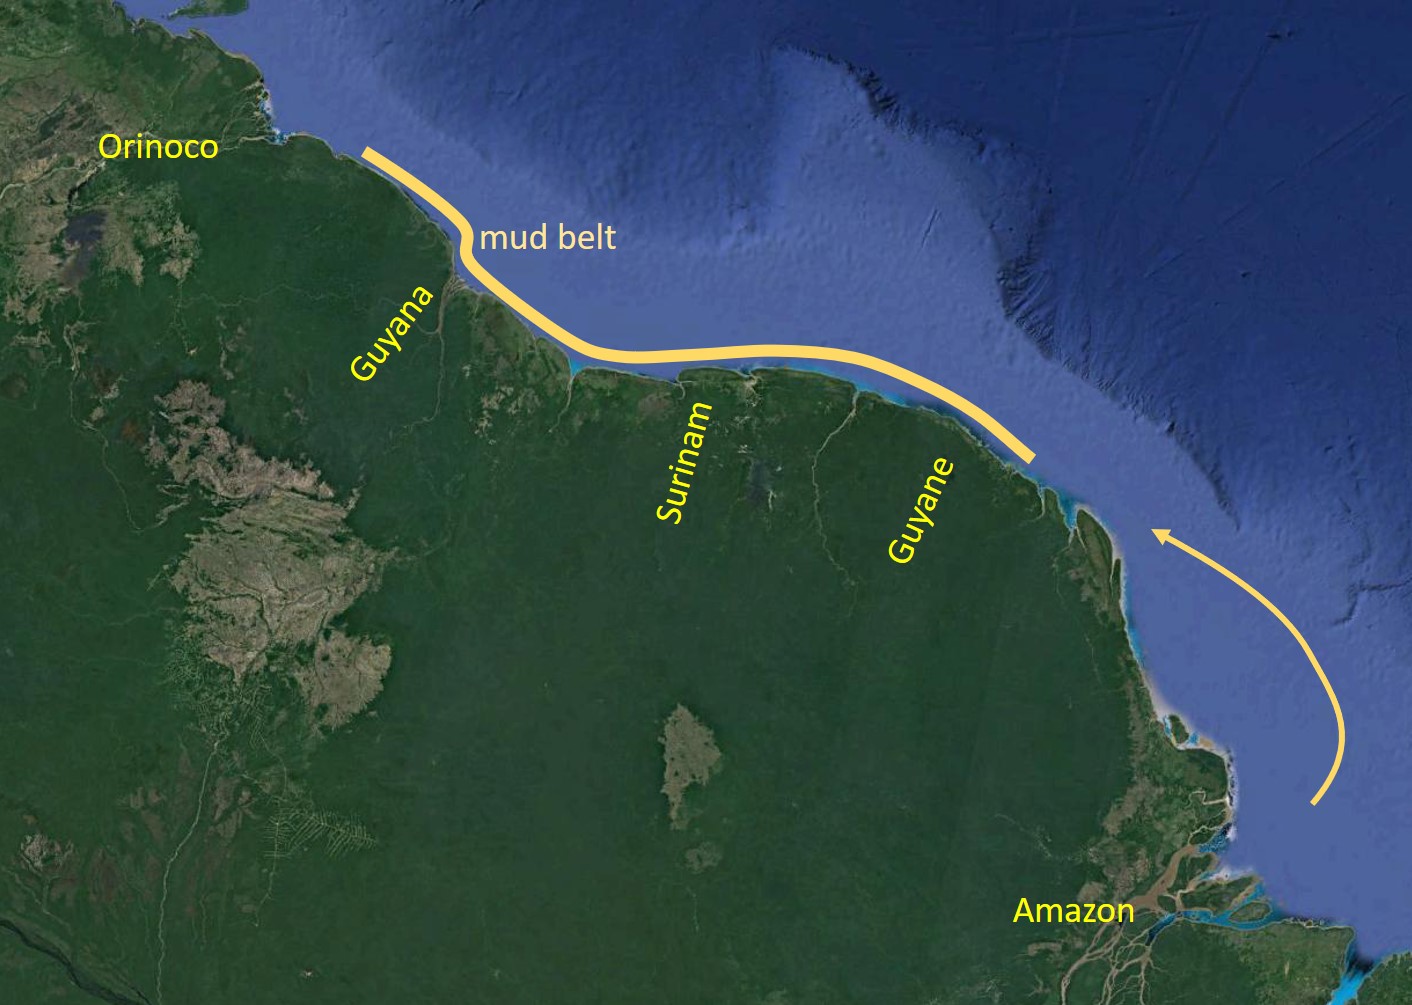
| 11:53, 1 May 2021 | GuyanasMudBelt.jpg (file) |  |
216 KB | Dronkers J | Mud belt along the northern coast of South America. | 1 |
| 11:52, 1 May 2021 | CrossShoreGravitationalCirculation.jpg (file) |  |
83 KB | Dronkers J | Schematic representation of cross-shore gravitational circulation driven by a cross-shore salinity gradient. | 1 |
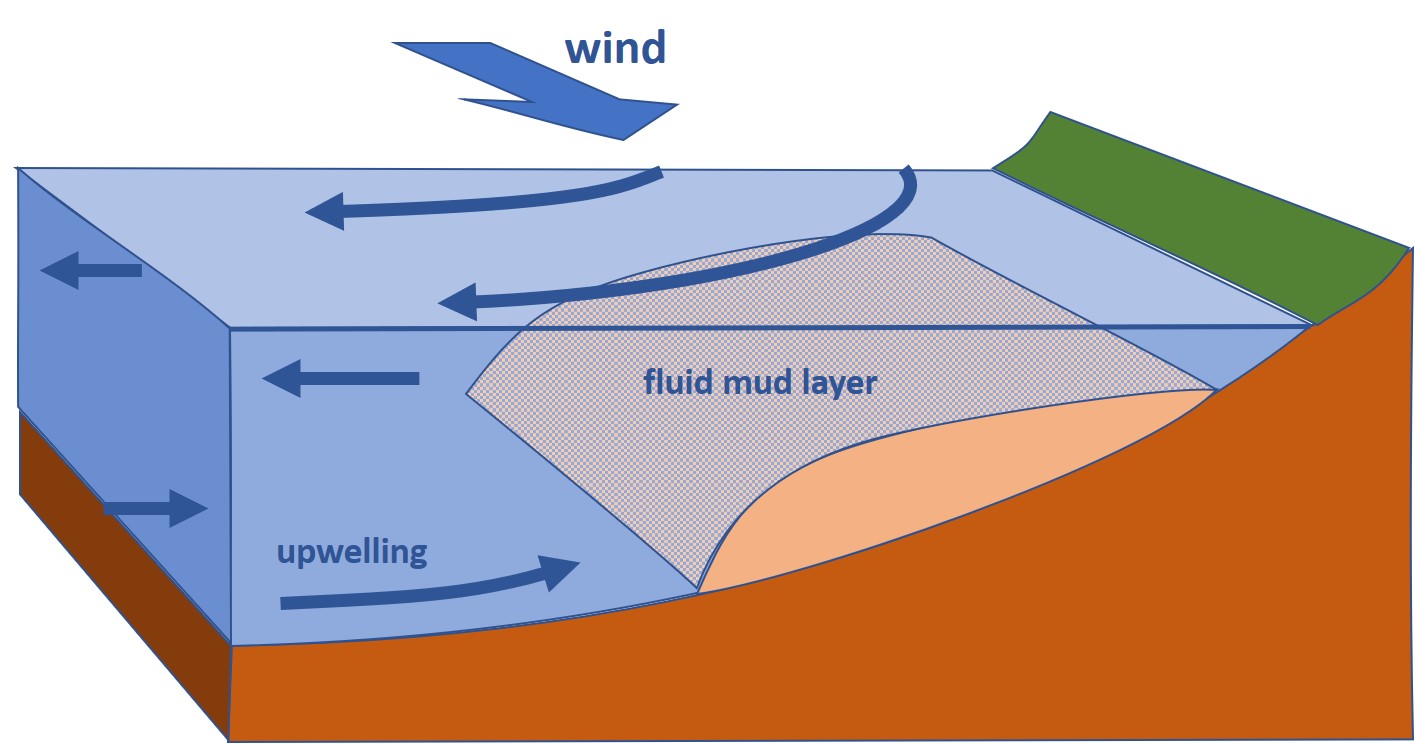
| 11:52, 1 May 2021 | UpwellingCirculation.jpg (file) |  |
138 KB | Dronkers J | Schematic representation of nearshore upwelling circulation driven by alongshore wind. | 1 |
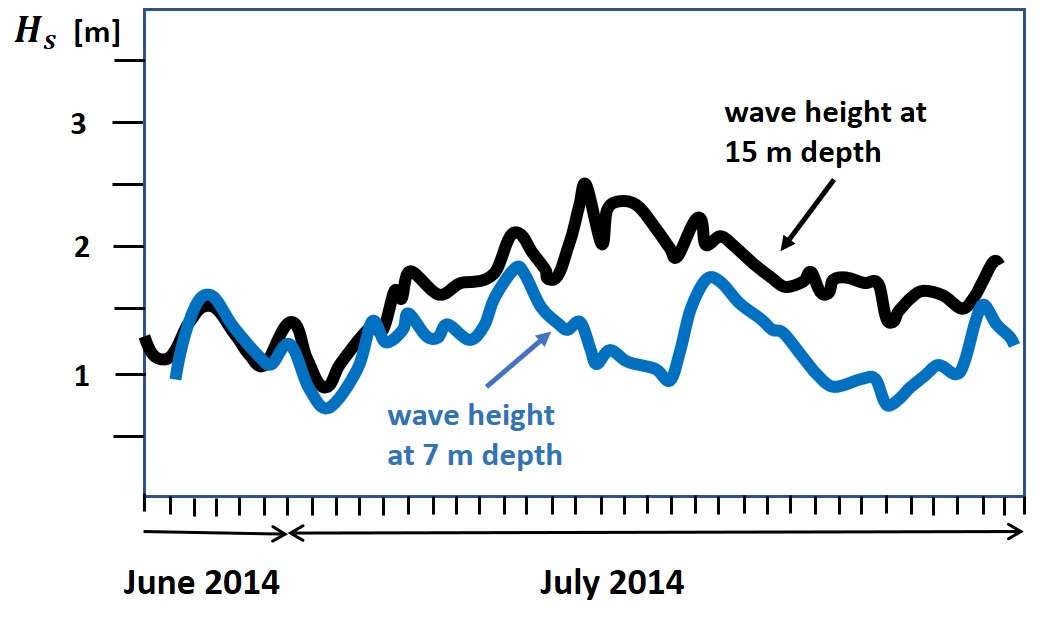
| 11:51, 1 May 2021 | WaveDampingKeralaCoast.jpg (file) |  |
89 KB | Dronkers J | Records of significant wave height <math>H_s</math> off the Kerala coast (India). Black line: wave height at 15 m depth, seaward of a mud bank. Blue line: wave height at the mud bank. | 1 |
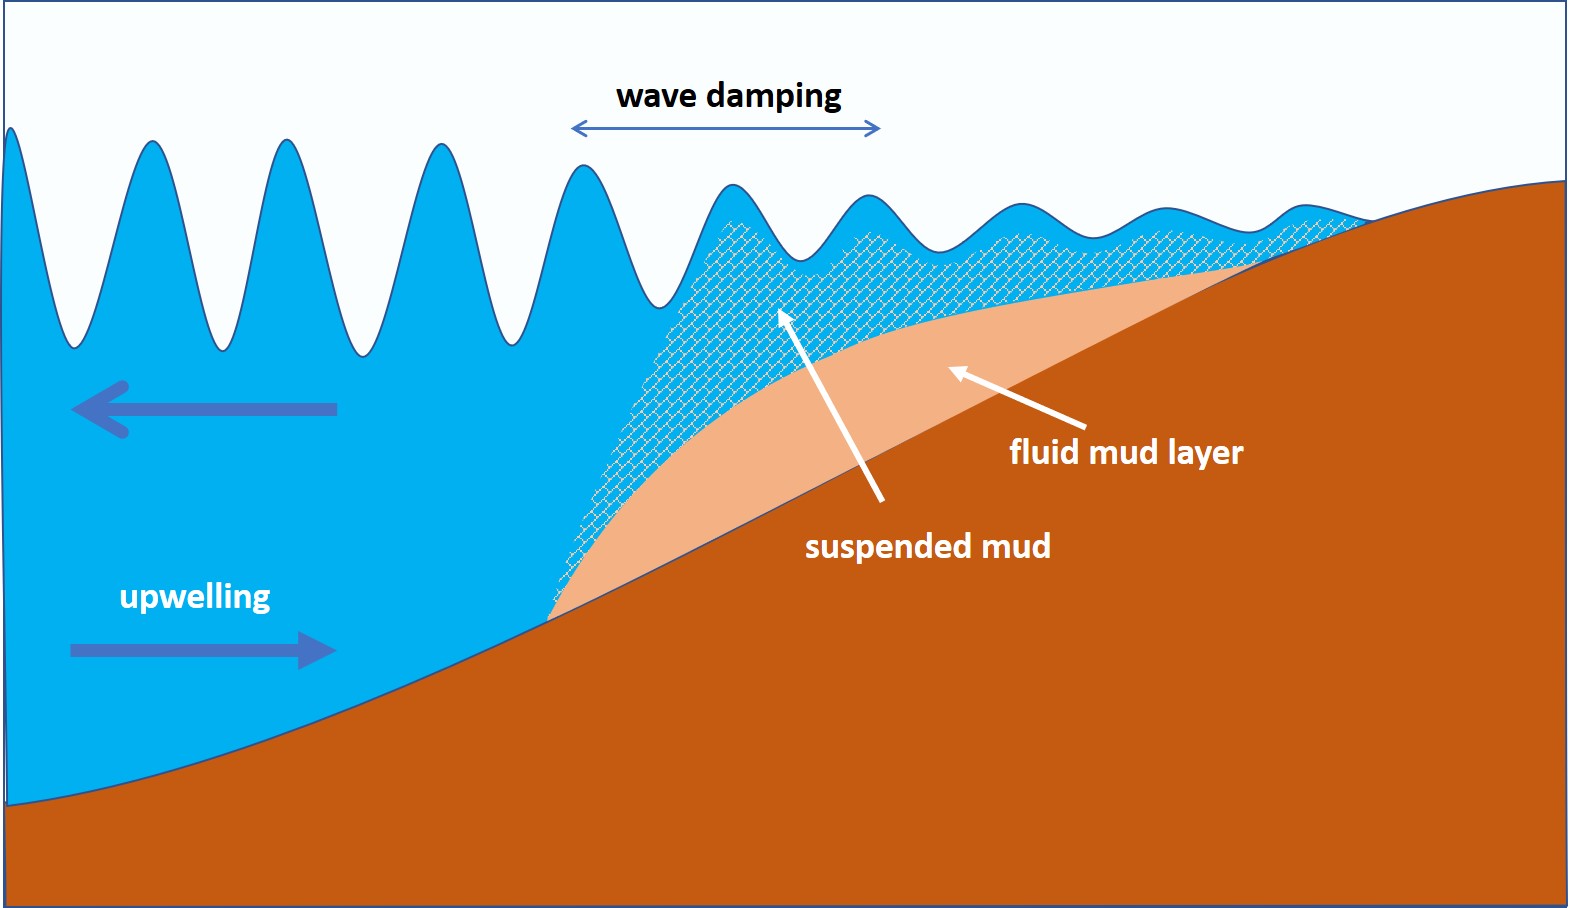
| 11:50, 1 May 2021 | FluidMudWaveDamping.jpg (file) |  |
137 KB | Dronkers J | Schematic representation of wave damping by a fluid mud layer (strongly exaggerated vertical scale). | 1 |
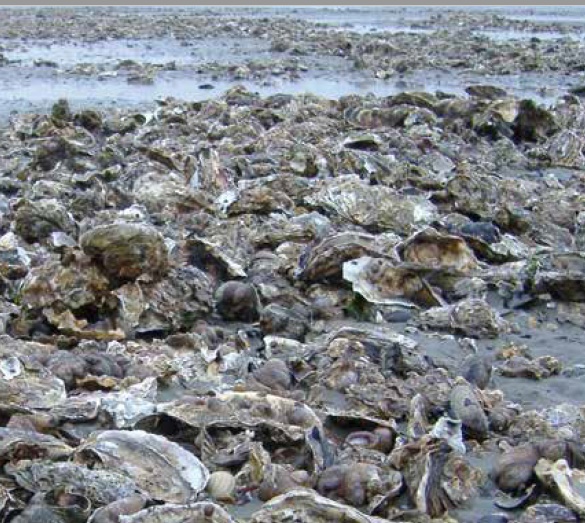
| 17:32, 22 April 2021 | OysterReef.jpg (file) |  |
172 KB | Dronkers J | Oyster reef in the Eastern Scheldt (Netherlands) for protection against tidal flat erosion. Photo credit: Deltares. | 1 |
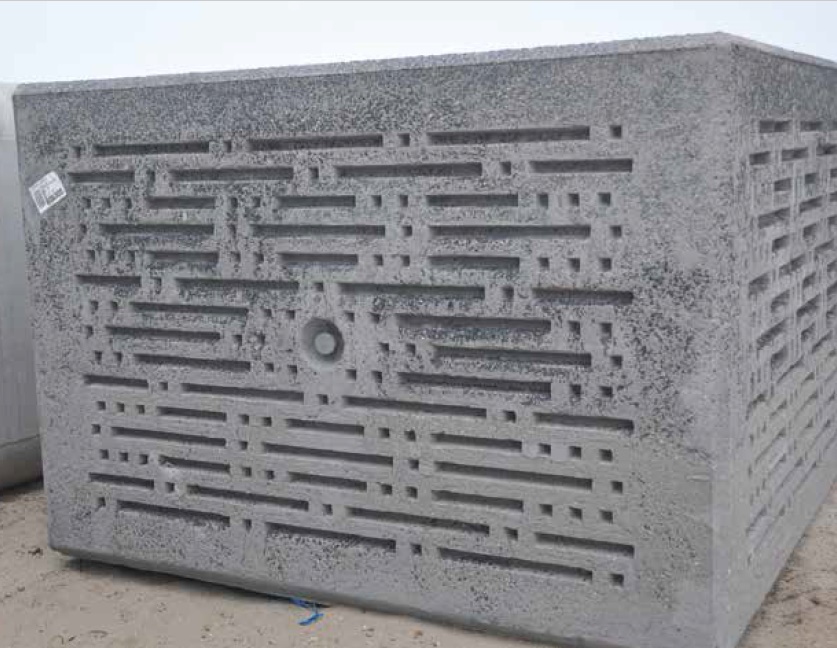
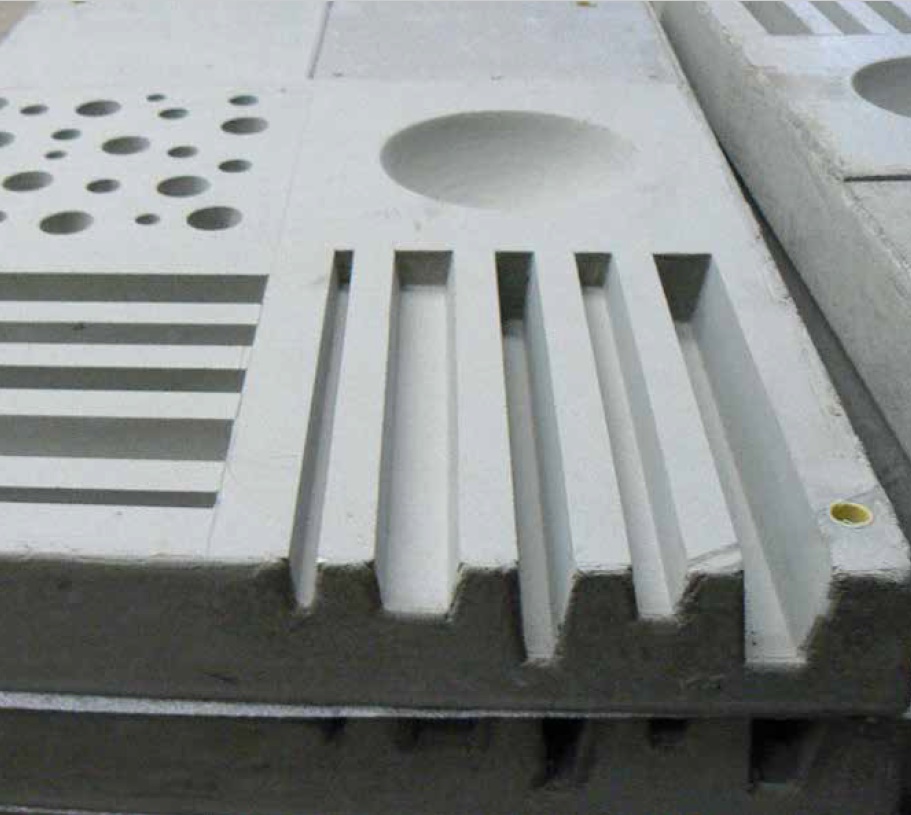
| 17:30, 22 April 2021 | EcoBlockArmor.jpg (file) |  |
181 KB | Dronkers J | Precast concrete armor block with multiple habitat structures. Photo credit: Deltares. | 1 |
| 17:30, 22 April 2021 | EcoBlockRevetment.jpg (file) |  |
137 KB | Dronkers J | Precast concrete revetment with multiple habitat structures. Photo credit: Deltares. | 1 |
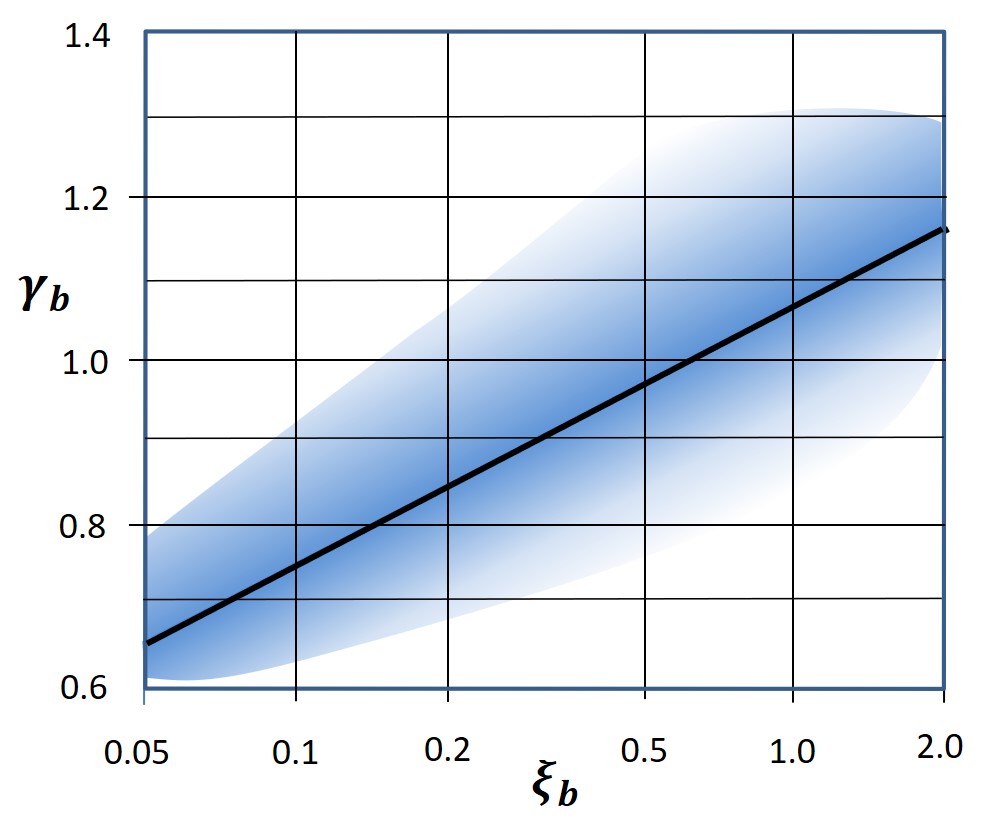
| 22:59, 17 April 2021 | BreakerIndex.jpg (file) |  |
89 KB | Dronkers J | The area covered by experimental data for the breaker index as a function of the surf similarity parameter. The density of the experimental data is represented by varying degrees of blueness. Figure adapted from Ostendorf and Madsen (1979). | 1 |
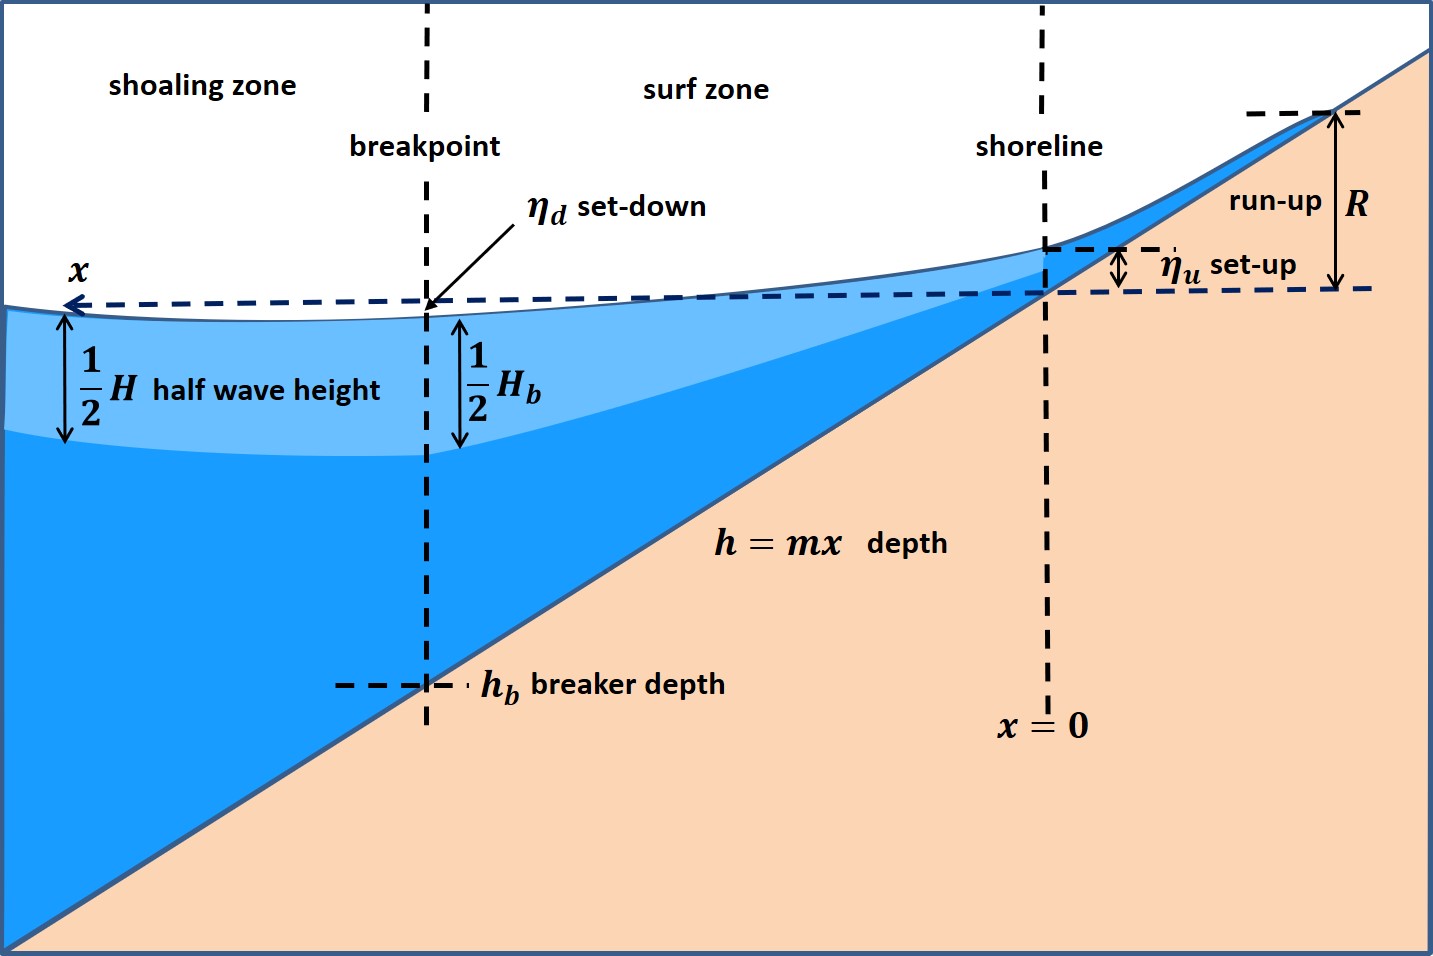
| 20:17, 15 April 2021 | SetupSetdownRunup.jpg (file) |  |
116 KB | Dronkers J | Definition sketch wave set-down, wave set-up and wave run-up. | 1 |
| 17:29, 11 April 2021 | CamperduinShorefaceNourishment.jpg (file) |  |
102 KB | Dronkers J | Shoreface nourishment Camperduin (North Holland) 2002. The figure shows a time stack of coastal profiles. The bar crest migration is indicated by blue lines. The nourishment crest location is indicated by the red line. | 1 |
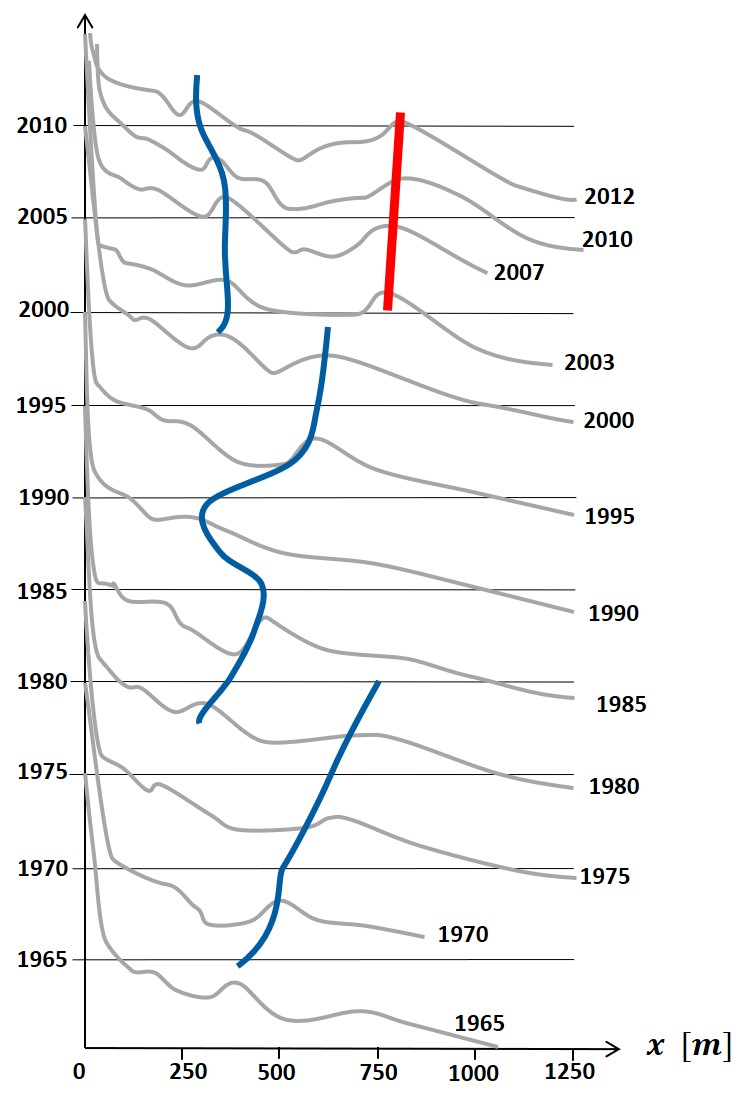
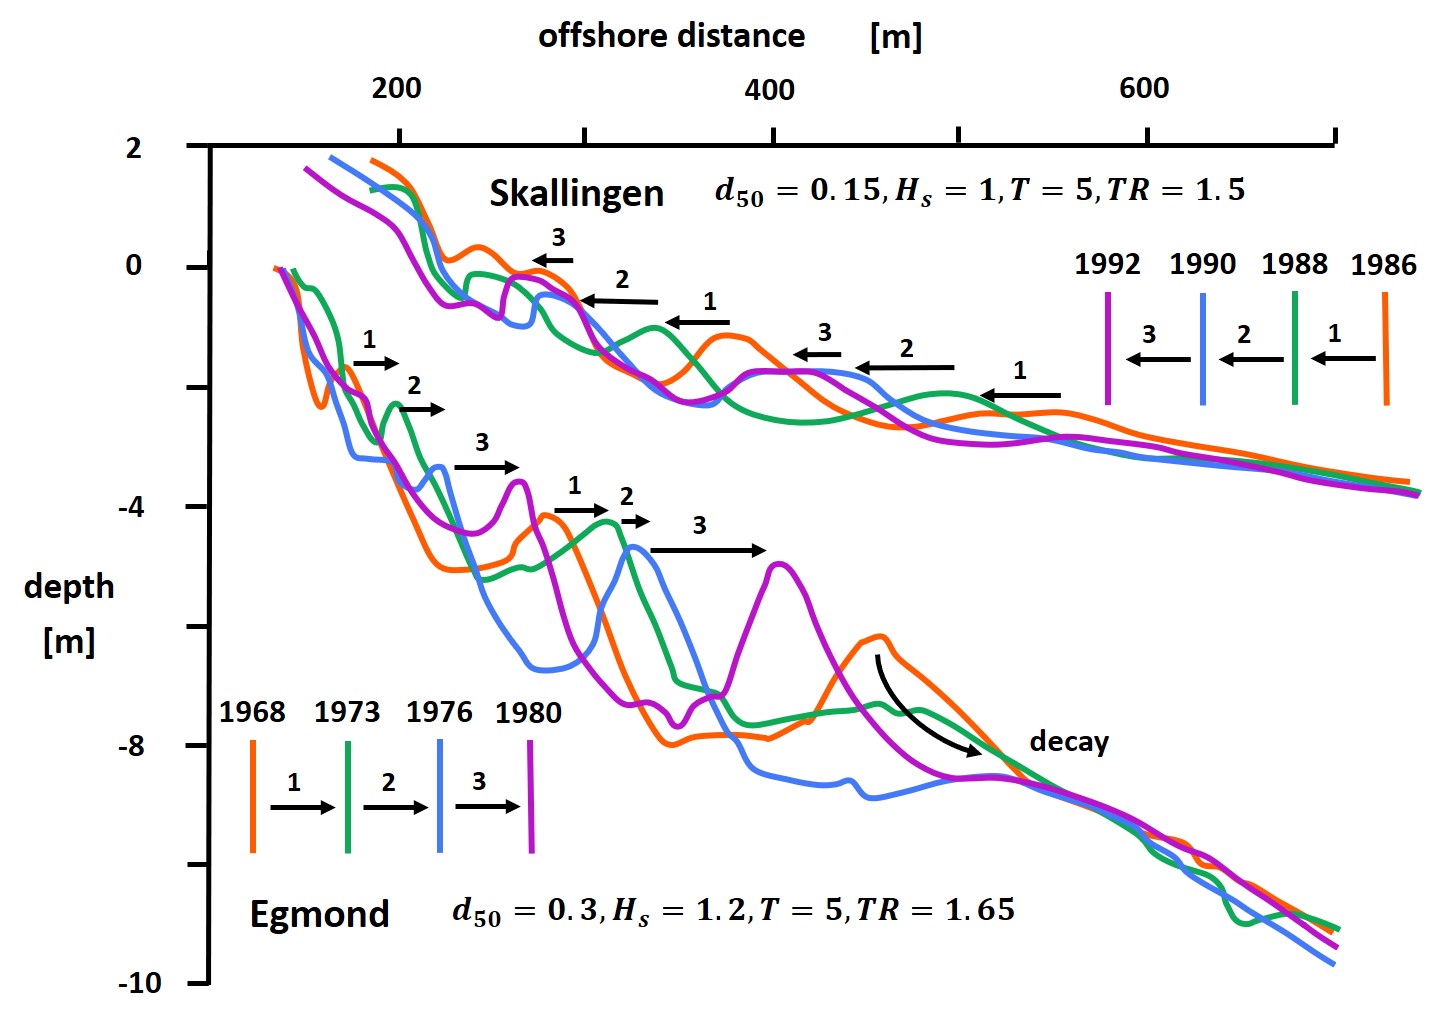
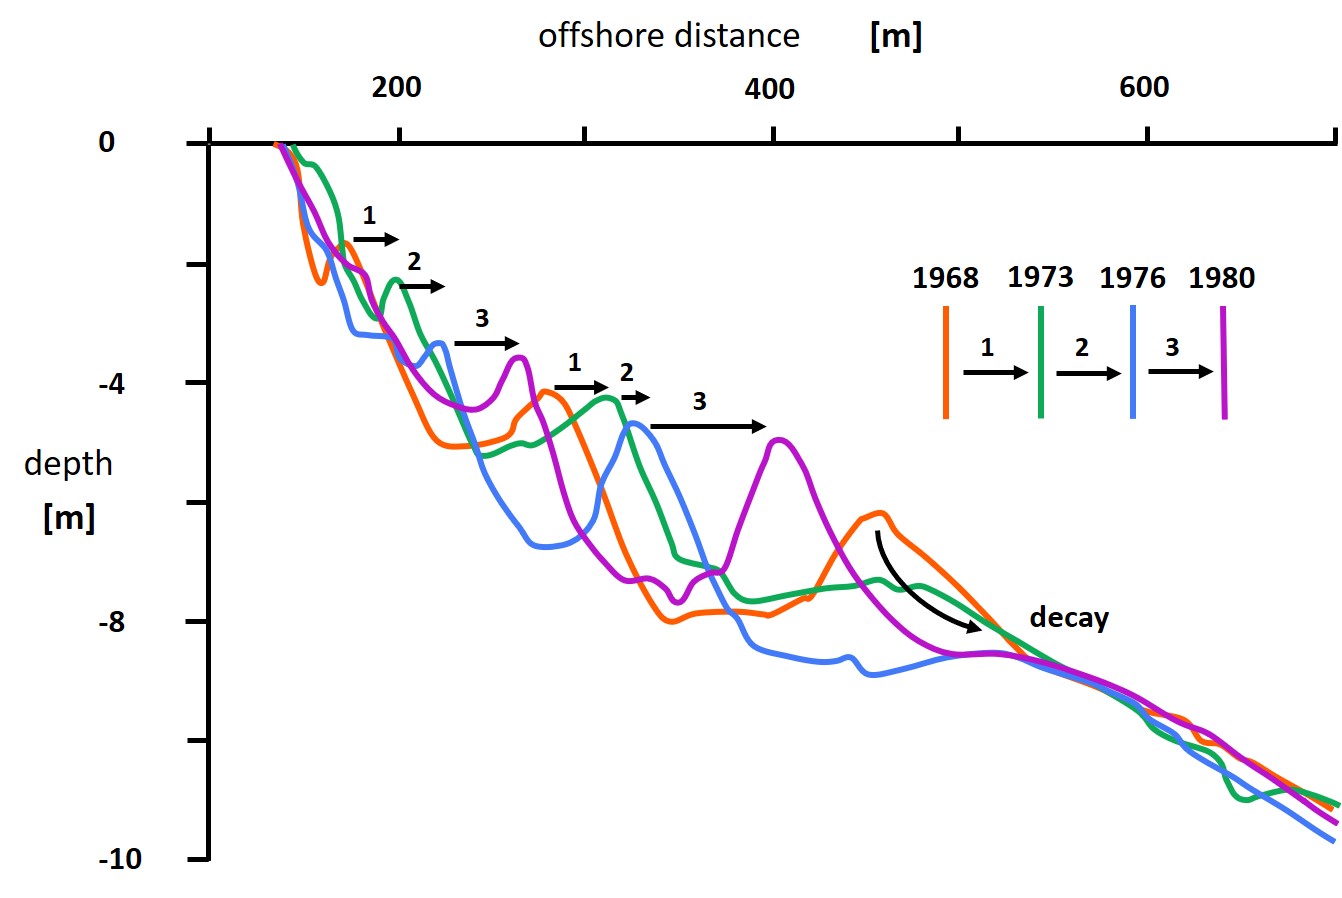
| 11:43, 7 April 2021 | SkallingenEgmondBars.jpg (file) |  |
184 KB | Dronkers J | Cross-shore depth profiles of the surf zone at Skallingen and Egmond showing systems of multiple nearshore bars at different years. | 1 |
| 12:00, 1 April 2021 | EdgeWave.jpg (file) |  |
77 KB | Dronkers J | Principle of wave trapping to the shore. | 1 |
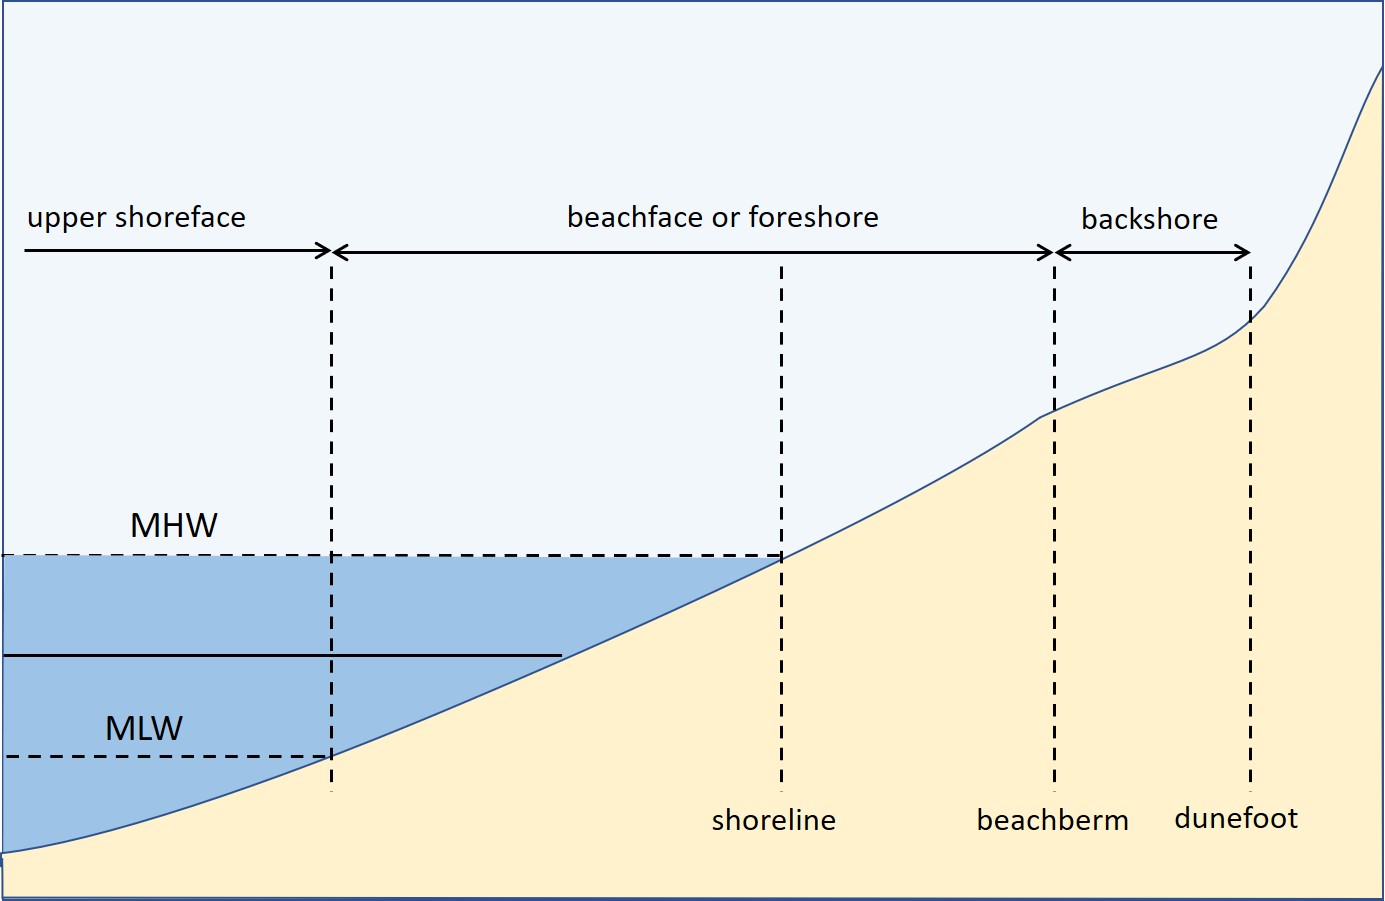
| 16:27, 31 March 2021 | BeachZonation.jpg (file) |  |
92 KB | Dronkers J | Zonation of the beach. | 1 |
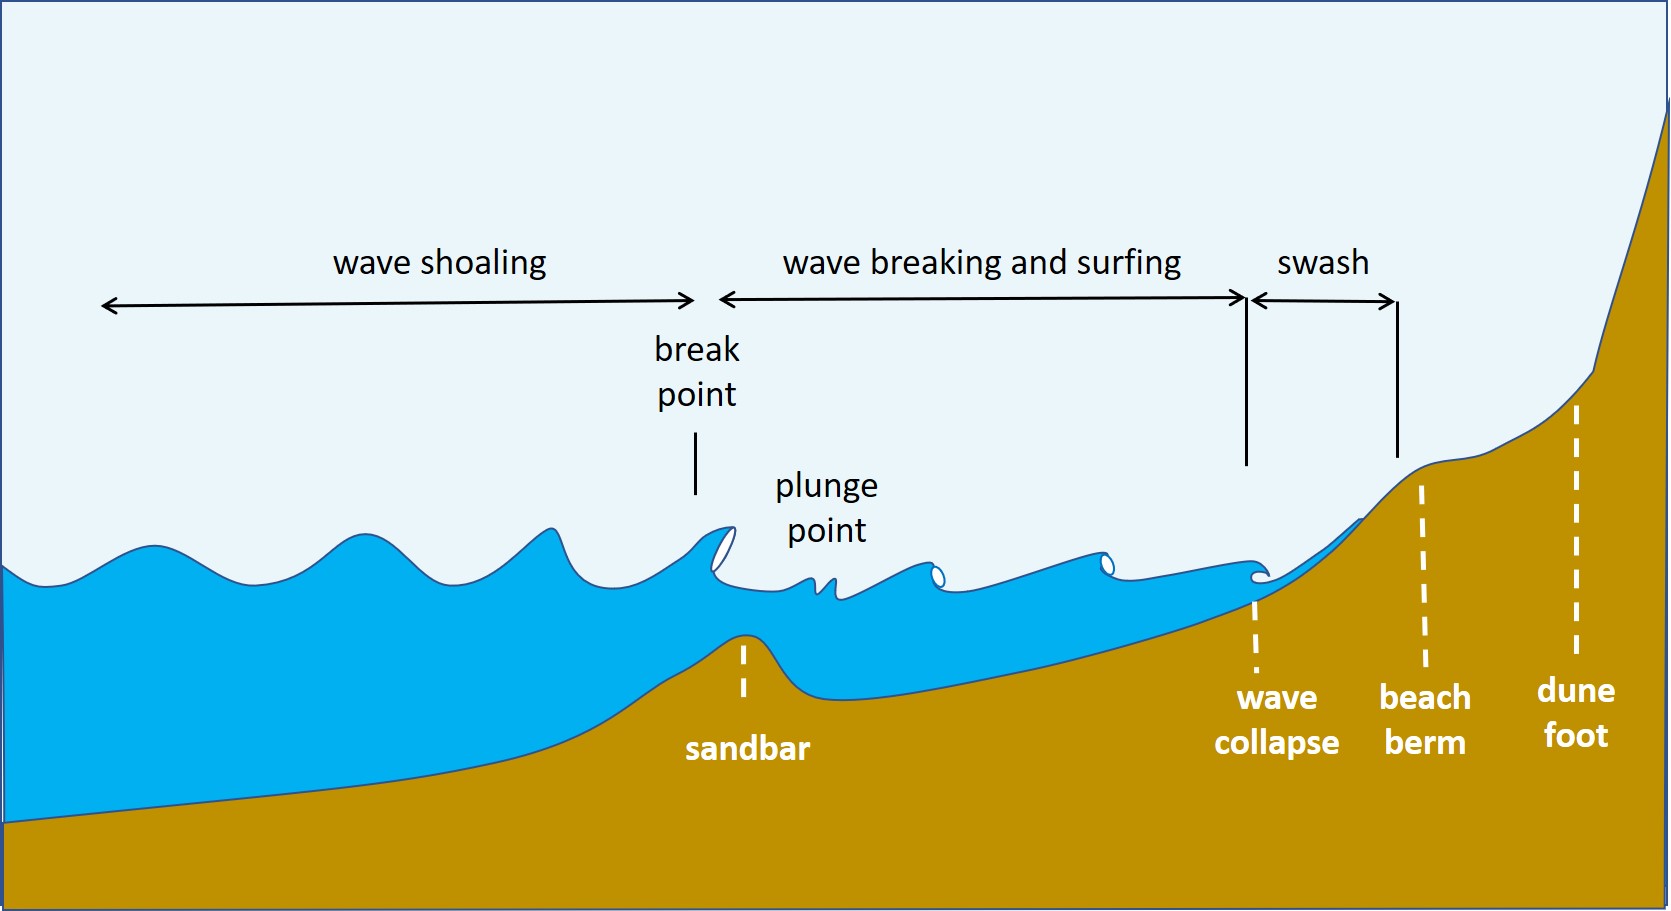
| 15:12, 31 March 2021 | WaveTransformation.jpg (file) | 106 KB | Dronkers J | Wave transformation in the nearshore zone. | 1 | |
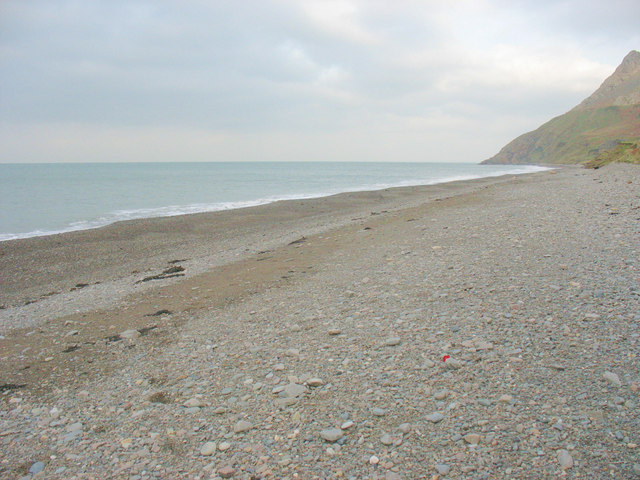
| 12:48, 30 March 2021 | BeachBerm.jpg (file) |  |
94 KB | Dronkers J | Berms on a beach near Llithfaen (UK). Photo credit Eric Jones. Creative Commons Licence. | 1 |
| 11:22, 30 March 2021 | BeachRunnel.jpg (file) |  |
25 KB | Dronkers J | Beach runnel running behind an intertidal bar. | 1 |
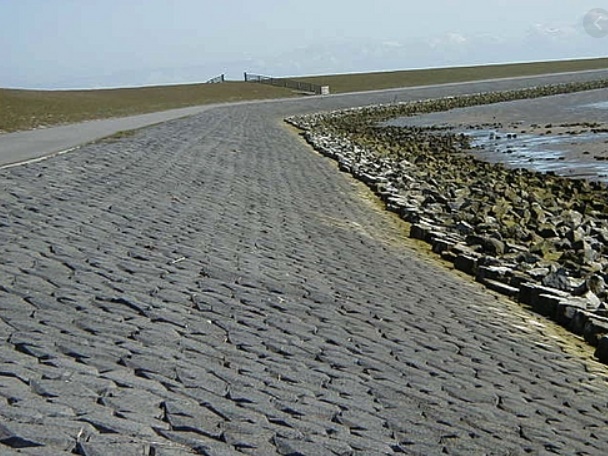
| 10:52, 30 March 2021 | DikeRevetment.jpg (file) |  |
133 KB | Dronkers J | Dike revetment. | 1 |
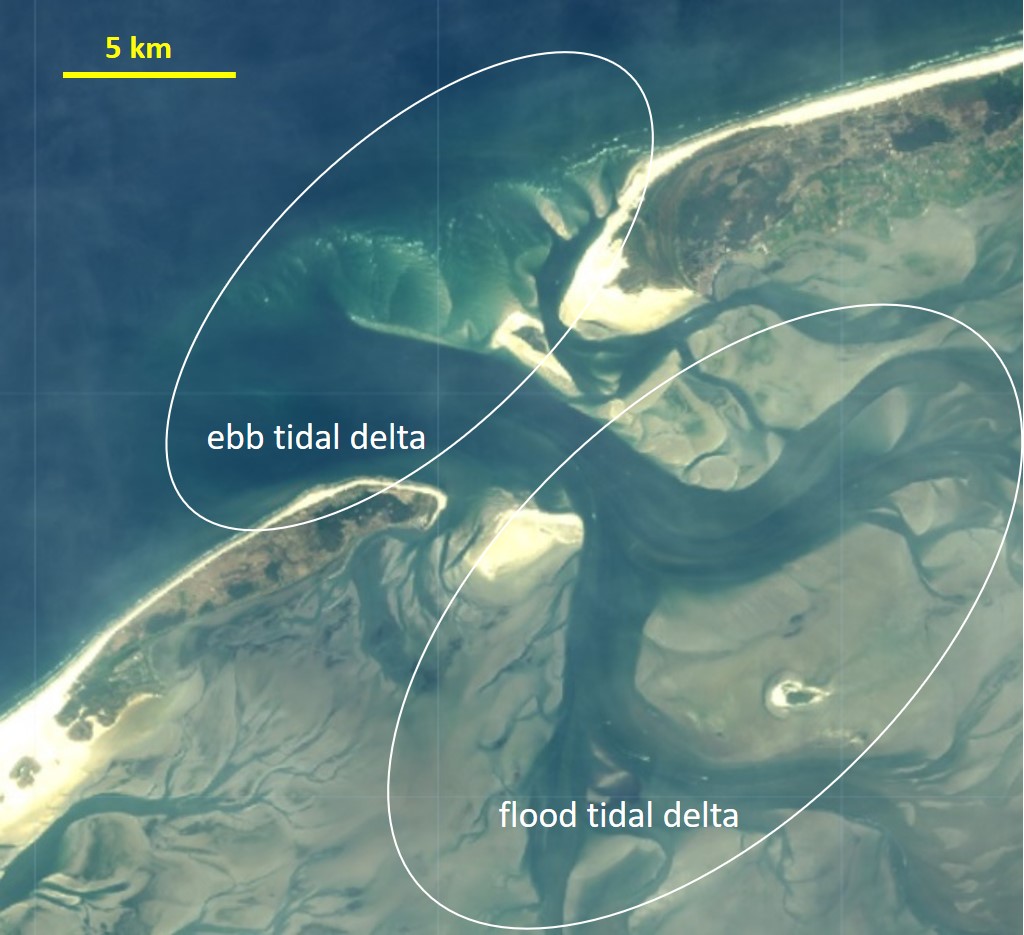
| 22:52, 29 March 2021 | VlieEbbFloodDelta.jpg (file) |  |
140 KB | Dronkers J | Vlie inlet in the Western Wadden Sea (Netherlands). | 1 |
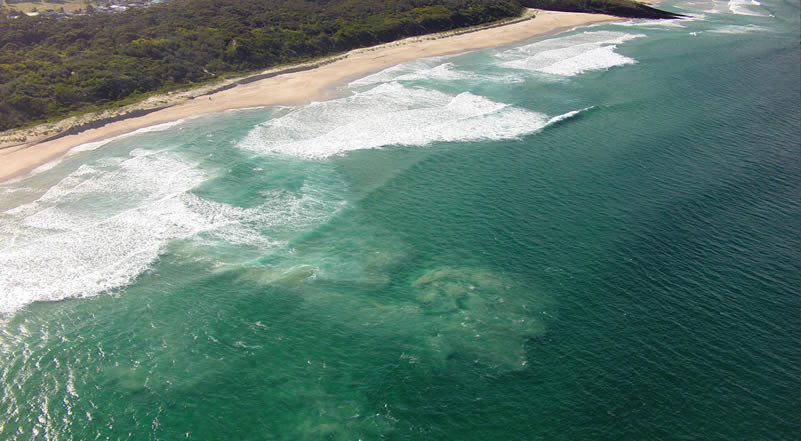
| 20:03, 29 March 2021 | RipBurrillBeach DarylGama.jpg (file) |  |
70 KB | Dronkers J | Rip currents at Burrill Beach, South Coast NSW, Australia. The strength of the current is illustrated by the offshore plume of sediment that is stirred up from the seabed. Photo credit Daryl Gama. https://www.scienceofthesurf.com/ | 1 |
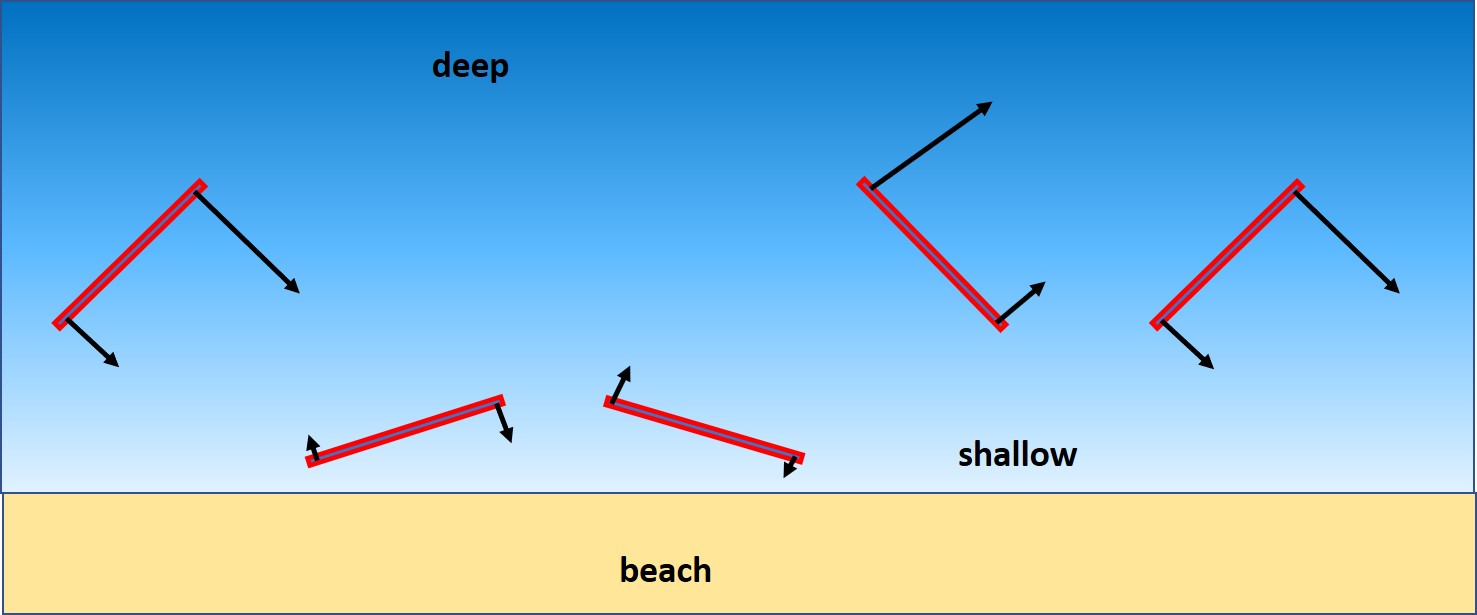
| 17:08, 29 March 2021 | WaveRefraction.jpg (file) |  |
263 KB | Dronkers J | Refraction of oblique incident waves when entering shallow coastal. Bending of the wave crests to become shore parallel. Image Google Earth. | 1 |
| 16:47, 29 March 2021 | WaveDiffraction.jpg (file) |  |
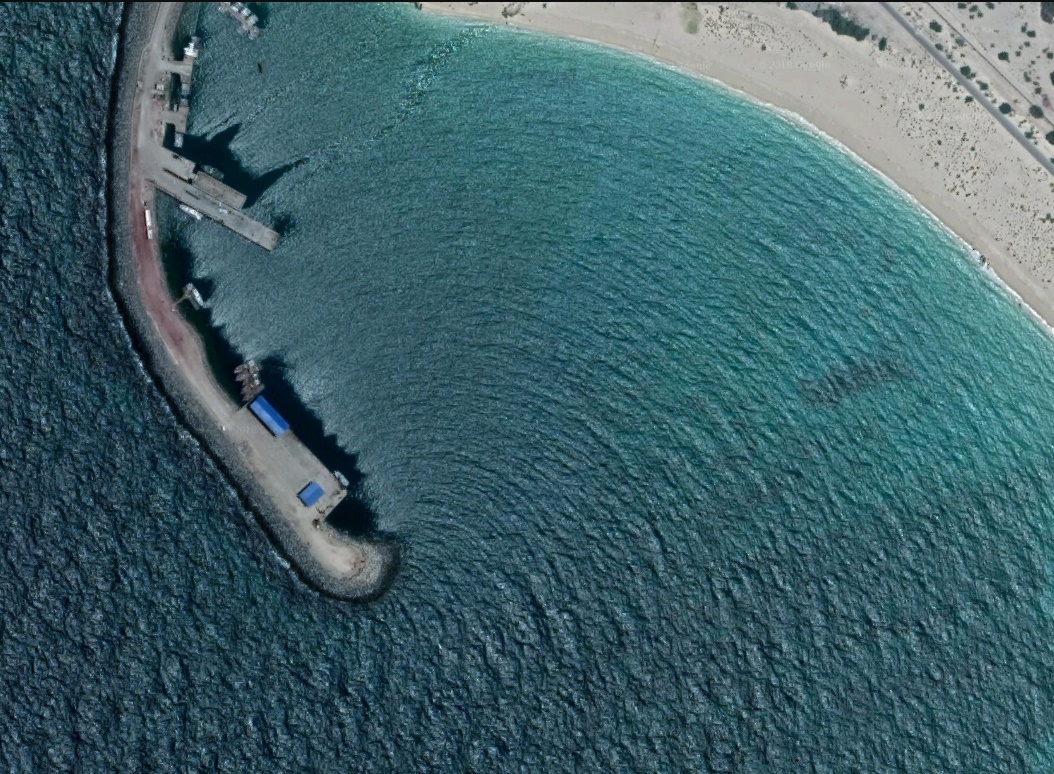
442 KB | Dronkers J | Wave diffraction around the tip of a breakwater. Image Google Earth. | 1 |
| 10:14, 29 March 2021 | MontSaintMichelBay.jpg (file) |  |
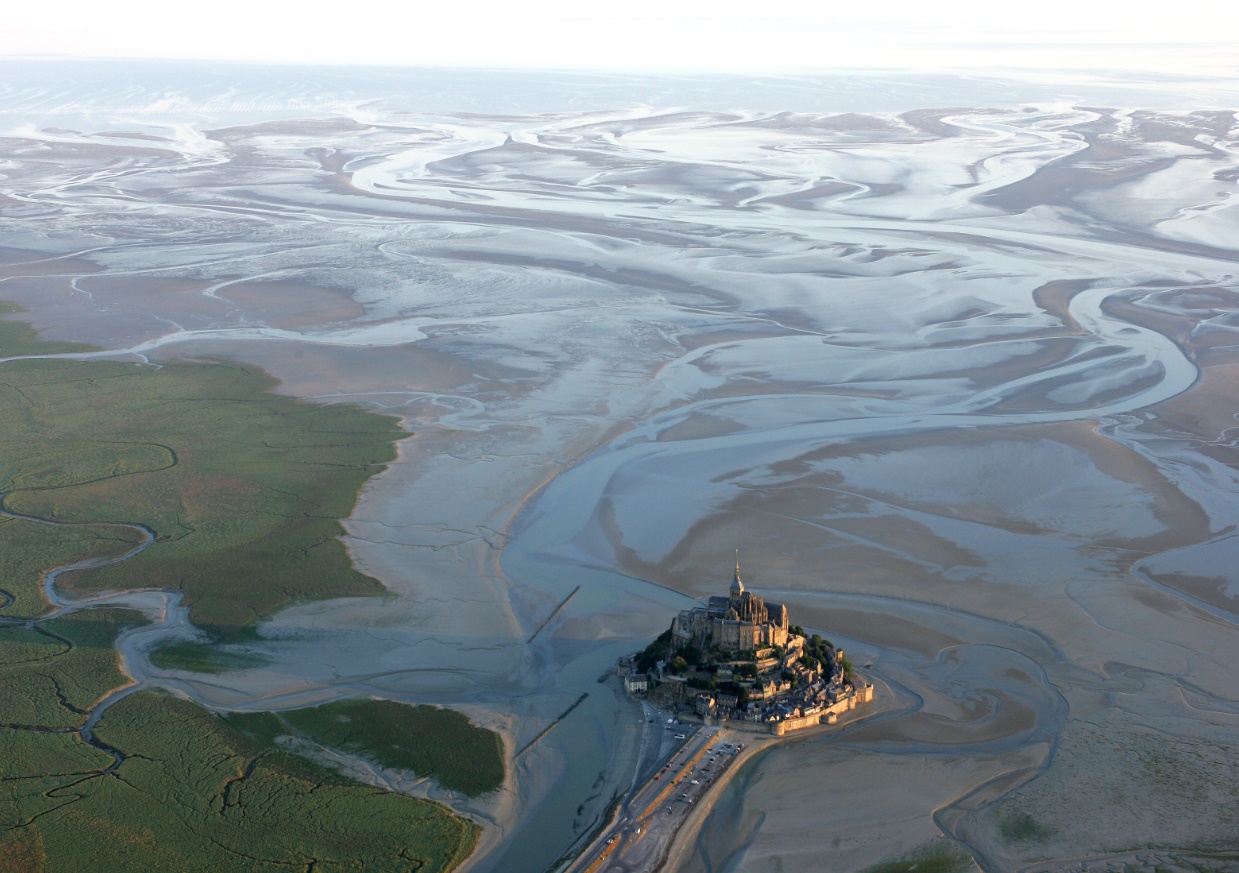
302 KB | Dronkers J | The highly dynamic channel-shoal pattern in the slowly evolving Baie du Mont-Saint-Michel. | 1 |
| 13:53, 28 March 2021 | BasisKustlijn.jpg (file) |  |
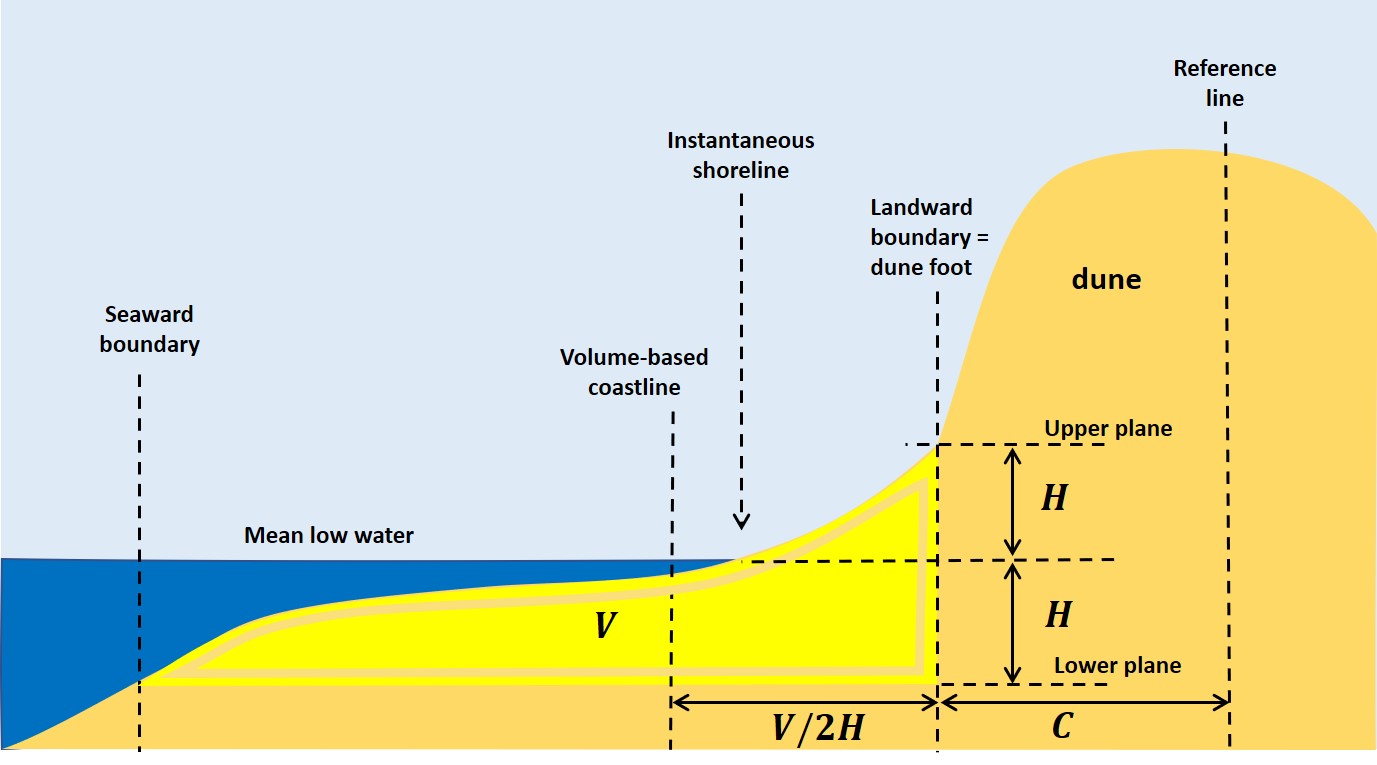
90 KB | Dronkers J | Definition sketch of the base coastline, a volume-based coastline position, which is indicative of structural shoreline changes. | 1 |
| 17:08, 26 March 2021 | CoastalZonation.jpg (file) |  |
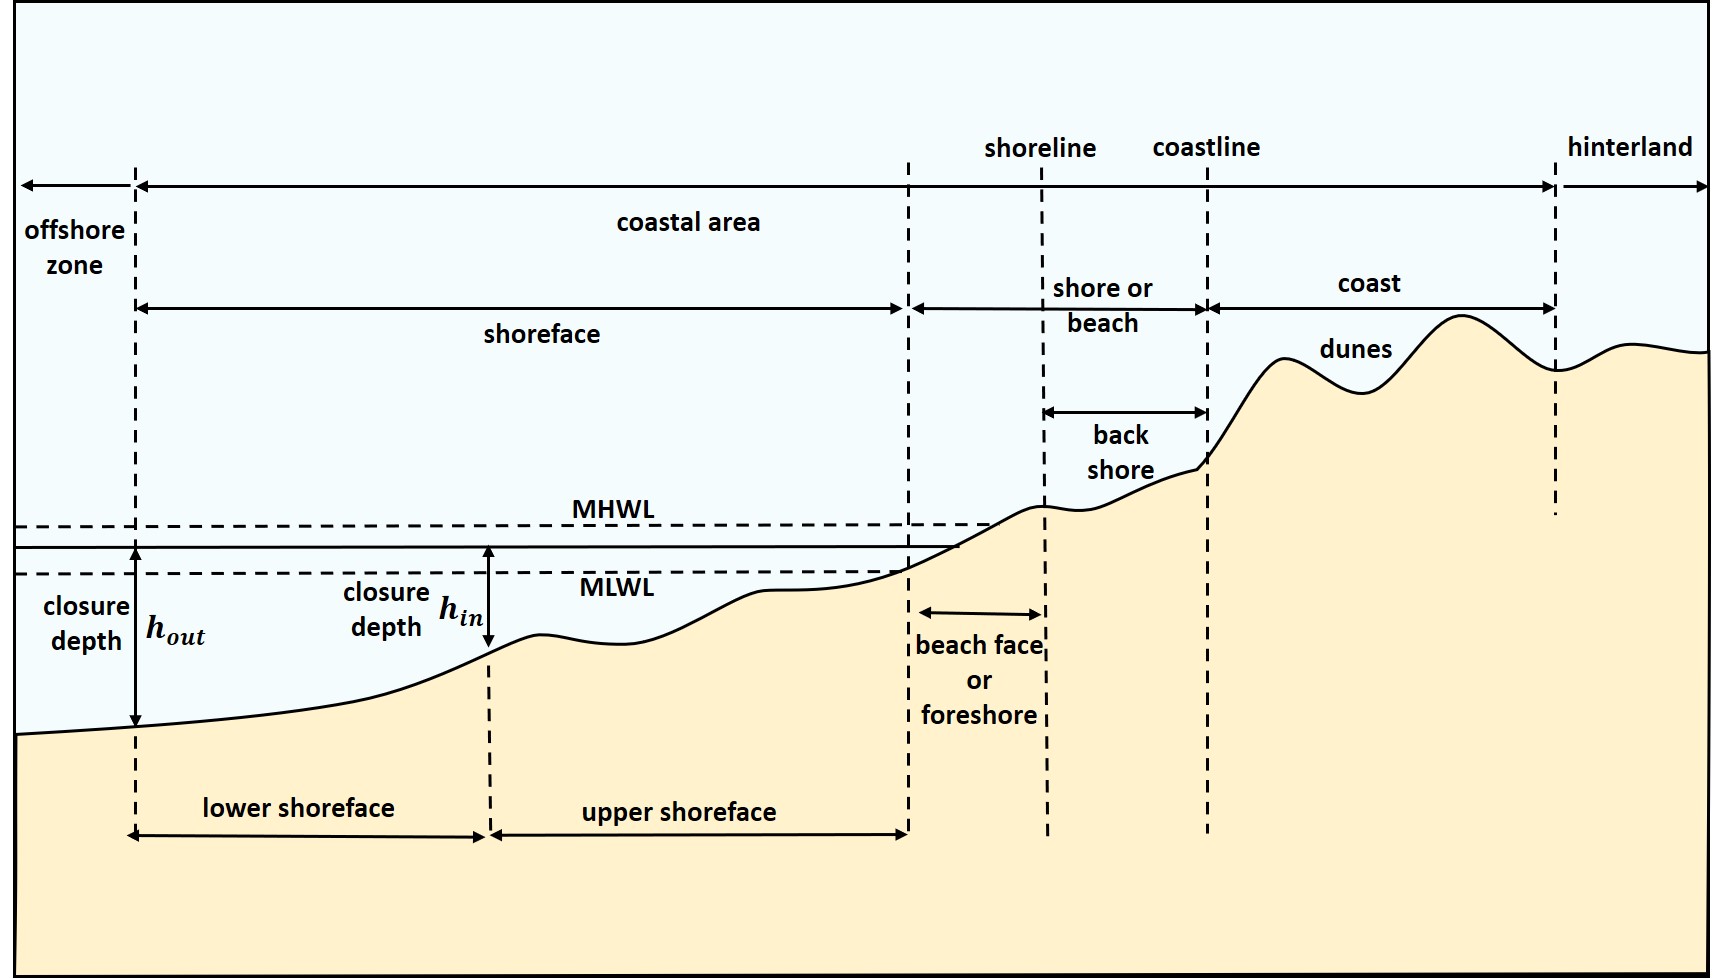
146 KB | Dronkers J | Definition of coastal sub-zones, adapted from the Shore Protection Manual, 1984 | 1 |
| 18:16, 24 March 2021 | ShorefaceUpperLower.jpg (file) |  |
86 KB | Dronkers J | Schematic representation of a shoreface profile. | 1 |
| 17:48, 23 March 2021 | EgmondBars.jpg (file) |  |
112 KB | Dronkers J | Offshore migration of nearshore sandbars at Egmond, North-Holland coast (Netherlands). | 1 |
| 17:46, 23 March 2021 | WaveAsymmetry.jpg (file) |  |
87 KB | Dronkers J | Onshore-offshore asymmetry of the wave orbital velocity and acceleration in the shoaling zone. | 1 |
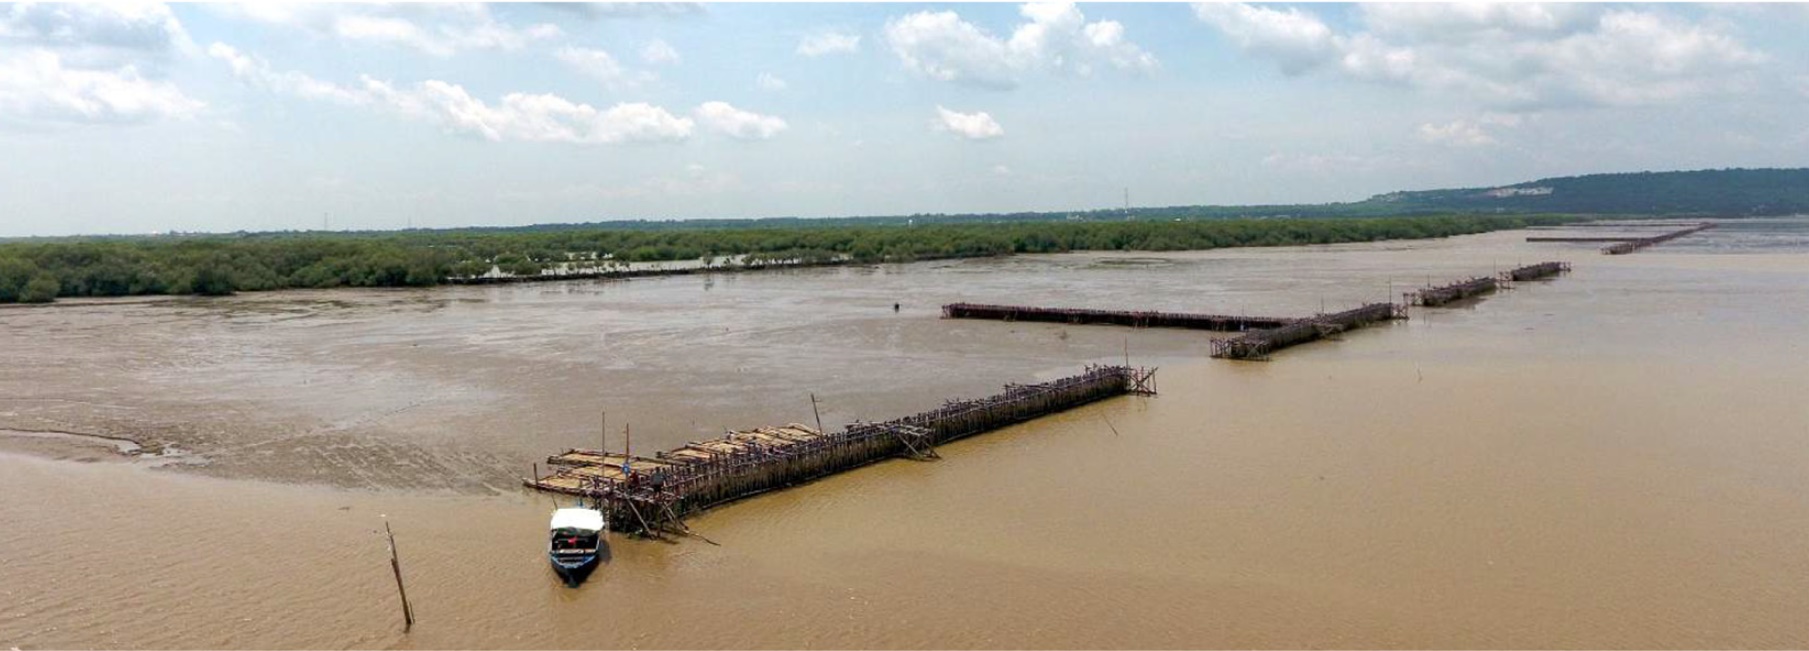
| 21:29, 17 March 2021 | MangroveRestorationJavaMMAF.jpg (file) |  |
252 KB | Dronkers J | Mangrove restoration by creating appropriate conditions for sediment deposition with permeable bamboo dams (Winterwerp et al., 2020). Photo credit Indonesian Ministry of Marine Affairs and Fisheries (MMAF). | 1 |