File list
This special page shows all uploaded files.
| Date | Name | Thumbnail | Size | User | Description | Versions |
|---|---|---|---|---|---|---|
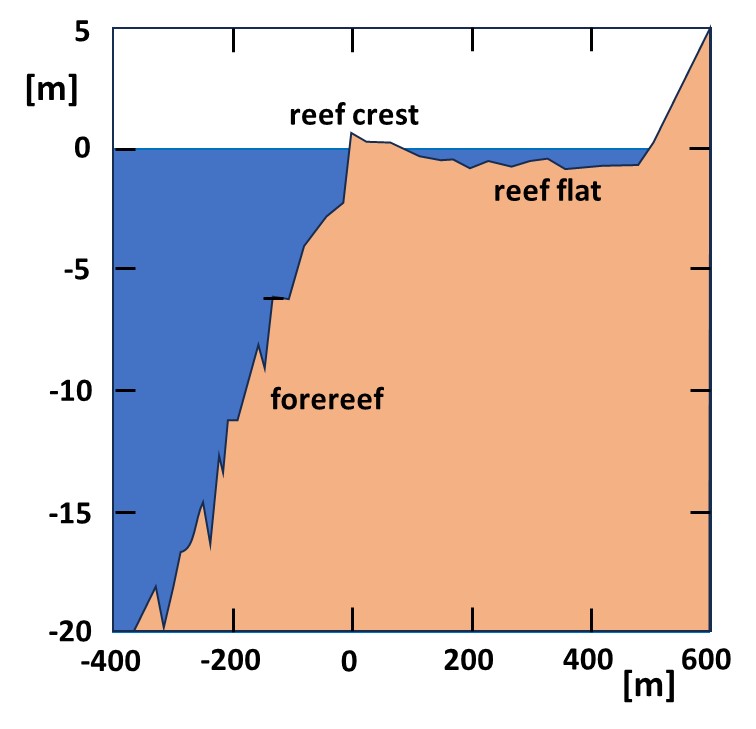
| 21:46, 22 July 2023 | ReefShape.jpg (file) |  |
46 KB | Dronkers J | Example of a typical reef shape. | 1 |
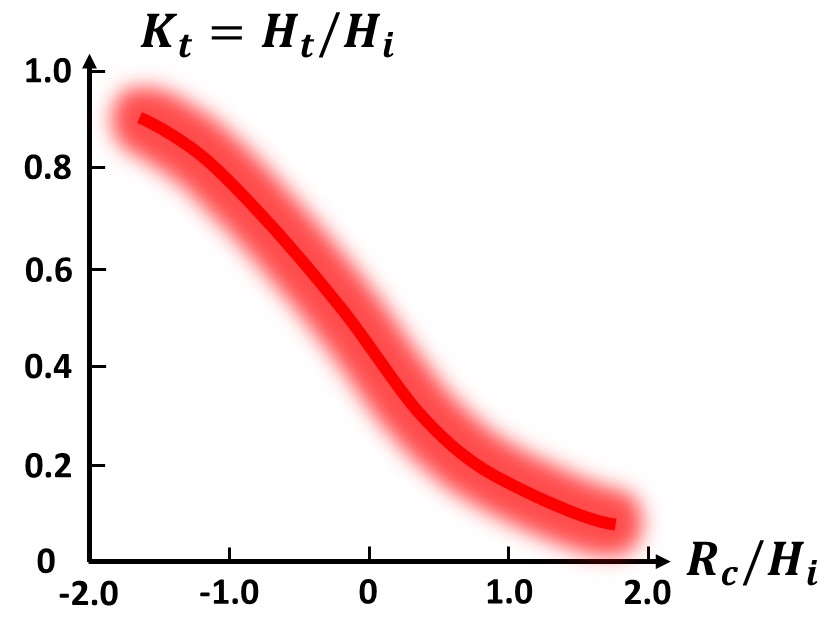
| 15:19, 4 July 2023 | WaveTransmissionGraph.jpg (file) | 44 KB | Dronkers J | Graphical estimate of the wave transmission coefficient as a function of the relative freeboard, based on laboratory data. The red glow of the curve indicates the level of accuracy. | 1 | |
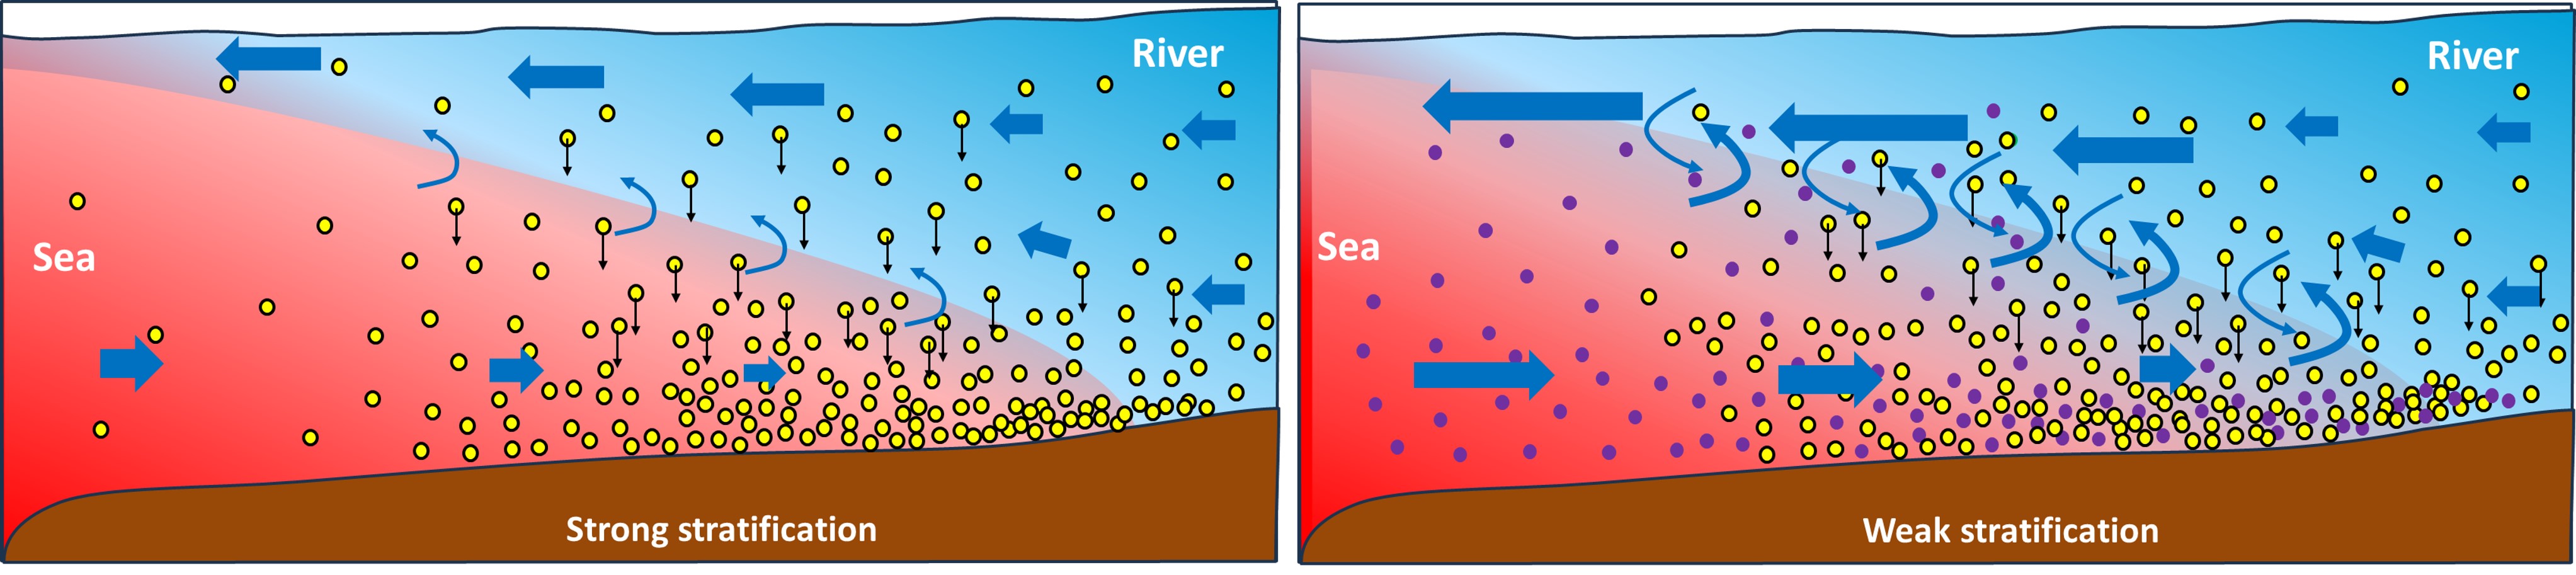
| 21:14, 1 July 2023 | StratificationETM.jpg (file) | 533 KB | Dronkers J | Cartoon explaining the effect of density stratification on the estuarine turbidity maximum (ETM). Red = sea water, blue = river water. Yellow dots = fluvial sediment, violet dots = marine sediment. Left panel: Strong stratification. Right panel: Weak s... | 1 | |
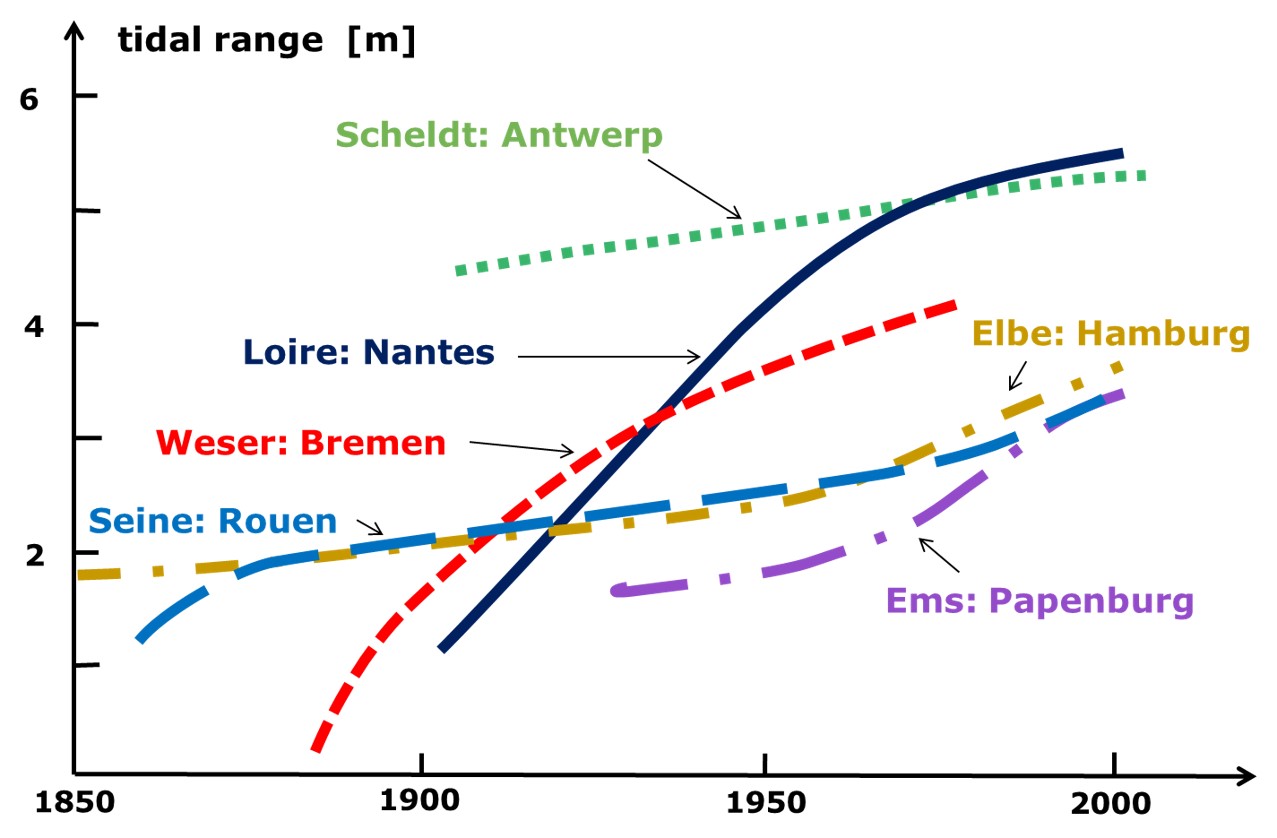
| 10:51, 25 June 2023 | TidalRangeHistory.jpg (file) |  |
112 KB | Dronkers J | Increase of the tidal range at inland seaports along tidal rivers in Europe during the past century. | 2 |
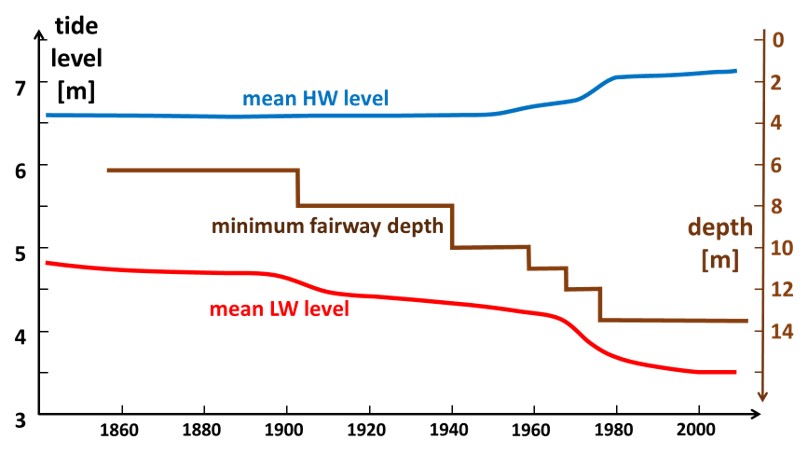
| 13:57, 24 June 2023 | ElbeTideHistory.jpg (file) |  |
46 KB | Dronkers J | Evolution of the HW and LW tidal levels in the Elbe at Hamburg in response to channel deepening in the past century. Adapted from ABP mer (2011). | 1 |
| 15:06, 23 June 2023 | AngleOfRepose.jpg (file) |  |
19 KB | Dronkers J | Angle of repose: Equilibrium slope angle of a pile of sediment grains in water. | 1 |
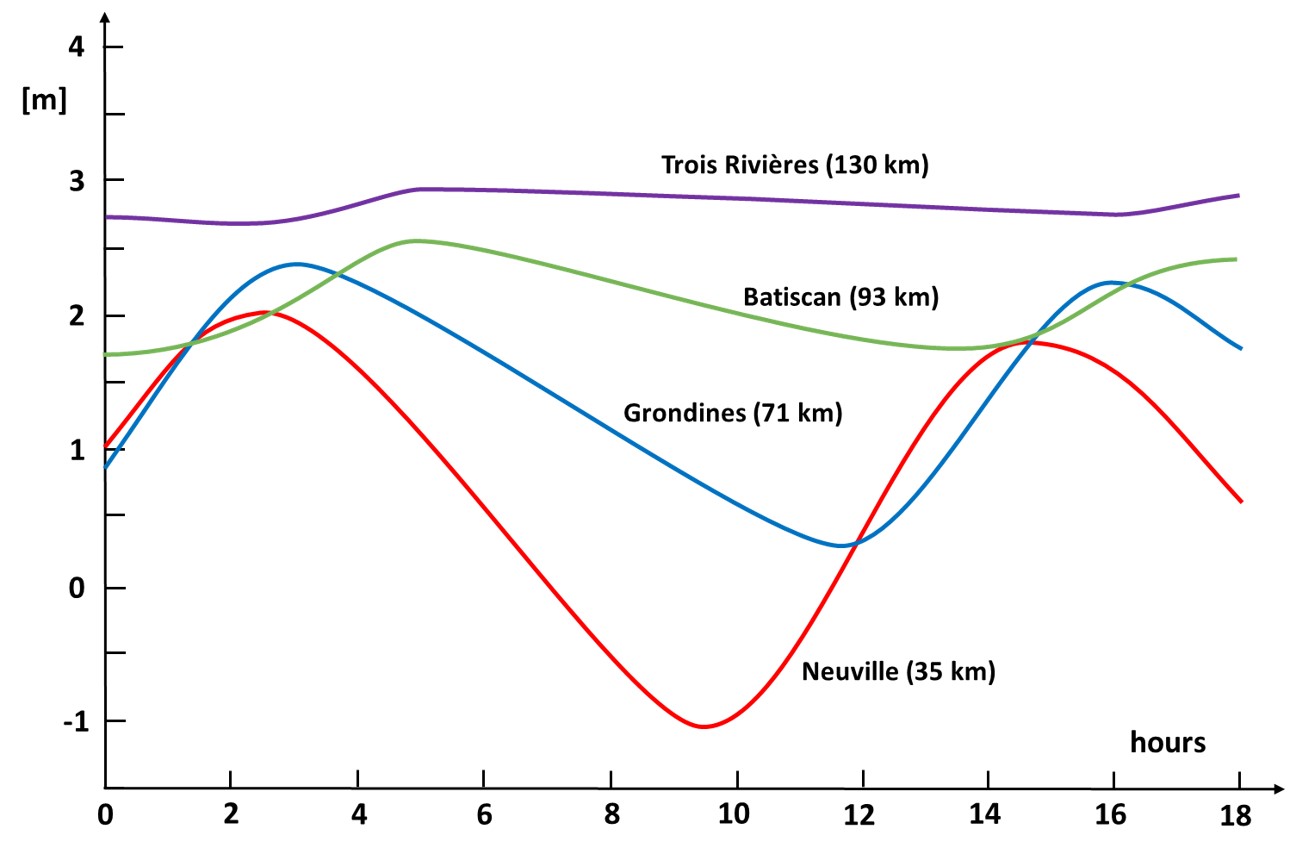
| 12:13, 23 June 2023 | StLawrenceTideAsym.jpg (file) |  |
90 KB | Dronkers J | Simultaneously recorded tide curves at different stations (km distance from Quebec town) along the St. Lawrence River. Adapted from LeBlond (1978). | 1 |
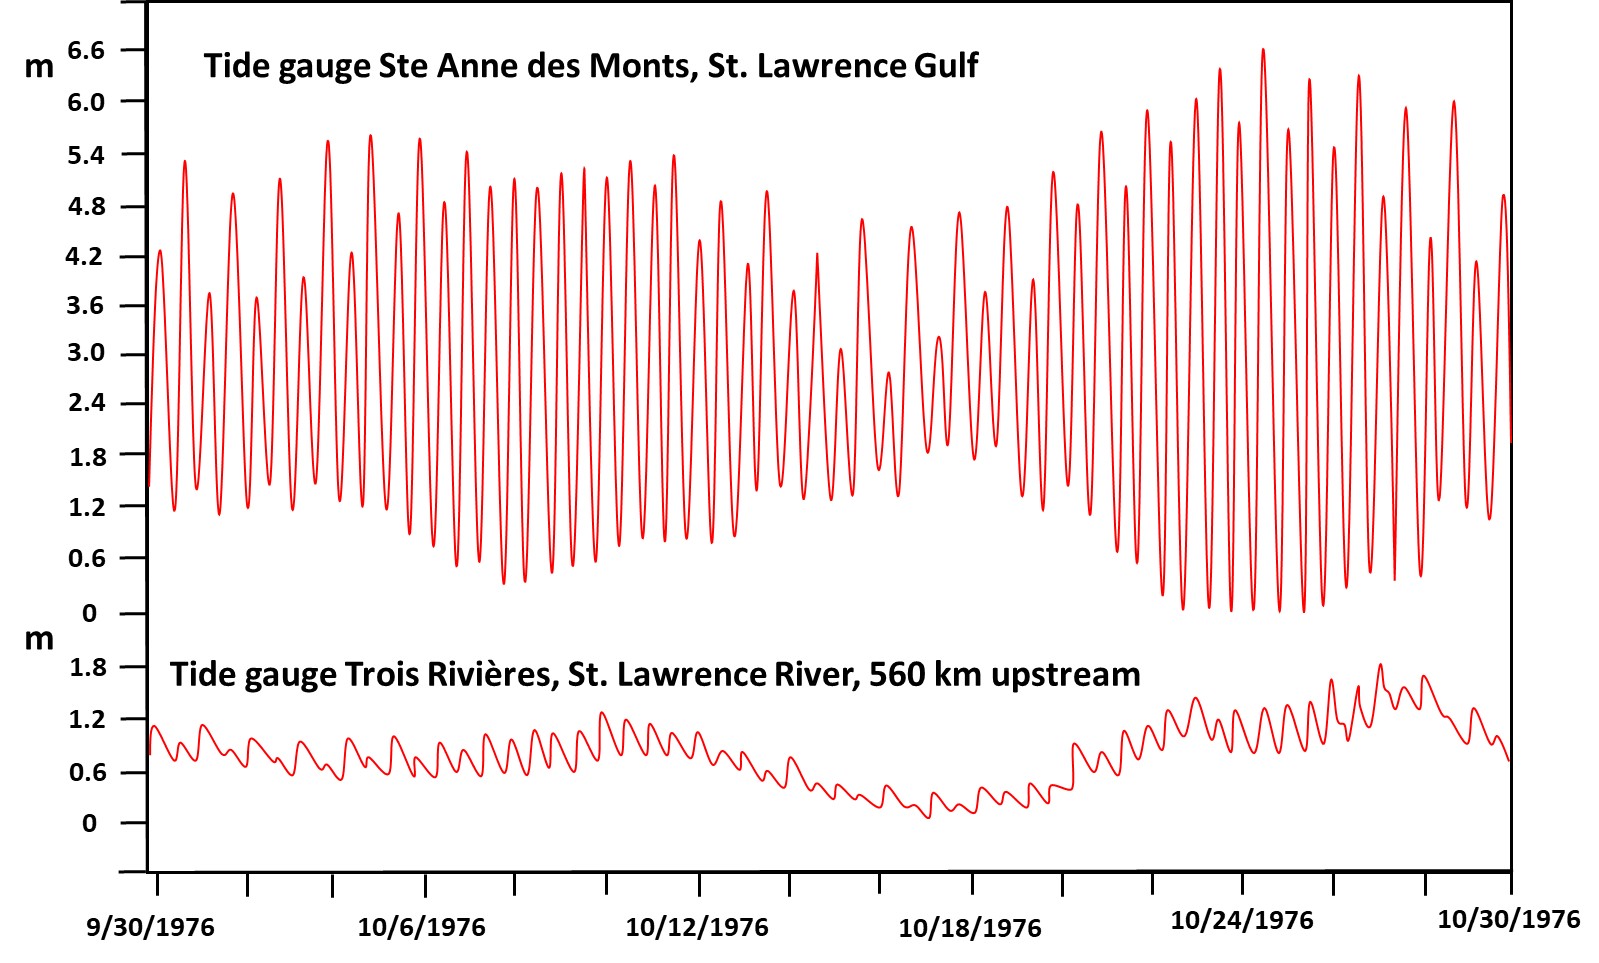
| 18:06, 22 June 2023 | StLawrenceTides.jpg (file) |  |
277 KB | Dronkers J | Tide gauge data at the St. Lawrence estuary mouth (Ste Anne des Monts) and at an upstream location (Trois Rivières) along the St. Lawrence River (Canada) during the month September 1976.The 0-meter datum is chosen arbitrarily for both stations. Redraw... | 2 |
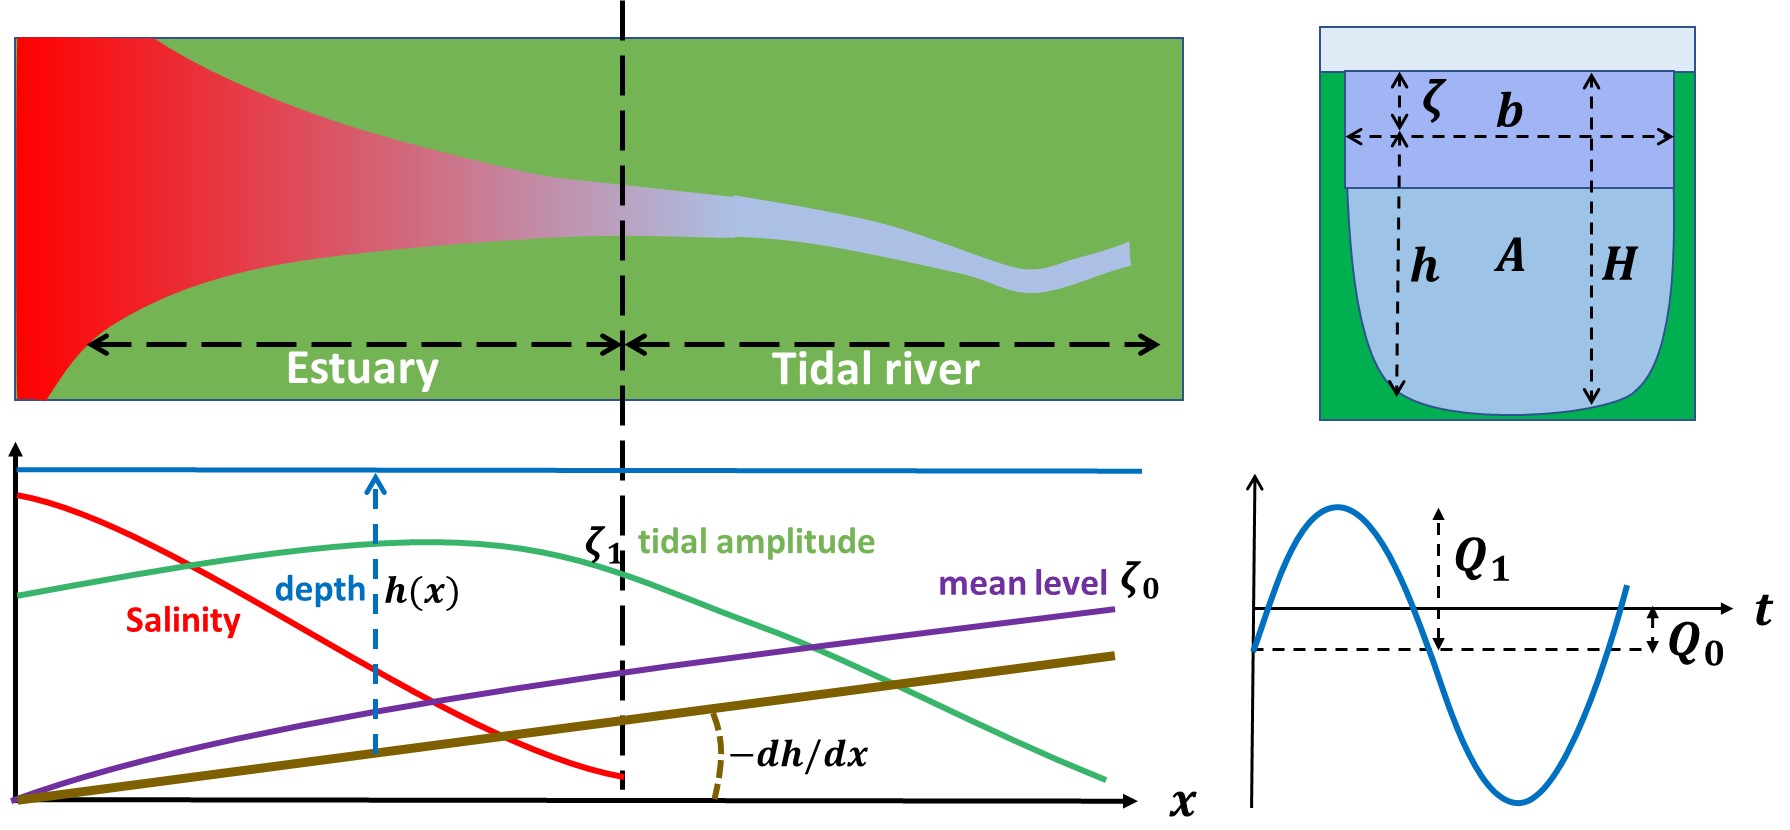
| 21:03, 21 June 2023 | TidalRiverScheme.jpg (file) |  |
167 KB | Dronkers J | Schematic representation of a tidal river and symbol definitions. | 1 |
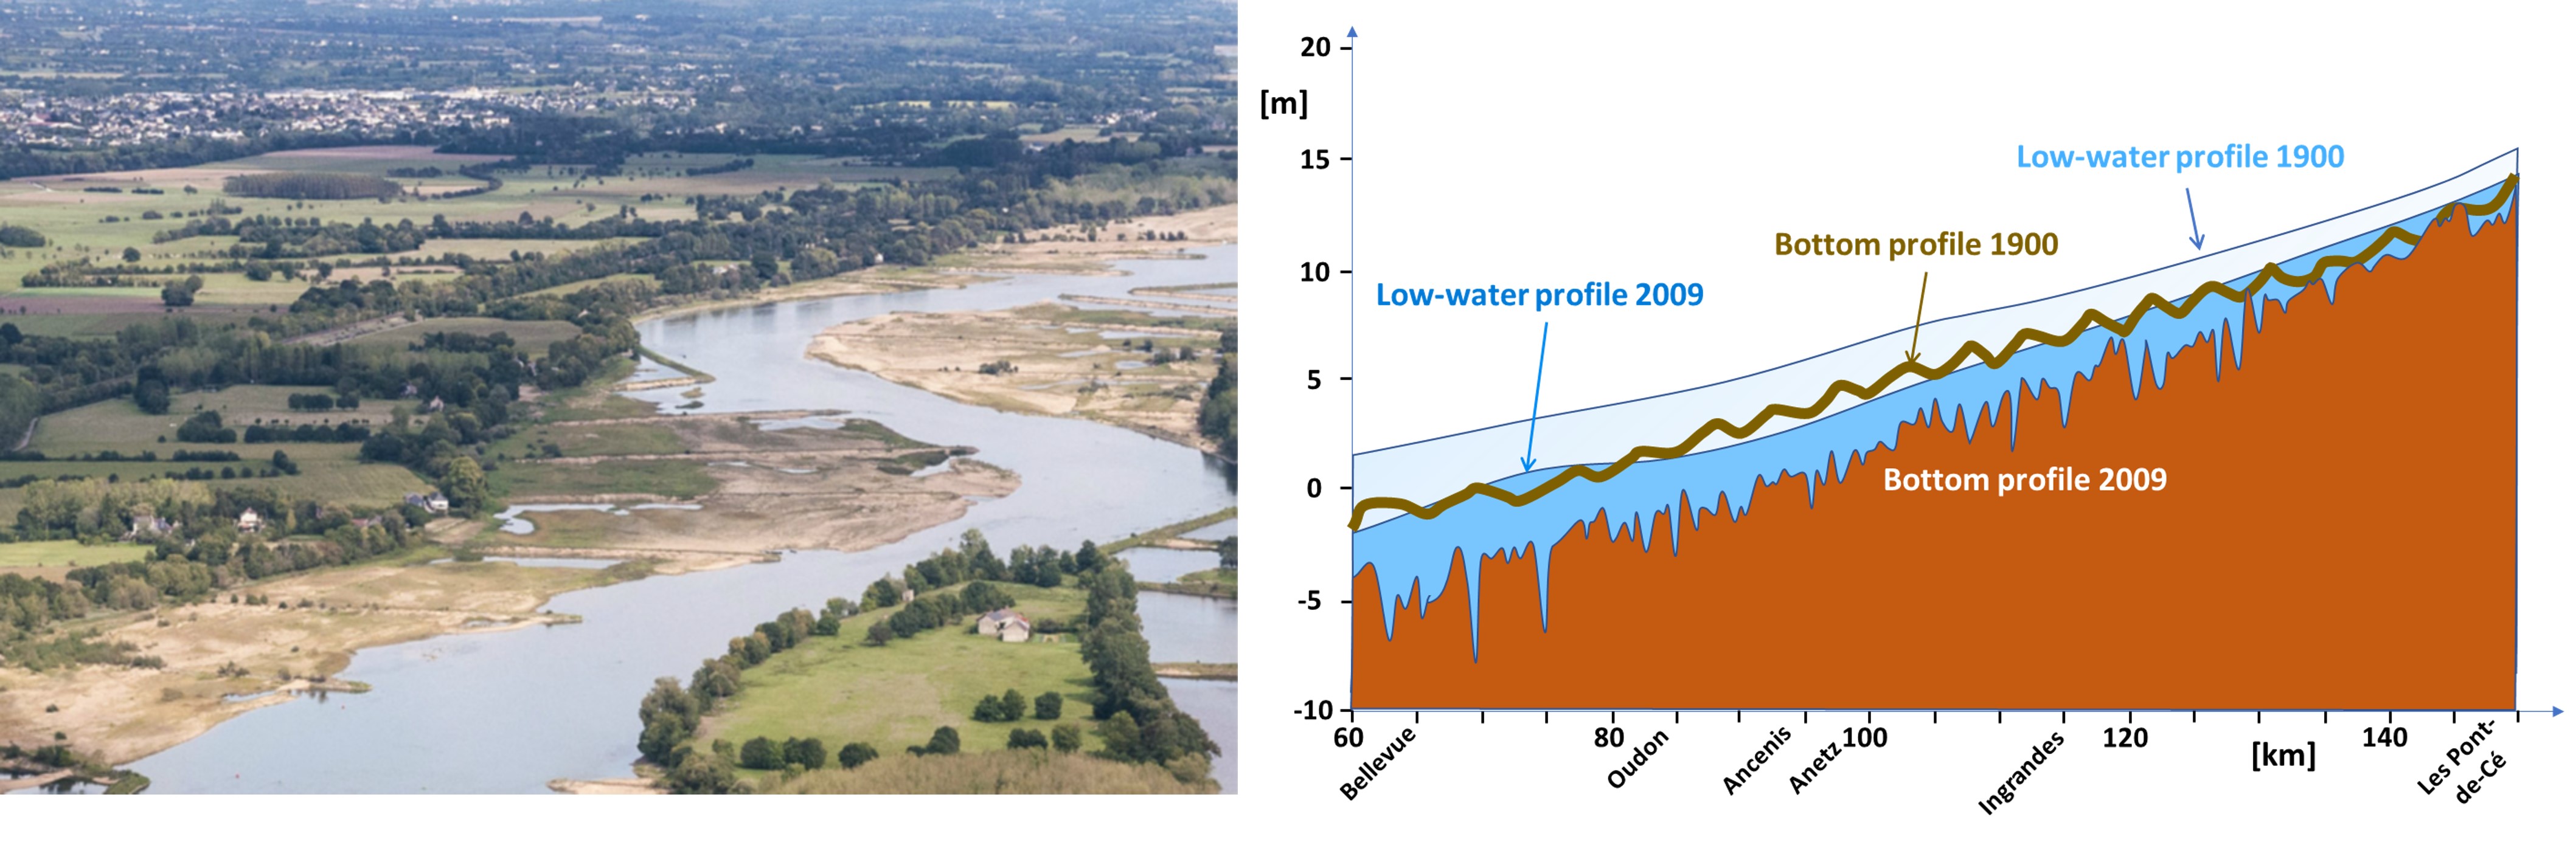
| 20:19, 16 June 2023 | LoireGroins.jpg (file) |  |
632 KB | Dronkers J | Channel incision Loire tidal river. Left panel: Groins in the Loire tidal river near Anetz. Photo credit GIP Loire Estuaire. Right panel: Lowering of the river bed along the thalweg due to channel constriction. Redrawn from VNF (2019). | 1 |
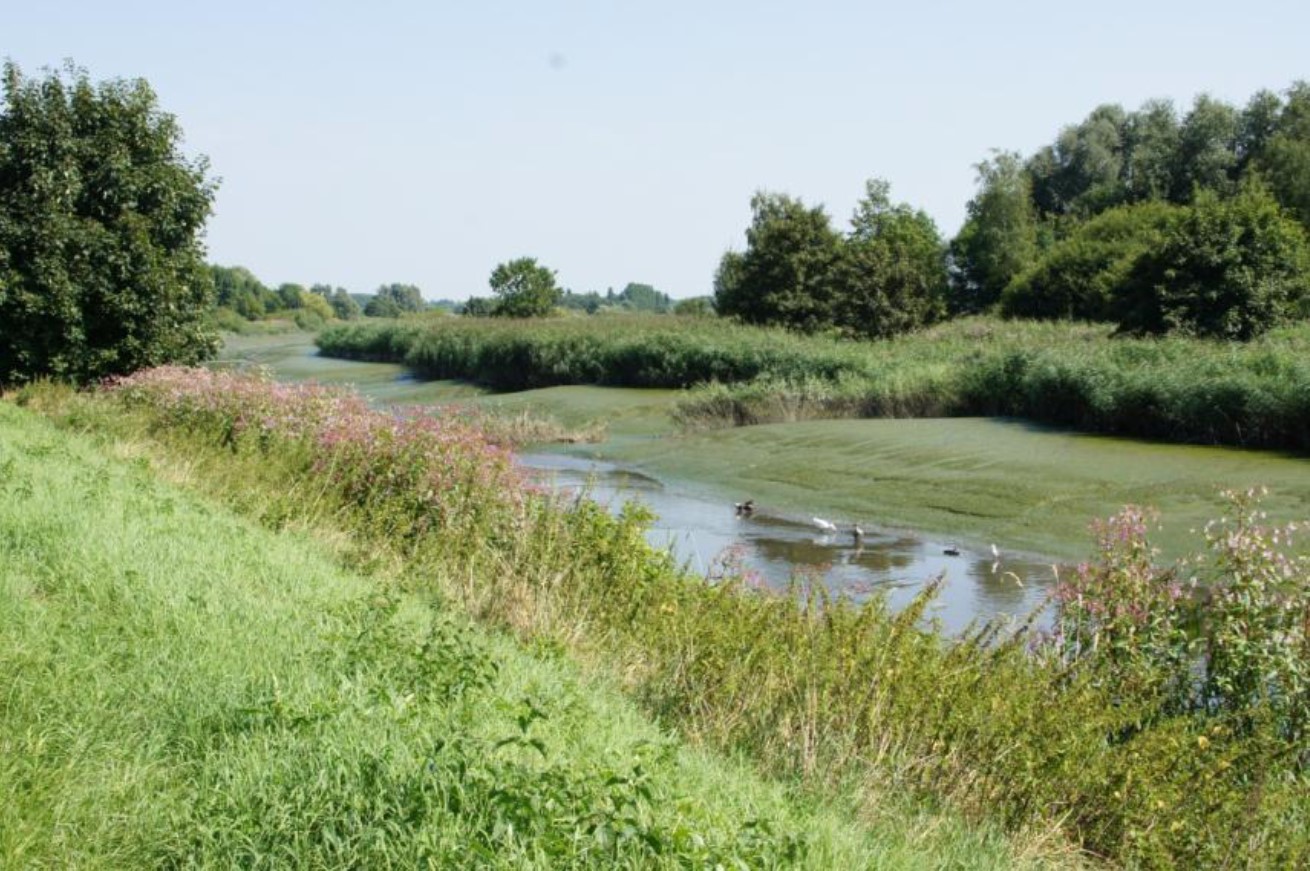
| 10:25, 16 June 2023 | ScheldeTidalRiver.jpg (file) |  |
279 KB | Dronkers J | Floodplain of the Scheldt tidal river at low water, downstream of Gentbrugge. Photo credit Waterwegen en Zeekanaal NV. | 1 |
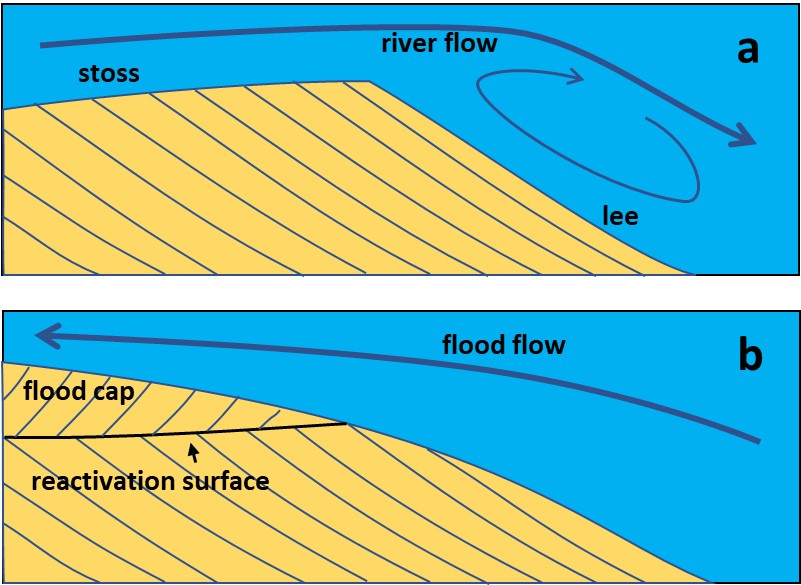
| 20:41, 15 June 2023 | TidalRiverDunes.jpg (file) |  |
108 KB | Dronkers J | Cross bedding of tidal river dunes. Panel a: Cross bed dipping (grain avalanches) to the right in unidirectional river flow. Panel b. Herringbone cross bedding. The flood flow has eroded the top of the river (ebb flow) dune, creating a flood cap with c... | 1 |
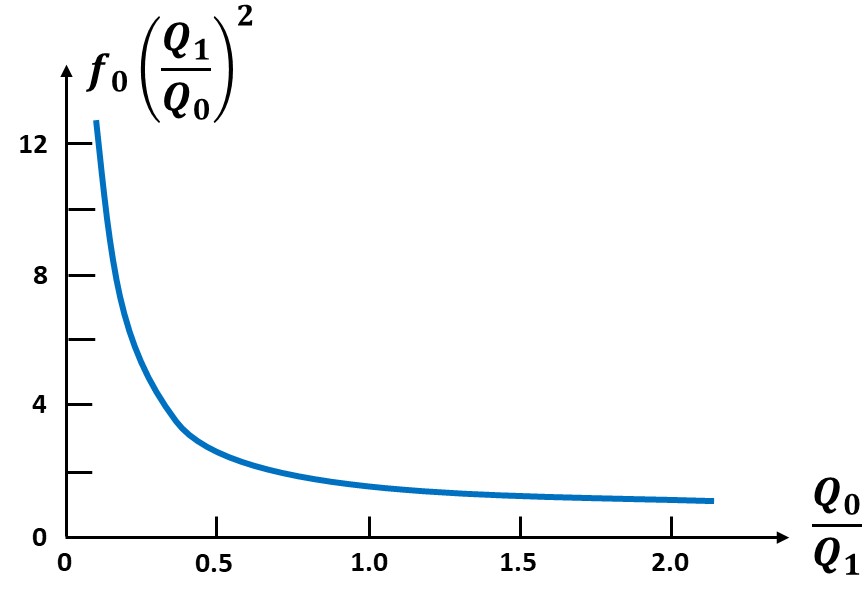
| 13:57, 6 June 2023 | MeanFriction.jpg (file) |  |
32 KB | Dronkers J | Contribution of friction to the mean water level gradient in a tidal river. | 1 |
| 13:57, 6 June 2023 | FrictionContributions.jpg (file) |  |
47 KB | Dronkers J | Contribution of friction to non-tidal and tidal components of the water level gradient in a tidal river. | 1 |
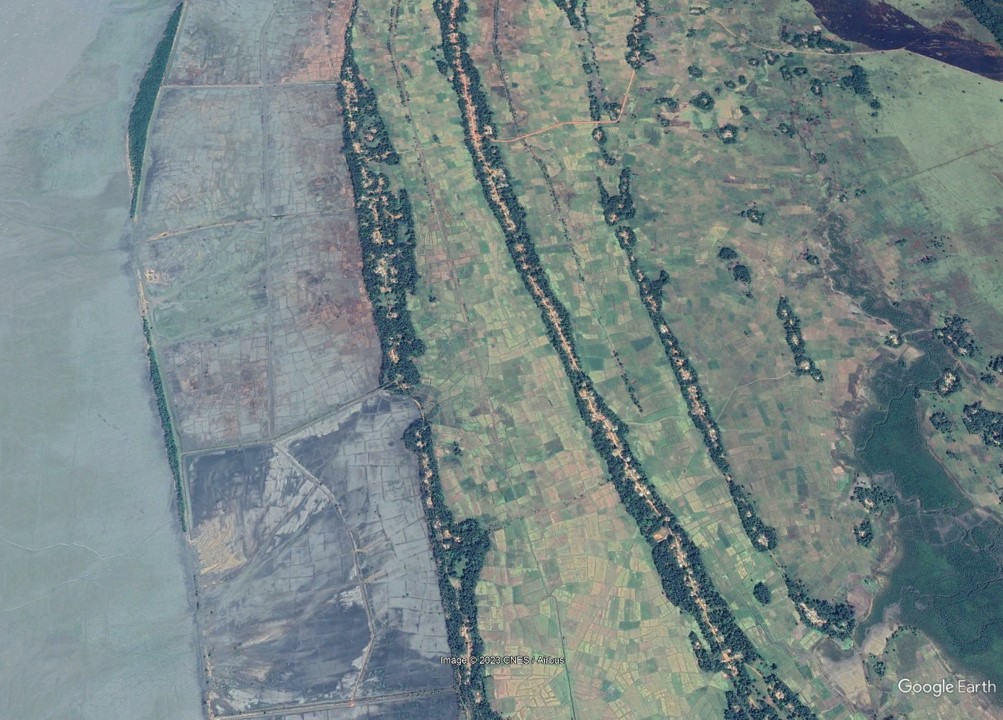
| 15:21, 22 May 2023 | ChenierPlainGuinee.jpg (file) |  |
220 KB | Dronkers J | Chenier plain in Guinée (West Africa). Image Google Earth. | 1 |
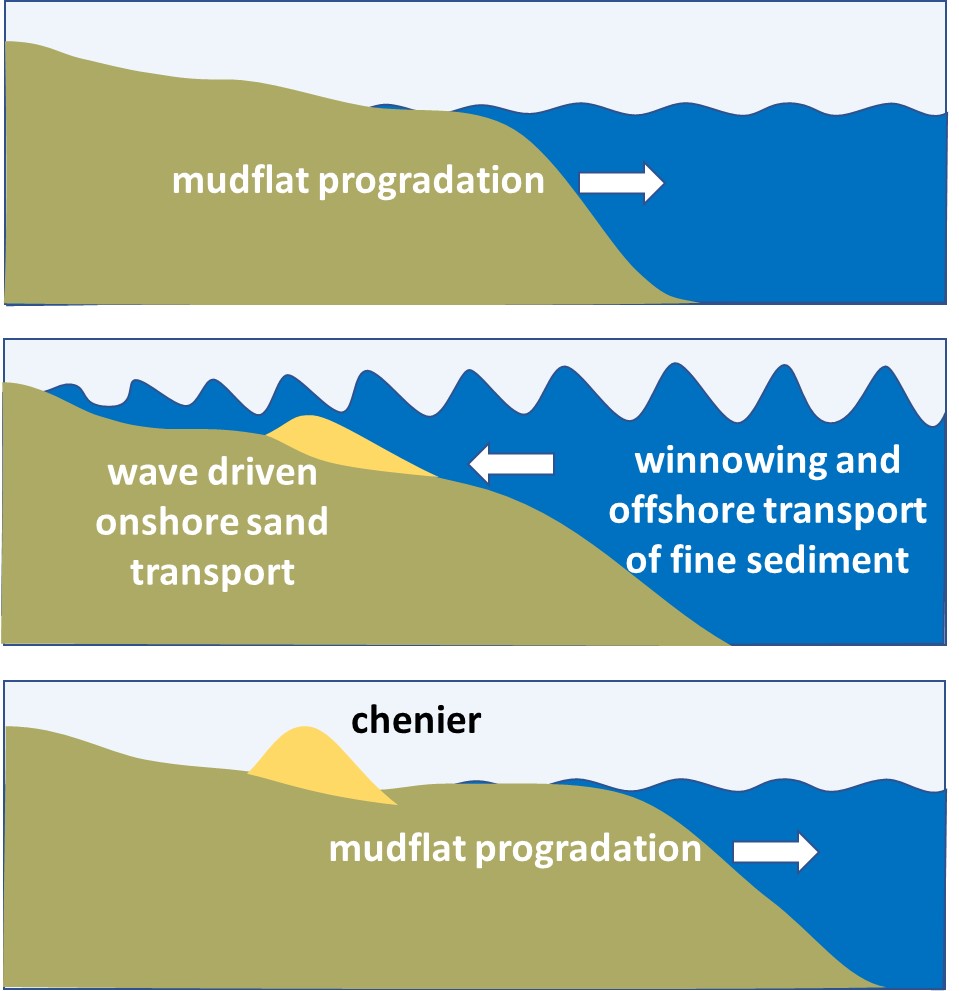
| 11:18, 22 May 2023 | ChenierFormation.jpg (file) |  |
107 KB | Dronkers J | Schematic of the stages of chenier formation. Top: Prograding mudflat including some sand and shells. Middle: Winnowing and offshore transport of mud by energetic wave action and onshore transport of the resulting sandy/shelly top layer. Bottom: Mudfla... | 1 |
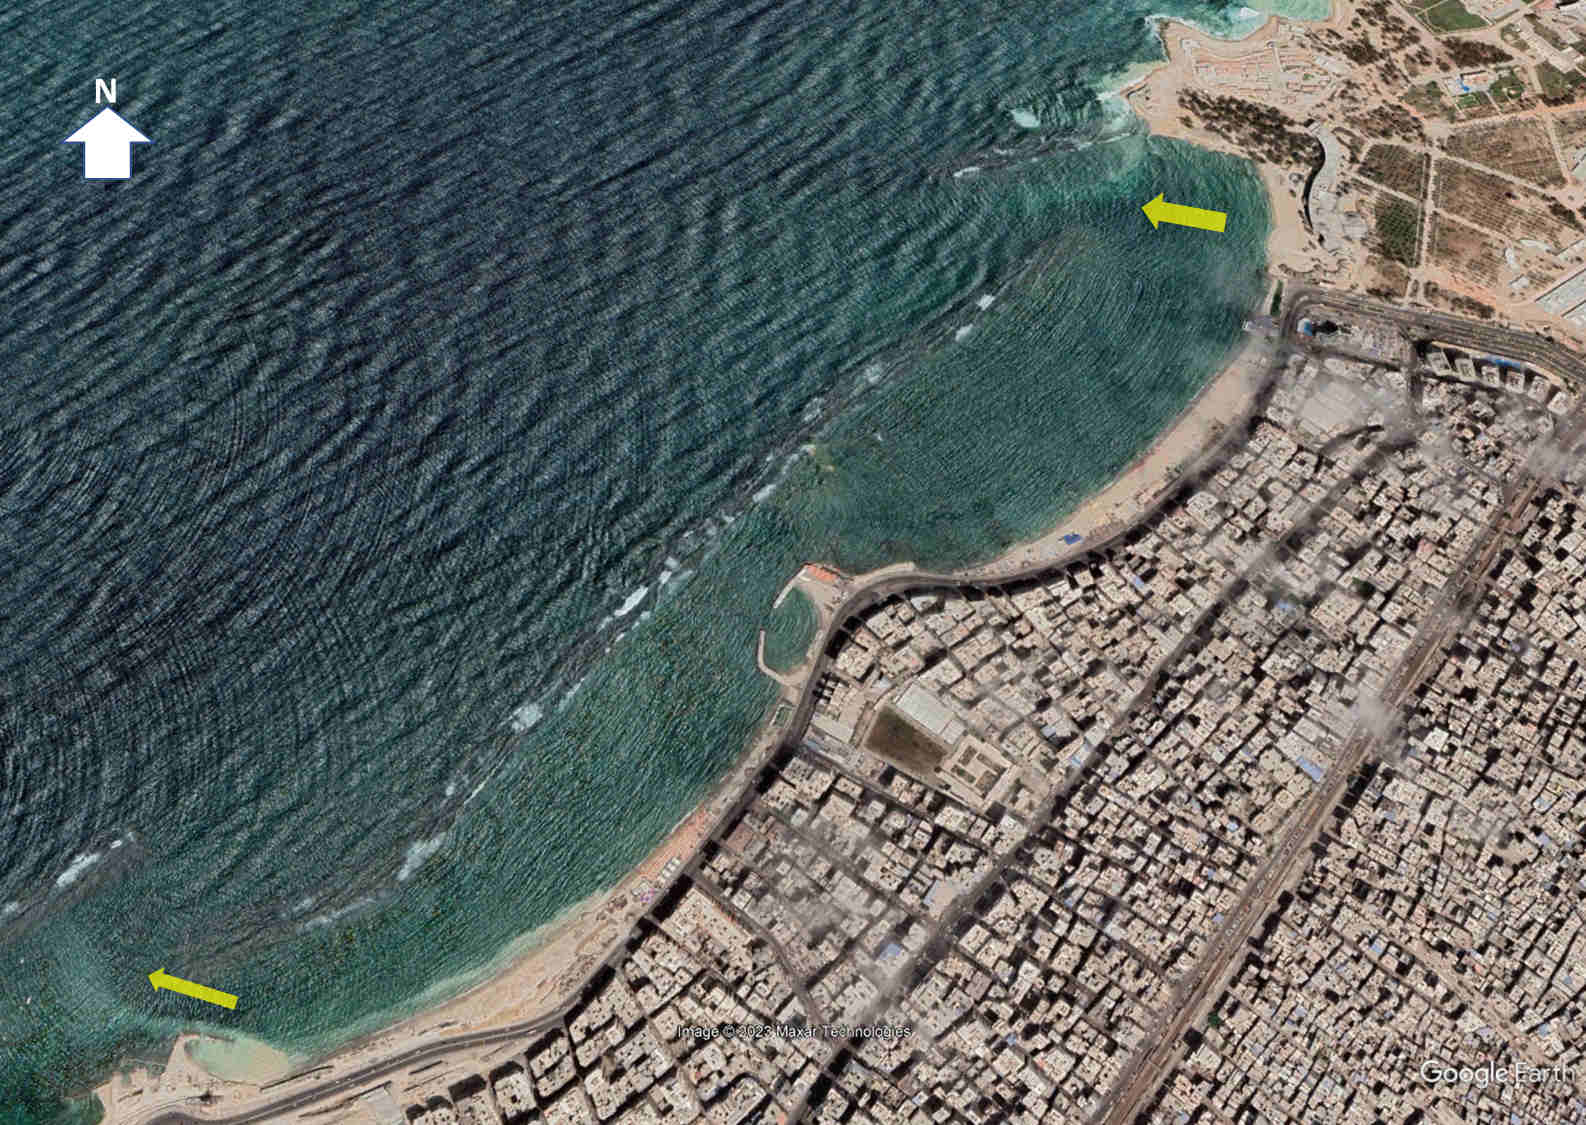
| 21:59, 16 May 2023 | MandaraRip.jpg (file) |  |
184 KB | Dronkers J | Wave transmission over a submerged breakwater at Mandara beach, Alexandria (Egypt). The yellow arrows indicate the location of rip currents. | 1 |
| 23:03, 15 May 2023 | WaveTransmission.jpg (file) | 99 KB | Dronkers J | Wave transmission over a low-crested breakwater and mathematical symbols. | 1 | |
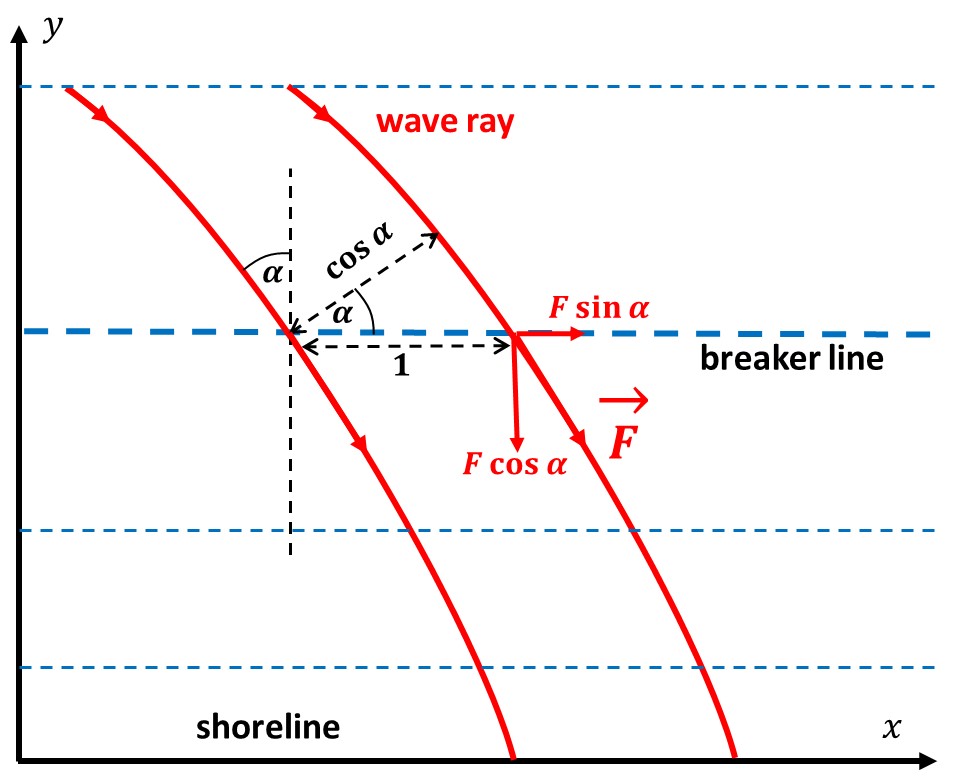
| 16:03, 9 May 2023 | EnergyFlux.jpg (file) |  |
81 KB | Dronkers J | The longshore component of the wave energy flux trough the breaker depth contour per unit contour length is given by <math>F \cos\alpha \sin\alpha</math>. | 1 |
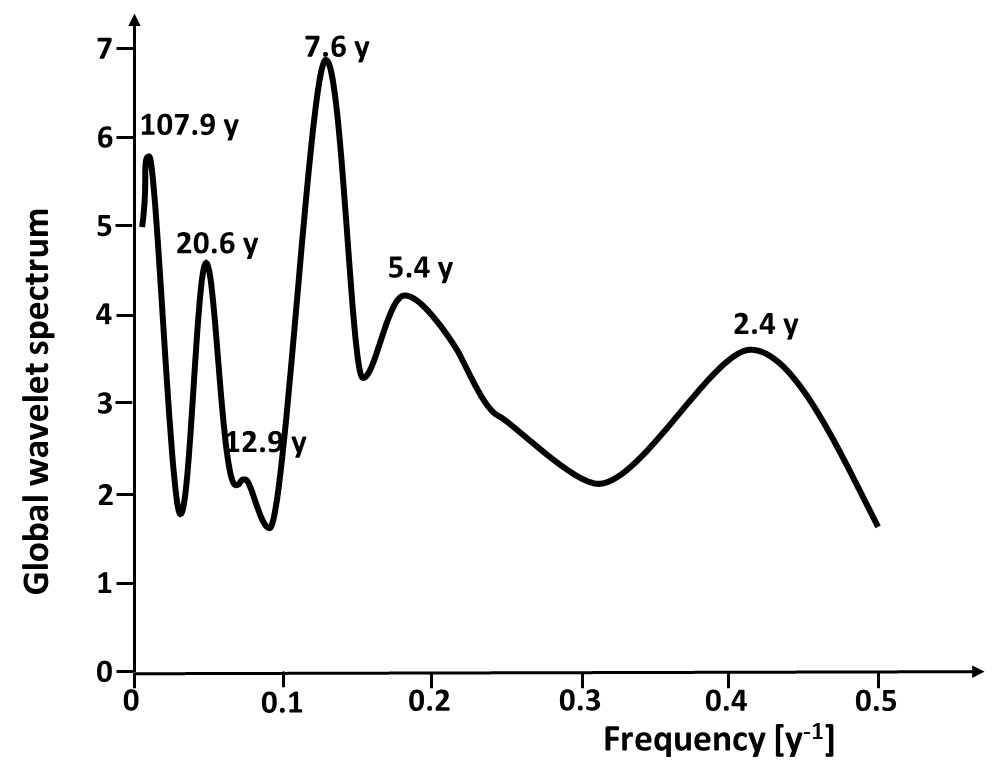
| 18:04, 8 May 2023 | NAOspectrum.jpg (file) |  |
63 KB | Dronkers J | Global NAO spectrum based on wavelet analysis of the NAO index annual time series for the period 1860-2005. Redrawn after Massei et al. (2007). | 1 |
| 17:24, 5 May 2023 | AlexandriaAbuQirBeach.JPG (file) |  |
385 KB | Dronkers J | Abu Qir beach, Alexandria. | 1 |
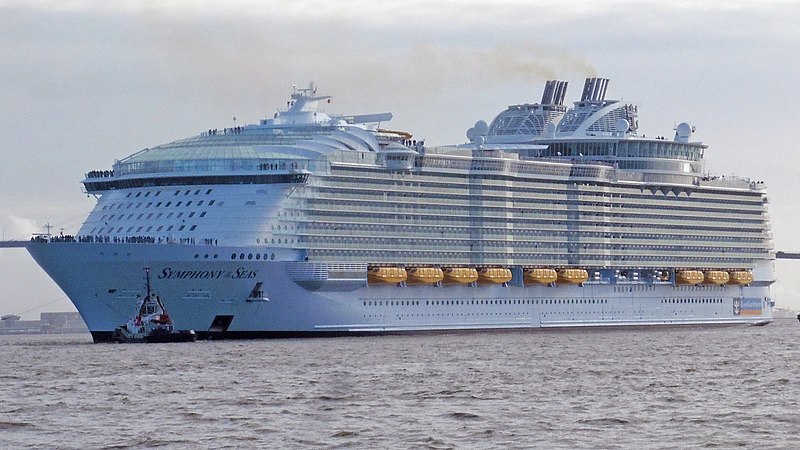
| 15:12, 5 May 2023 | SymphonyOfTheSeas.jpg (file) |  |
99 KB | Dronkers J | The mega-cruise ship Royal Caribbean’s Symphony of the Seas. Photo credit Darthvadrouw, Creative Commons Licence. | 1 |
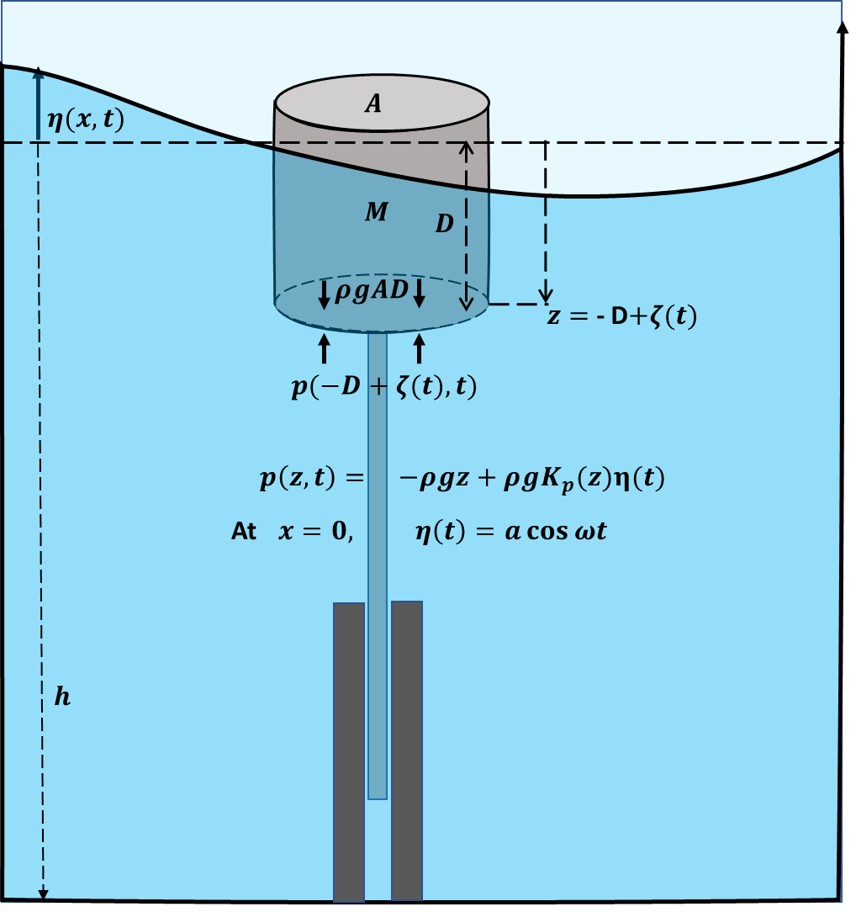
| 12:42, 4 May 2023 | BuoyMotion.jpg (file) |  |
74 KB | Dronkers J | Balance of vertical forces on a buoy in a wave field. | 1 |
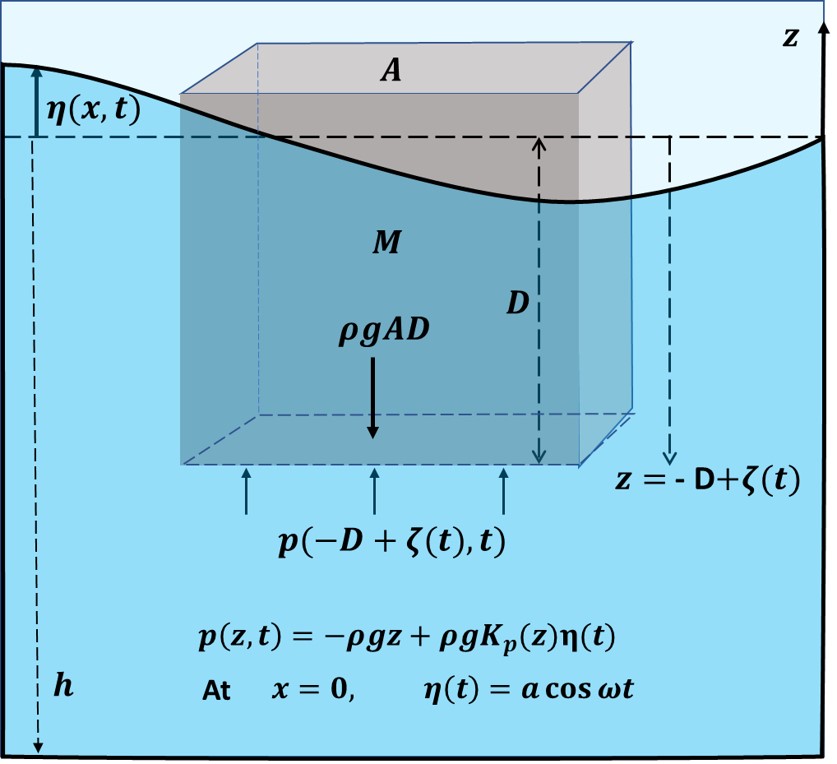
| 10:36, 4 May 2023 | BuoyantBody.jpg (file) |  |
75 KB | Dronkers J | Balance of vertical forces on a buoyant body in a wave field . | 1 |
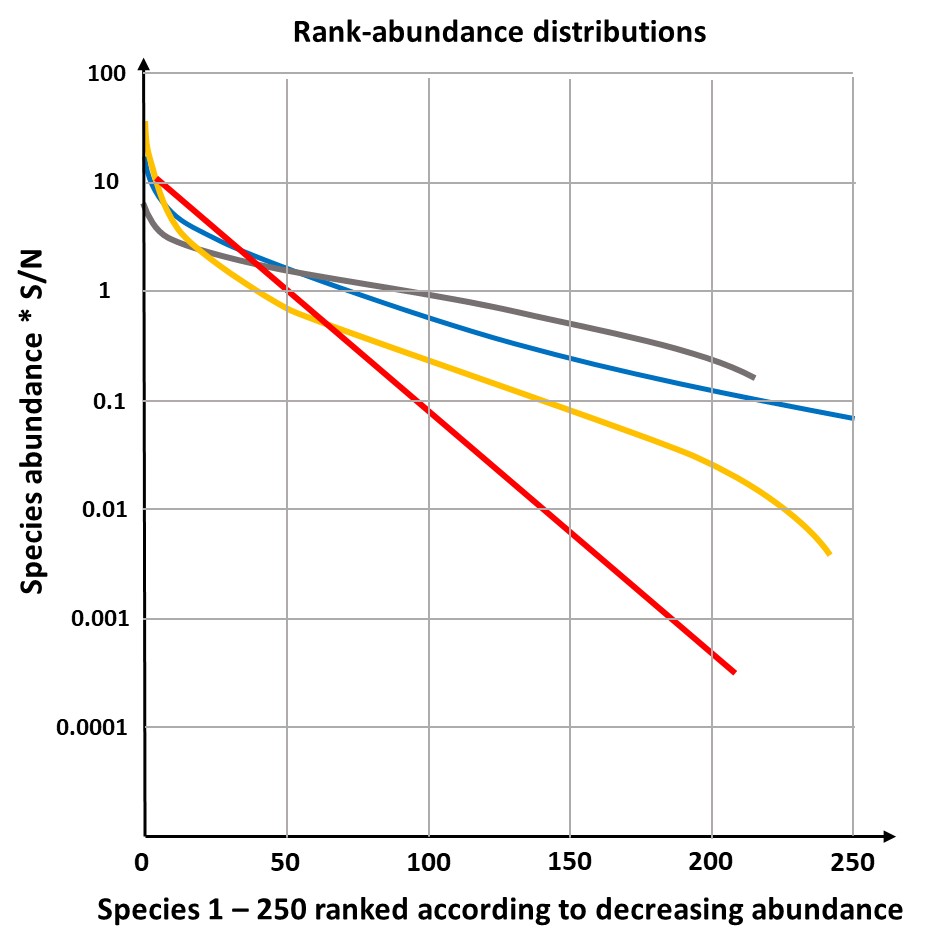
| 18:07, 27 April 2023 | RankAbundanceDistributions.jpg (file) |  |
95 KB | Dronkers J | Rank-abundance distributions according to the four models 'log series model' (blue curve), 'log-normal model' (yellow curve), 'geometric model' (red curve) and 'broken-stick model' (grey curve). | 2 |
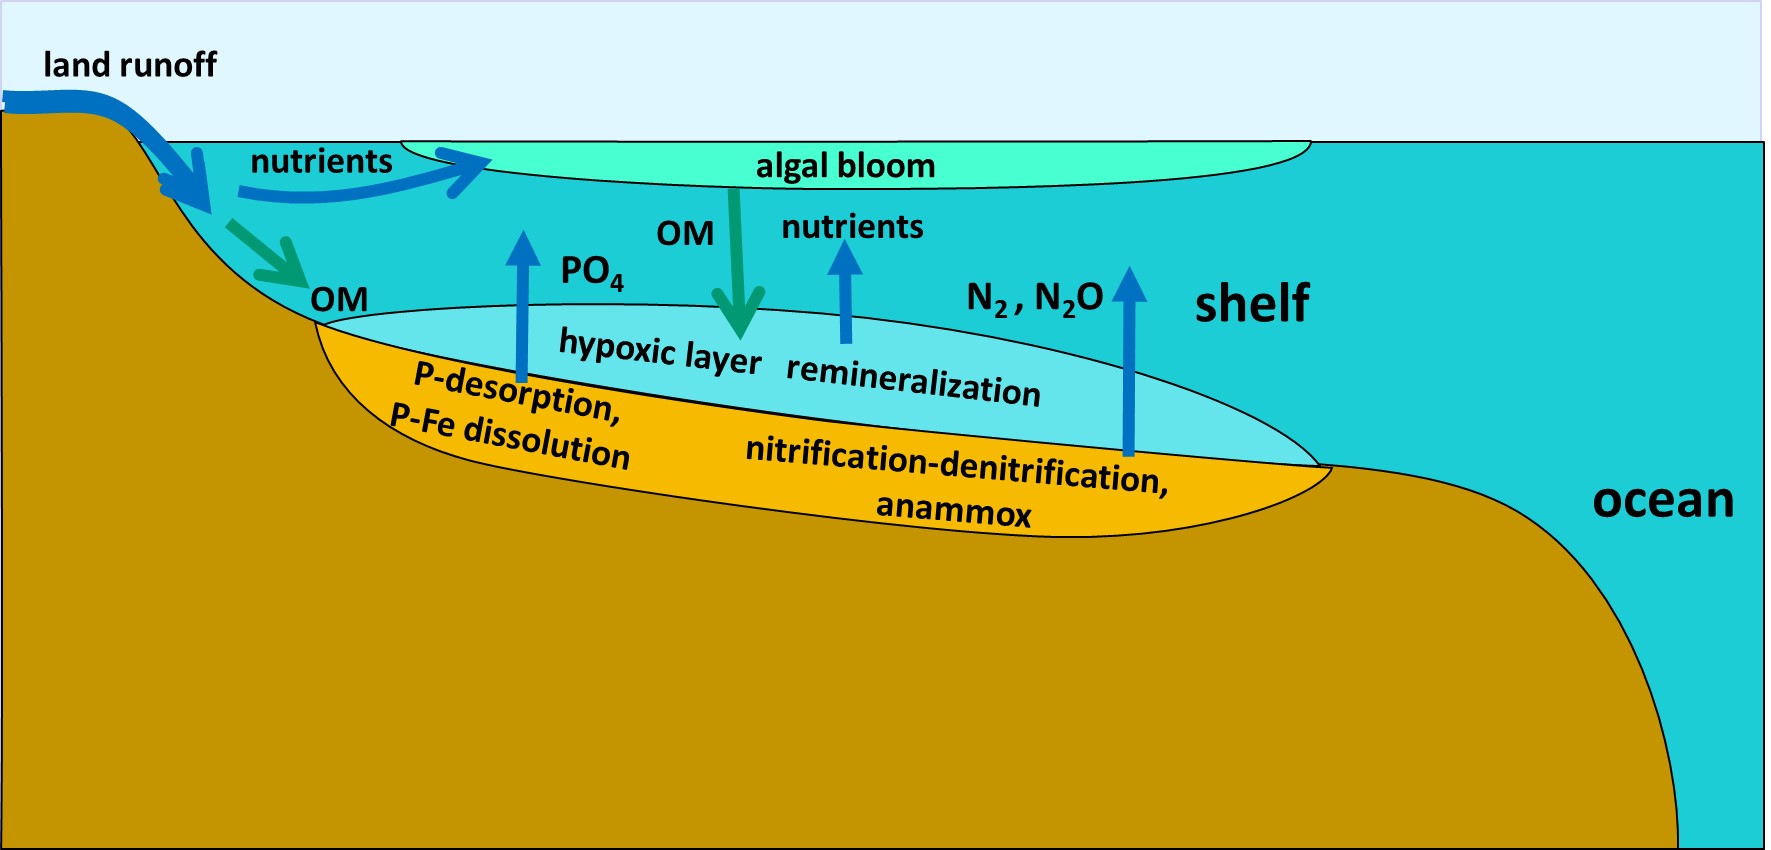
| 11:32, 25 April 2023 | HypoxiaNutrientConversion.jpg (file) |  |
133 KB | Dronkers J | Schematic influence hypoxia on nutrient conversion. OM=organic matter. Redrawn after Dai et al. (2023). | 1 |
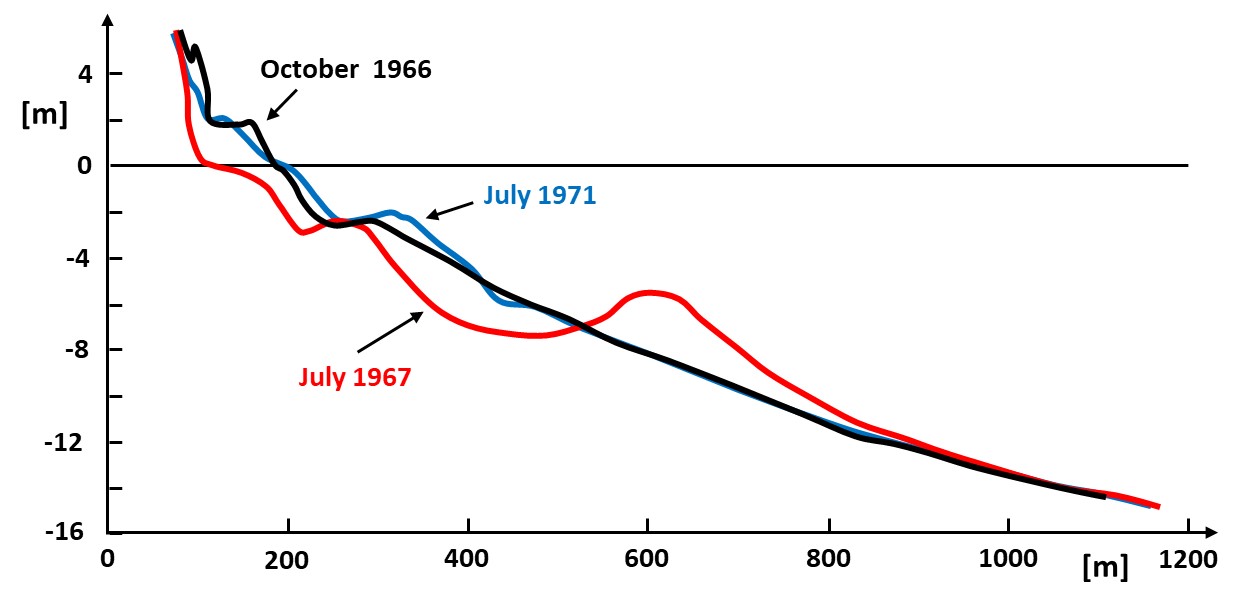
| 22:11, 23 April 2023 | GoldCoastCyclone.jpg (file) |  |
64 KB | Dronkers J | Gold Coast, Australia, before and after the June 1967 cyclone. Observed shoreface profiles showing recovery of the initial close-to-equilibrium profile after strong perturbation by an extreme event. Redrawn after Patterson, D.C. and Nielsen, P. (2016). | 1 |
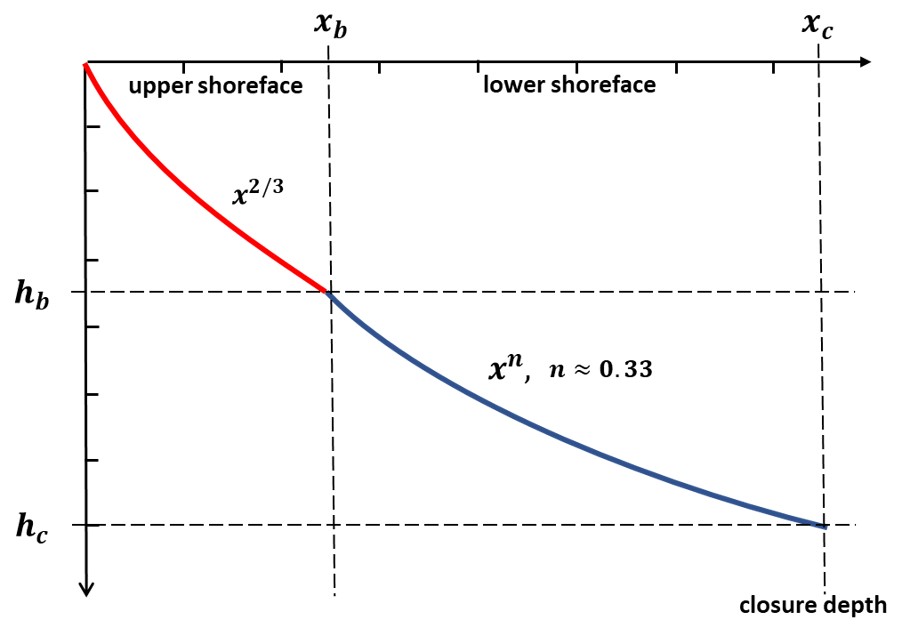
| 11:24, 20 April 2023 | UpperLowerShoreface.jpg (file) |  |
46 KB | Dronkers J | Theoretical equilibrium profile for the upper and lower shoreface. | 1 |
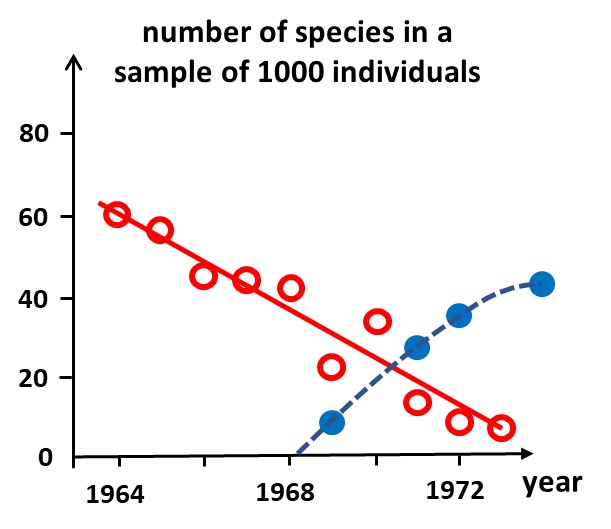
| 20:47, 18 April 2023 | RarefactionPlot.jpg (file) |  |
43 KB | Dronkers J | Rarefaction plot. Red: Benthic community altered by increased organic input. Blue: Benthic community recovering after abatement of organic input. Redrawn after Pierson and Rosenberg (1978). | 1 |
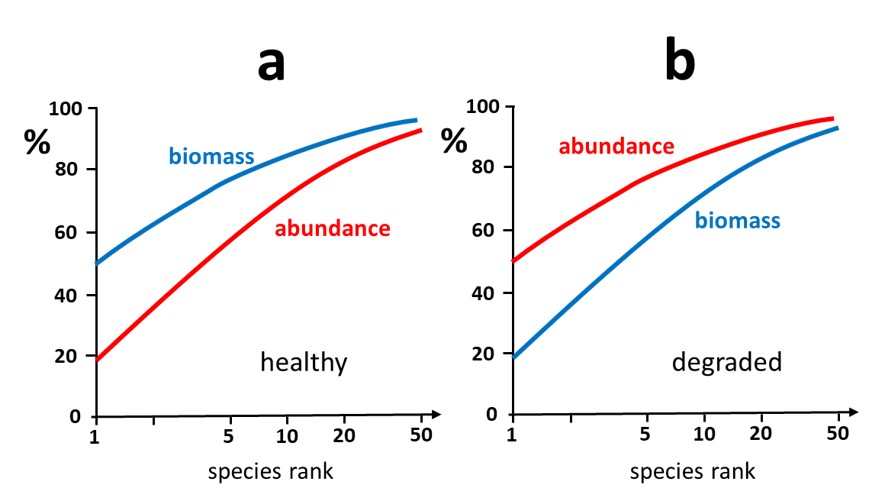
| 20:45, 18 April 2023 | BiomassAbundancePlot.jpg (file) |  |
53 KB | Dronkers J | Comparison of k-dominance for abundance and biomass. a. Typical plot for a healthy ecosystem. b. Typical plot for a stressed degraded ecosystem. Redrawn after Warwick 1986. | 1 |
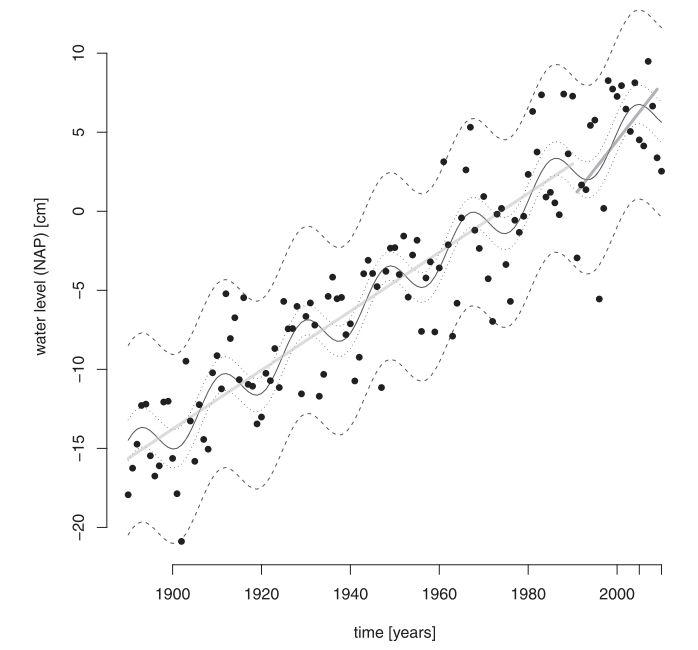
| 17:38, 7 April 2023 | Nodal-tide-estimate-nl.png (file) |  |
83 KB | FedorBaart | 1 | |
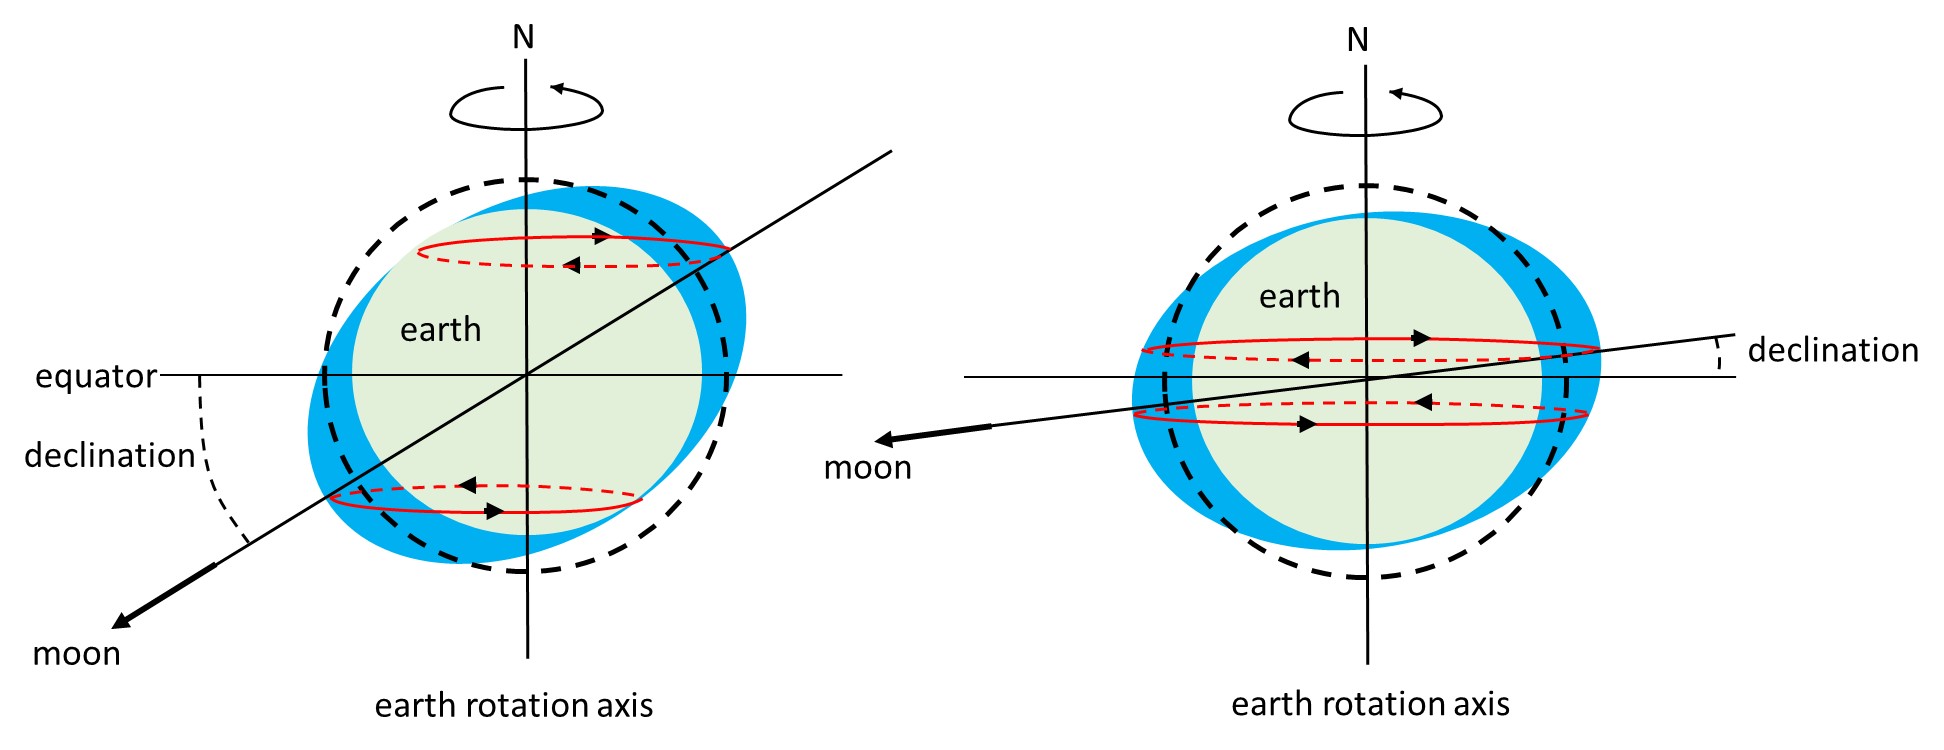
| 17:20, 24 March 2023 | MoonDeclination.jpg (file) |  |
131 KB | Dronkers J | Schematic of tide generation for different (exagerated) moon declinations. | 1 |
| 23:28, 23 March 2023 | MMMHW.jpg (file) |  |
75 KB | Dronkers J | Modulation of the monthly mean high water by the lunar nodal cycle. Blue curve: Case of semidiurnal tidal dominance (e.g. Brest, France). Red curve: Case of diurnal dominance (e.g. Victoria, Canada). Adapted from Peng et al. (2019) | 1 |
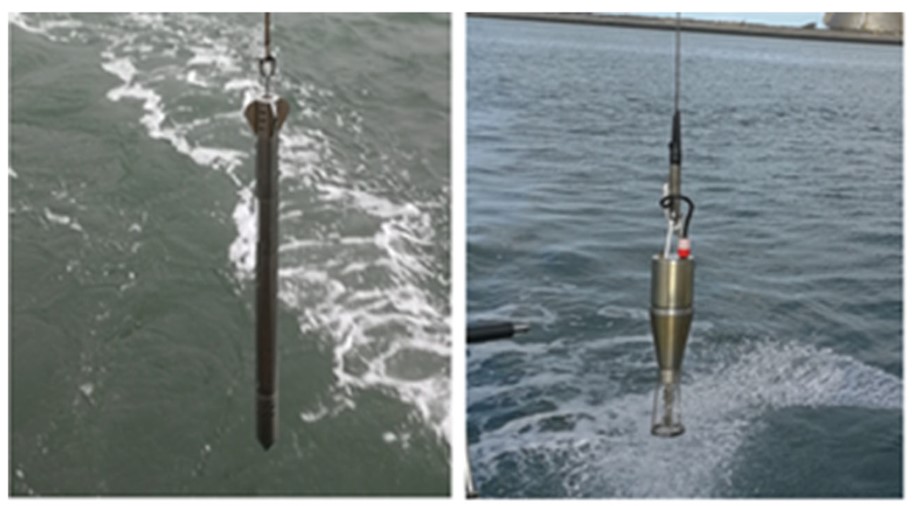
| 12:47, 27 February 2023 | YieldStressProbes.jpg (file) |  |
75 KB | Dronkers J | Measurement devices for in situ yield stress determination. Left: Graviprobe. Right: Rheotune. From Kirichek, A., Shakeel, A. and Chassagne, C. 2020. Using in situ density and strength measurements for sediment maintenance in ports and waterways. J. So... | 1 |
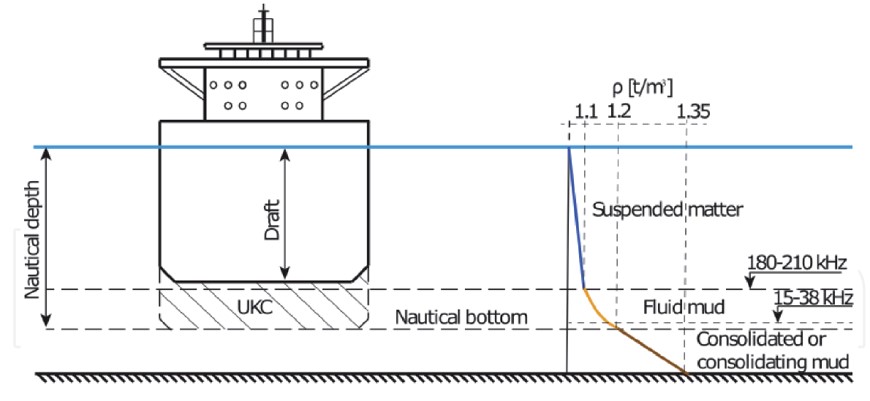
| 12:46, 27 February 2023 | NauticalDepthScheme.jpg (file) |  |
53 KB | Dronkers J | Illustration of nautical depth. From Kirichek, A., Shakeel, A. and Chassagne, C. 2020. Using in situ density and strength measurements for sediment maintenance in ports and waterways. J. Soils Sediments 20: 2546–2552, Creative Commons International... | 1 |
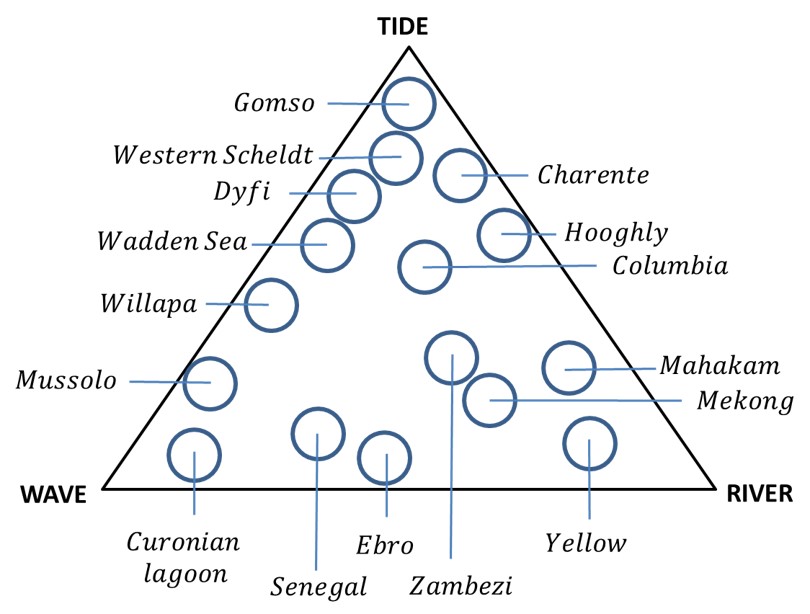
| 16:52, 21 February 2023 | EstuaryClassification.jpg (file) |  |
75 KB | Dronkers J | Estuary classification scheme. | 1 |
| 19:32, 18 February 2023 | TideEstuary.jpg (file) |  |
85 KB | Dronkers J | Schematic plan view of a tide-dominated estuary. | 1 |
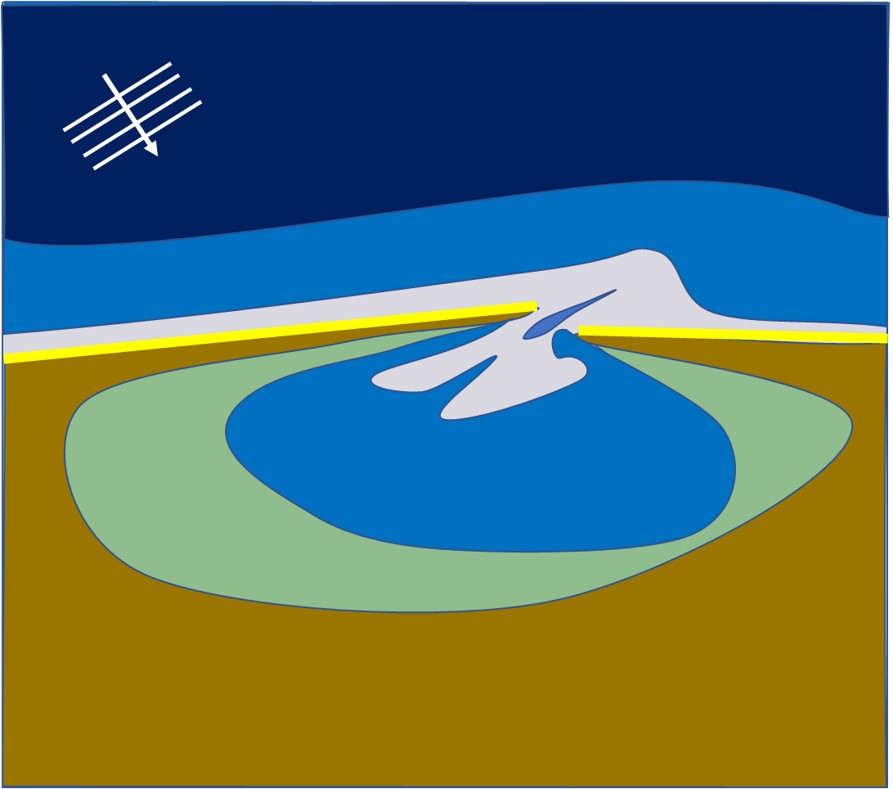
| 19:31, 18 February 2023 | TideRiverEstuary.jpg (file) |  |
115 KB | Dronkers J | Schematic plan view of a tide- and river-dominated estuary. | 1 |
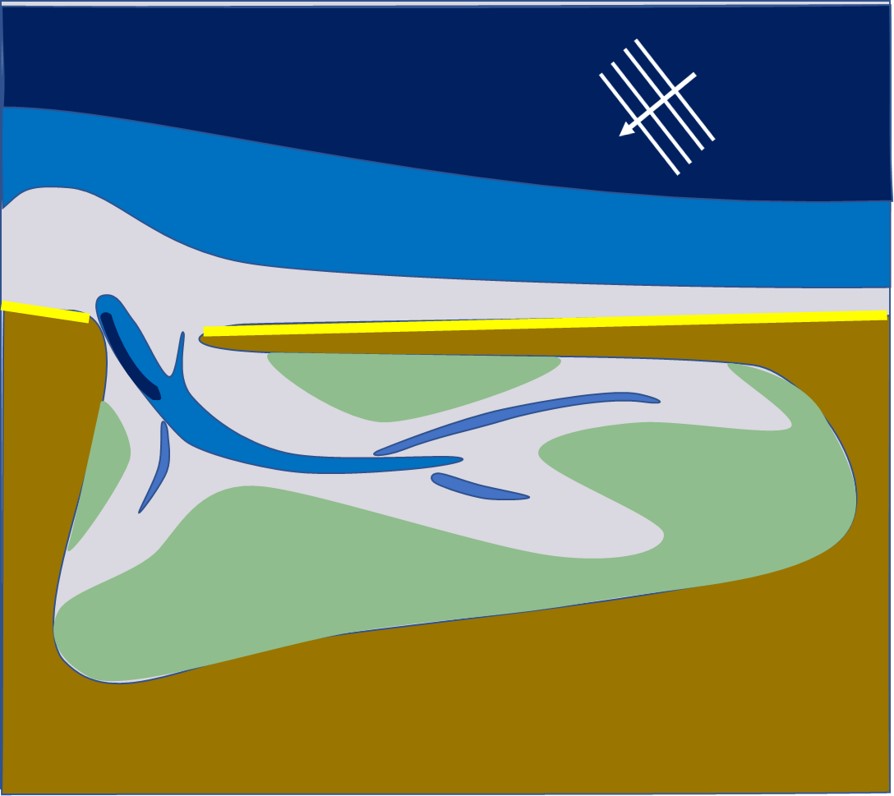
| 19:30, 18 February 2023 | WaveTideEstuary.jpg (file) |  |
62 KB | Dronkers J | Schematic plan view of a wave- and tide-dominated estuary. | 1 |
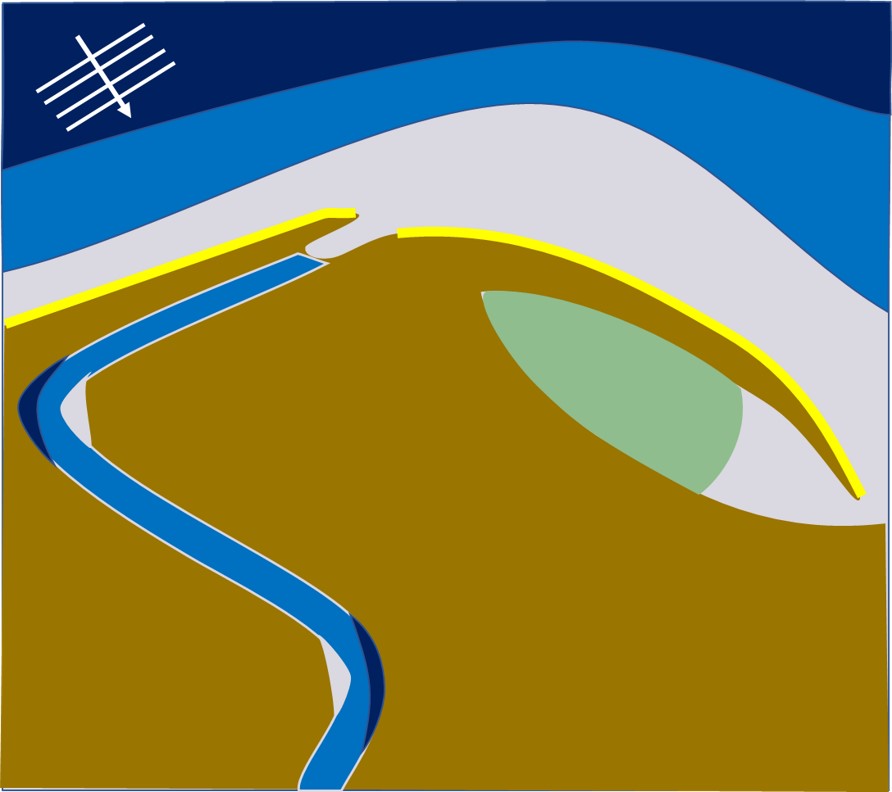
| 19:30, 18 February 2023 | RiverWaveEstuary.jpg (file) |  |
62 KB | Dronkers J | Schematic plan view of a river- and wave-dominated estuary. | 1 |
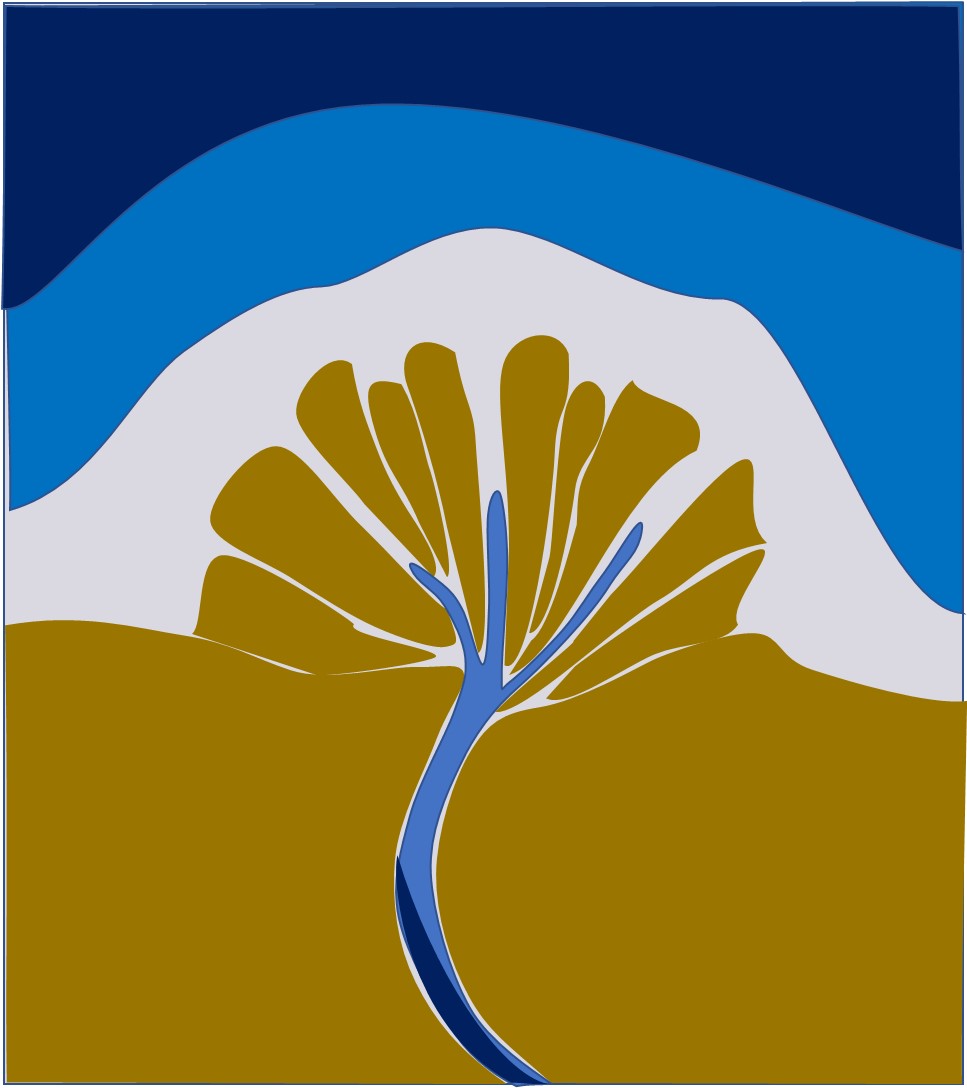
| 19:29, 18 February 2023 | RiverEstuary.jpg (file) |  |
84 KB | Dronkers J | Schematic plan view of a river-dominated estuary. | 1 |
| 19:29, 18 February 2023 | WaveEstuary.jpg (file) |  |
58 KB | Dronkers J | Schematic plan view of a wave-dominated estuary (oblique wave incidence). | 1 |
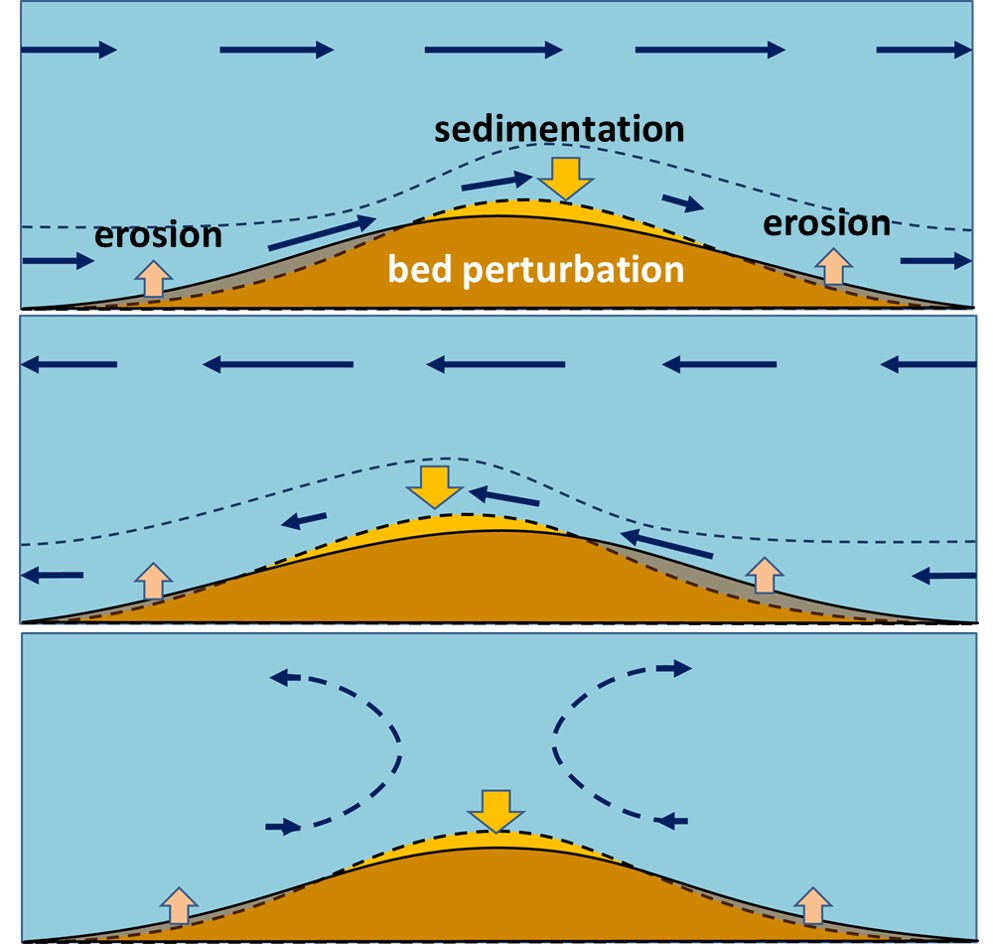
| 13:29, 7 February 2023 | BedformFormation.jpg (file) |  |
116 KB | Dronkers J | Schematic representation of bedform formation. Top: Steady flow from left to right. Two successive stages of bed perturbation developement are brown and yellow, respectively. The dark-blue dotted line is a near-bed streamline. The dark-blue arrows are... | 1 |
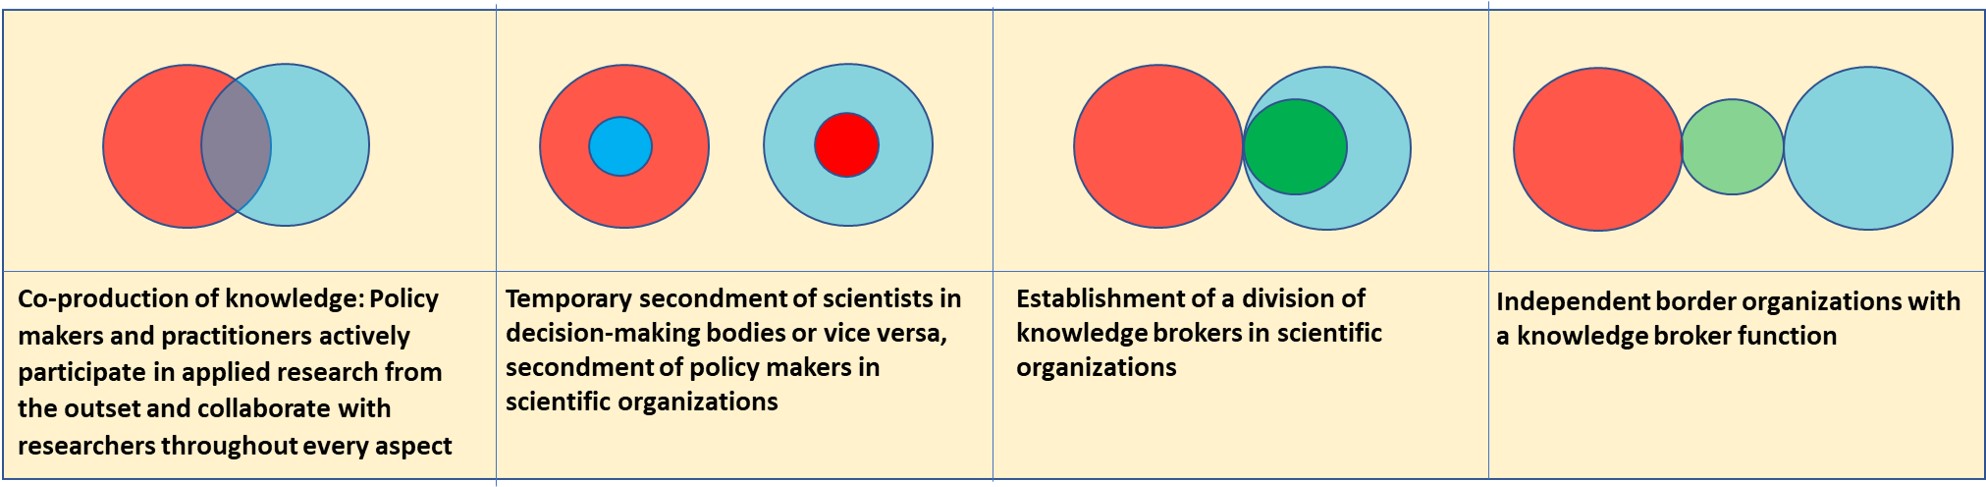
| 12:37, 2 February 2023 | PolicyOrganizationModels.jpg (file) | 156 KB | Dronkers J | Four alternative models for science-policy interaction. Red=Policy, Blue=Research, Green=Broker. After Cvitanovic et al. 2015. | 1 | |
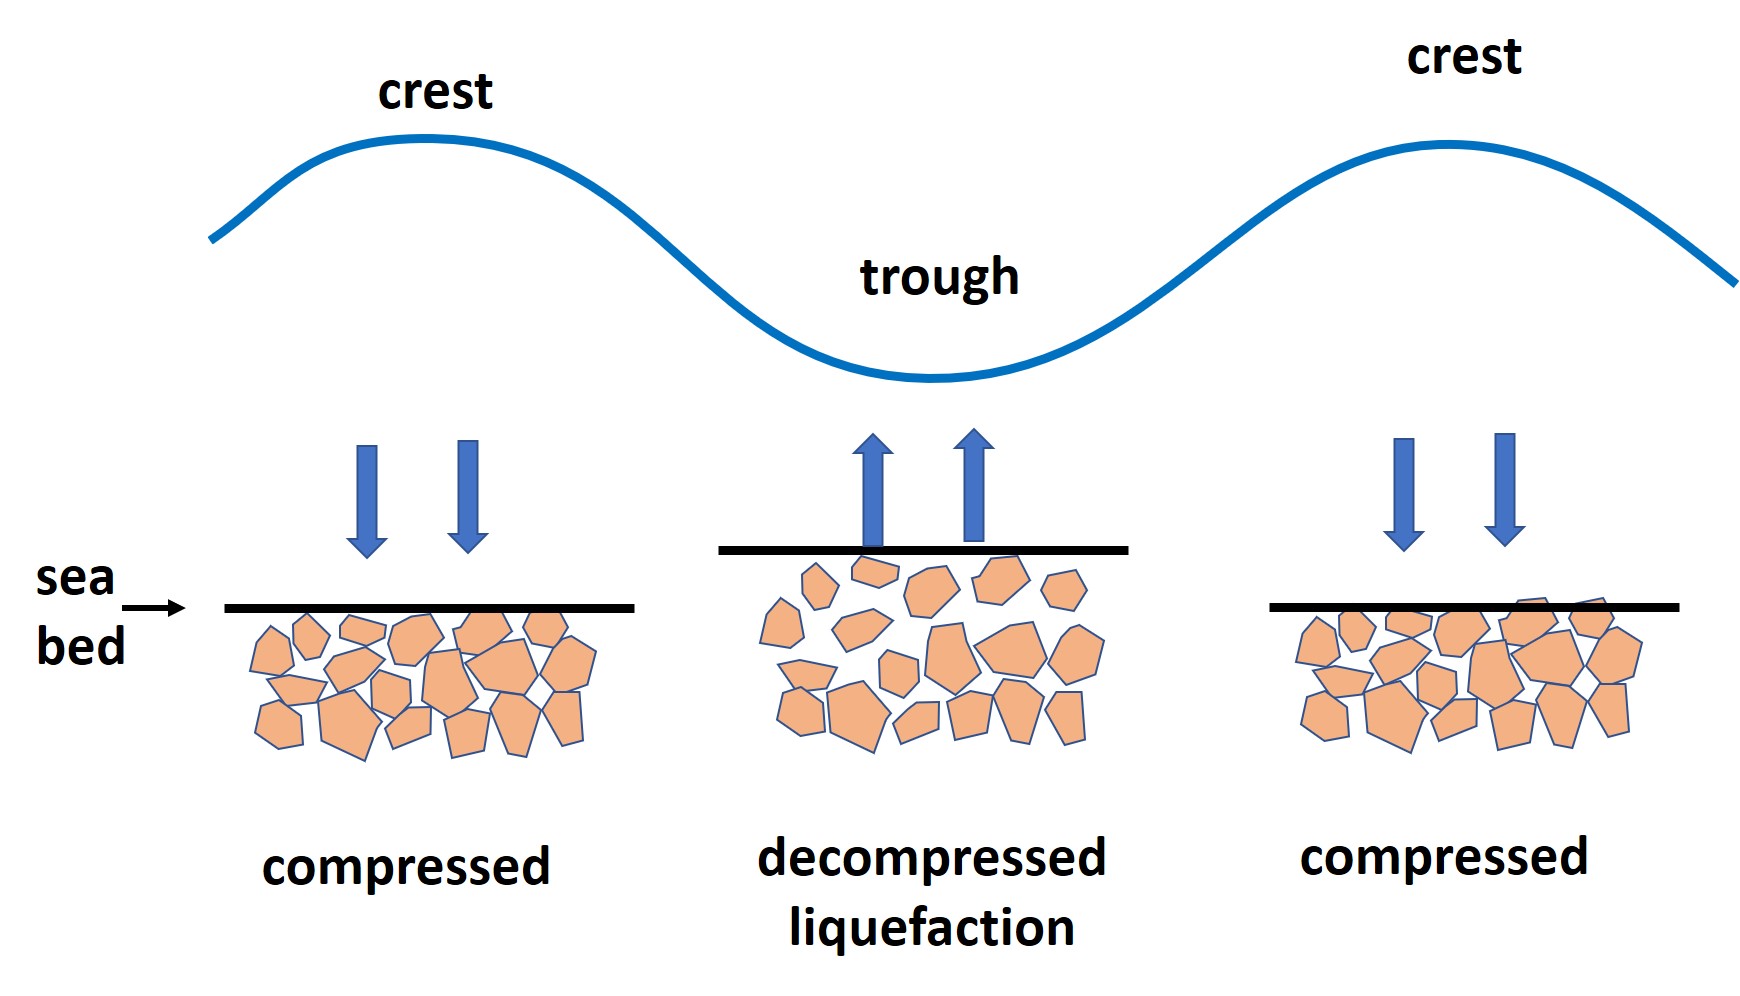
| 17:13, 31 January 2023 | TransientLiquefaction.jpg (file) | 161 KB | Dronkers J | Principle of transient soil liquefaction. After De Groot et al. 2006. | 1 | |
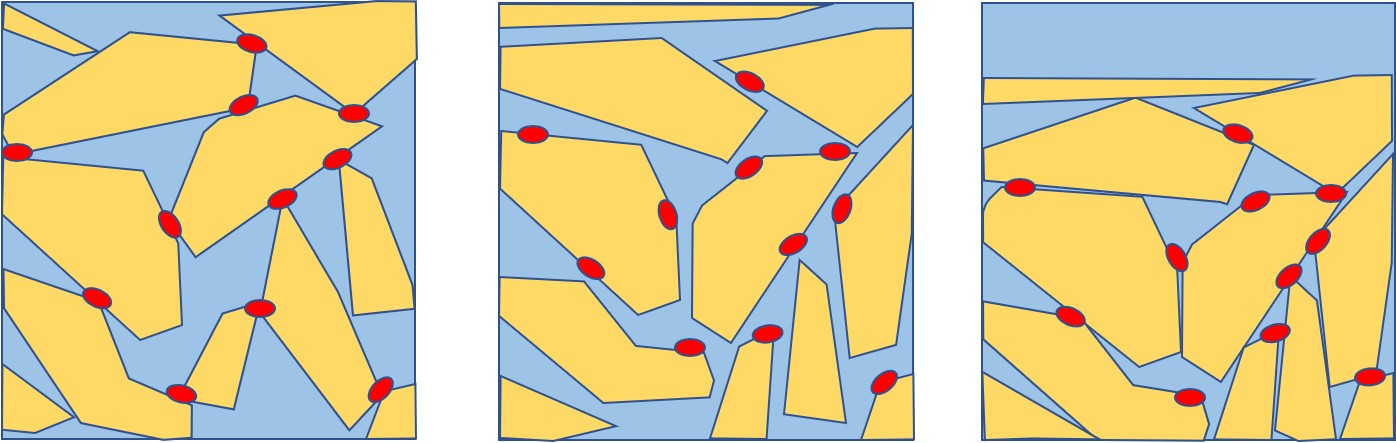
| 17:11, 31 January 2023 | ResidualLiquefaction.jpg (file) |  |
114 KB | Dronkers J | Residual liquefaction process of a silt-clay soil. Silt grains are yellow and clay particles are red. Left panel: Initial loosely packed silt-clay soil. Middle panel: Grain contact points are broken due to wave-induced grain rearrangement and pore pres... | 1 |
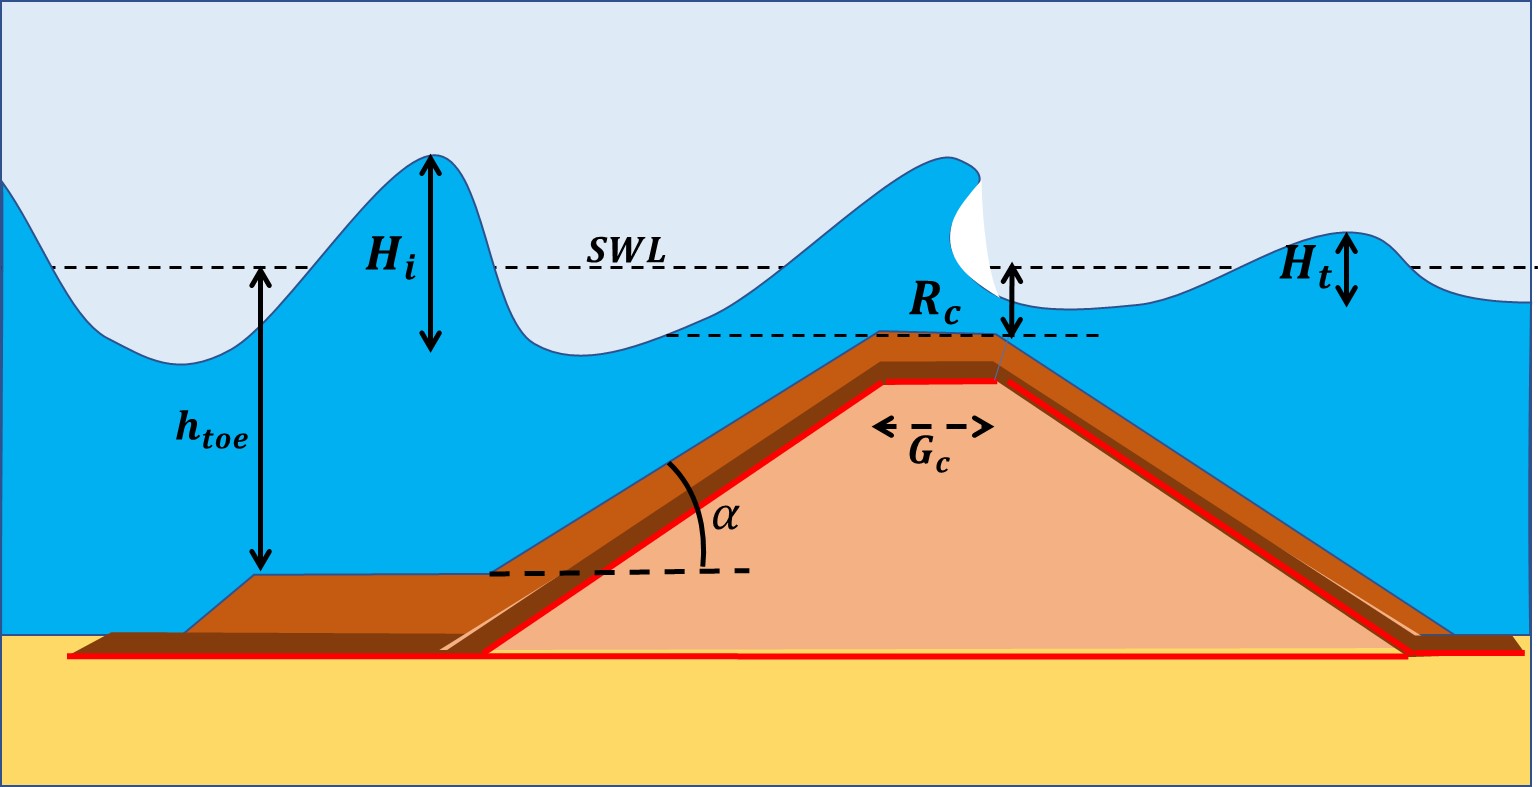
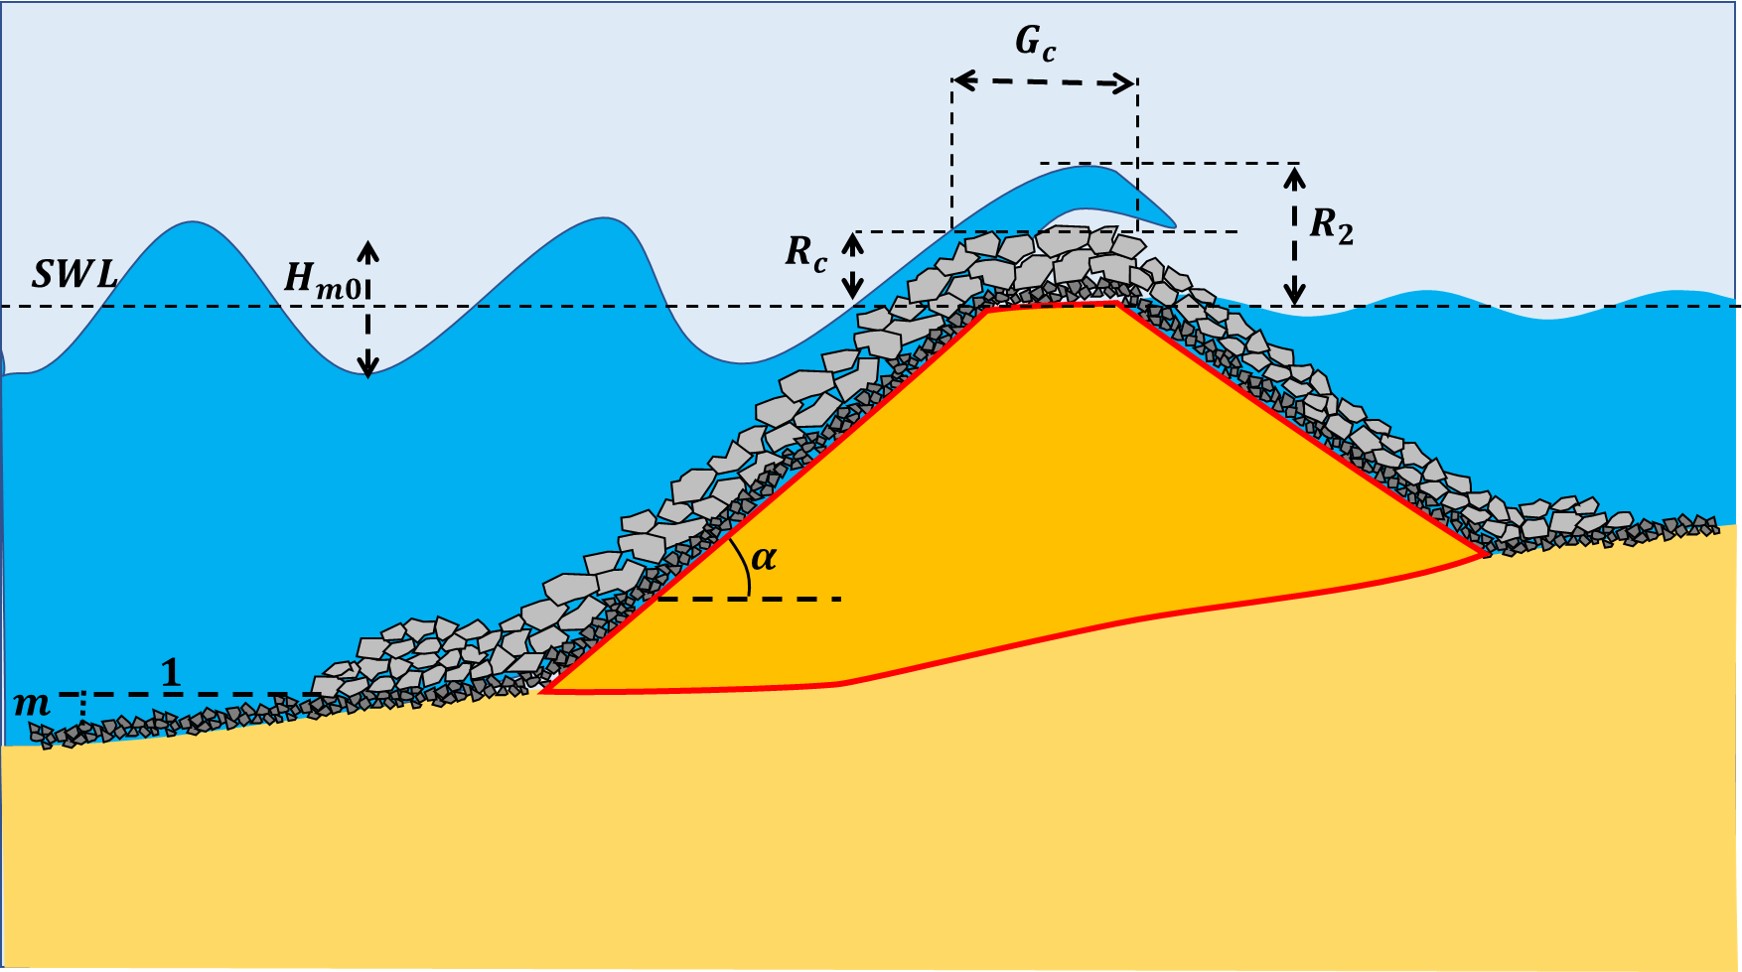
| 21:27, 27 January 2023 | BreakwaterOvertopDef.jpg (file) |  |
169 KB | Dronkers J | Waves overtopping a breakwater; definition of symbols. | 1 |
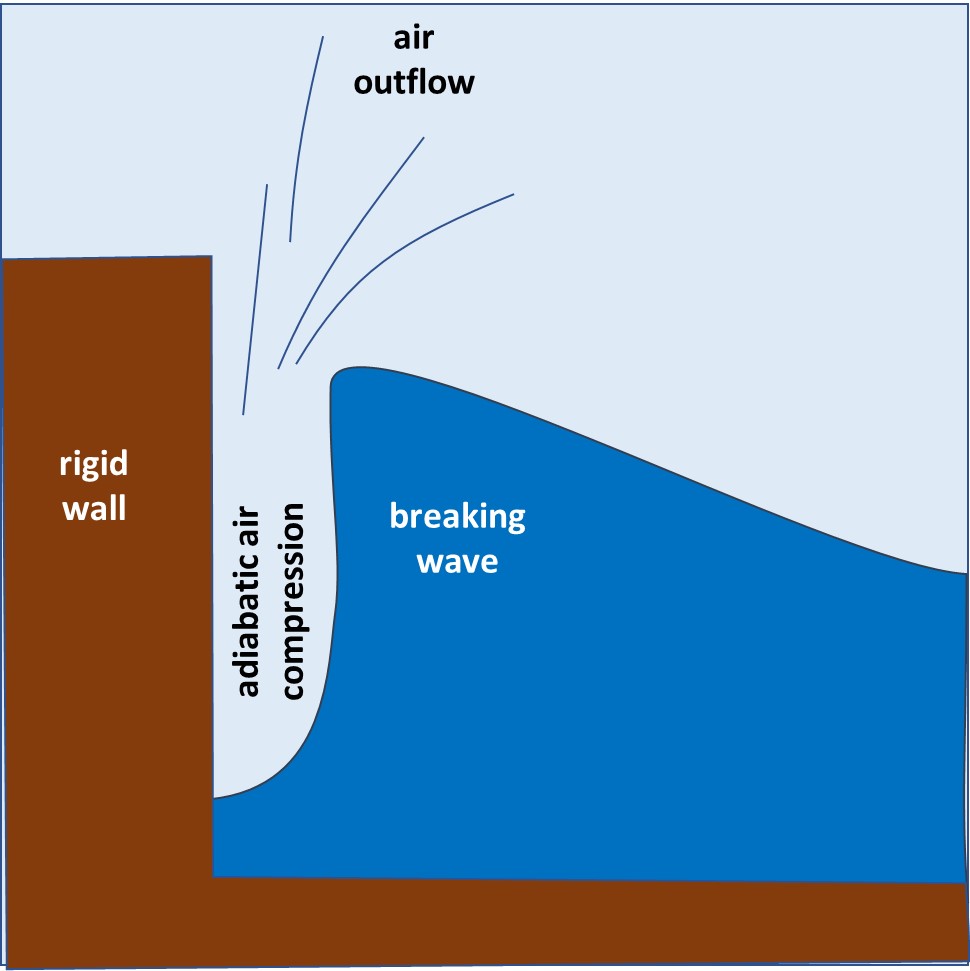
| 20:50, 29 December 2022 | WaveCollisionShock.jpg (file) |  |
63 KB | Dronkers J | Schematic of a wave breaking on a vertical wall. | 1 |
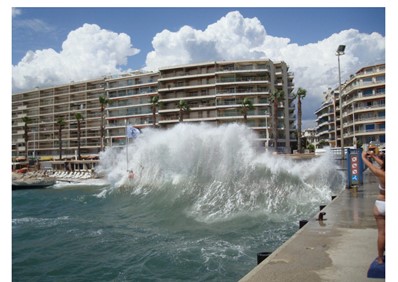
| 18:39, 29 December 2022 | WaveSplash.jpg (file) |  |
37 KB | Dronkers J | Wave splashing on a vertical wall. Photo Niels Mejlhede Jensen. | 1 |
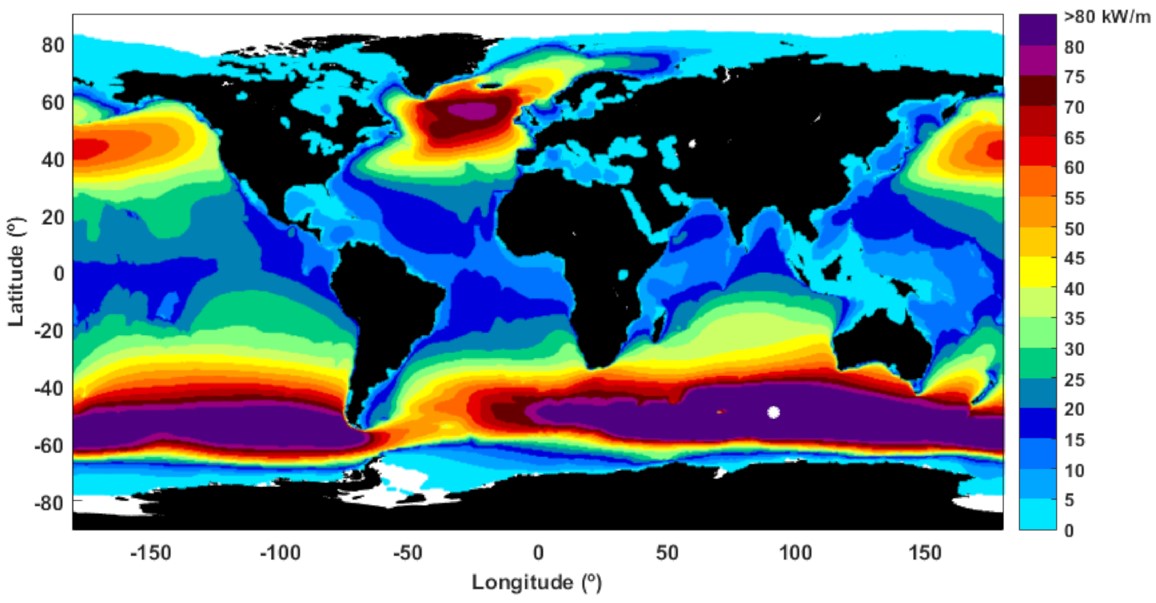
| 23:27, 28 December 2022 | GlobalMeanWavePower.jpg (file) |  |
135 KB | Dronkers J | Mean wave power over the 30-year time interval considered (1989–2018) based on date from ERA5 (i.e.,ECMWF RE-analysis, fifth generation). From: Rusu, L. and Rusu, E. 2021. Evaluation of the Worldwide Wave Energy Distribution Based on ERA5 Data and Al... | 1 |