File list
This special page shows all uploaded files.
| Date | Name | Thumbnail | Size | Description | Versions |
|---|---|---|---|---|---|
| 10:57, 15 September 2016 | GiovanniFig3.jpg (file) |  |
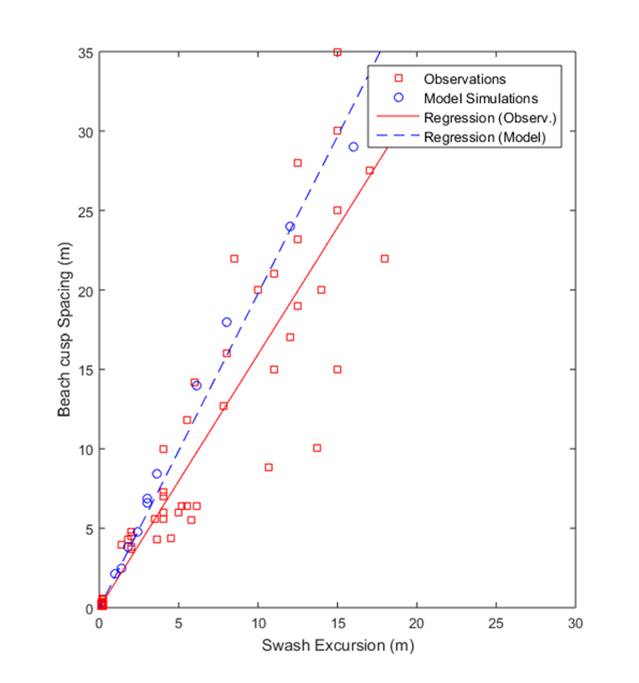
27 KB | Figure 3. Beach cusp spacing as a function of swash excursion for measurements and numerical simulations. | 1 |
| 09:09, 30 May 2017 | BaldockFig3.jpg (file) |  |
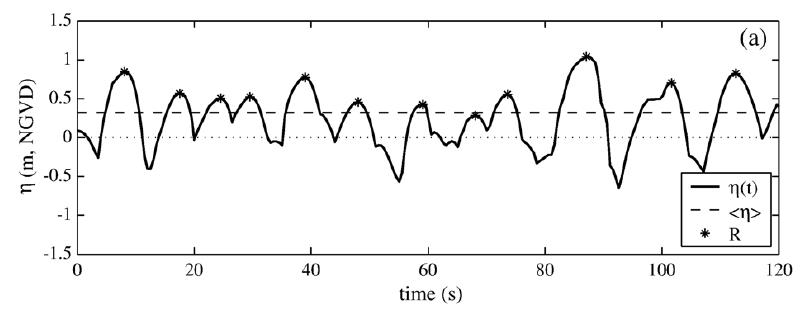
27 KB | Typical pattern of vertical shoreline oscillations (<math>\eta (t)</math>), the mean shoreline position (<math><\eta></math>) and runup maxima(*). From: Stockdon, H. F., Holman, R. A., Howd, P. A. and Sallenger JR, A. H. 2006. Empirical parameterizatio... | 1 |
| 14:37, 22 March 2016 | FrictionEllipse.jpg (file) |  |
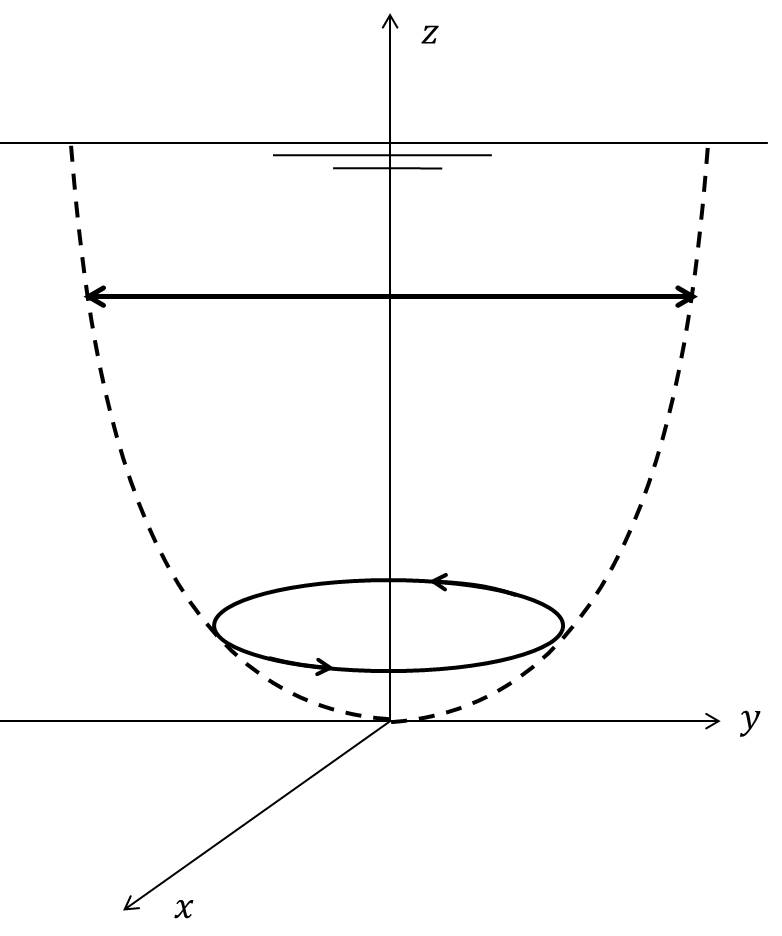
27 KB | Transformation of a rectilinear tidal current near the surface to an elliptic tidal current near the bottom, by the combined influence of Coriolis acceleration and bottom friction. | 1 |
| 17:17, 1 April 2022 | SeicheCiutadellaHarbour2.jpg (file) |  |
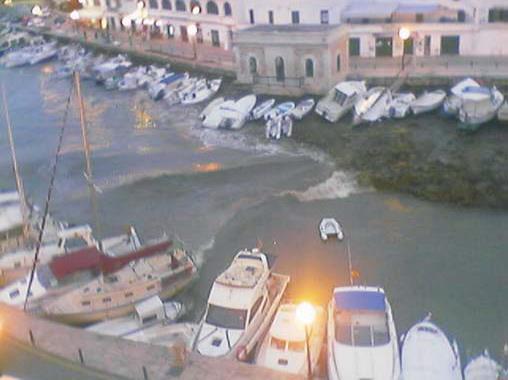
28 KB | Harbour seiche in Ciutadella Inlet (Menorca Island, Spain) generated by a meteo tsunami on 15 June 1996 . Image from Montserrat et al. (2006), Creative Commons Licence. | 1 |
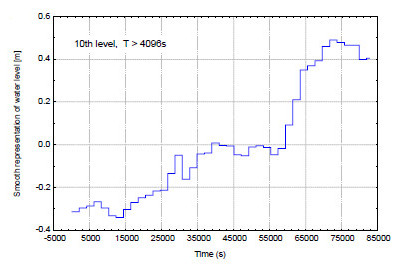
| 17:09, 8 April 2019 | Smooth representation of water level.jpg (file) |  |
28 KB | Smooth representation of water level. | 2 |
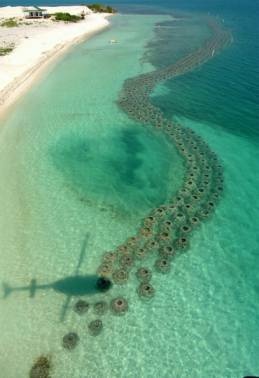
| 11:54, 27 December 2023 | ReefBallBreakwater.jpg (file) |  |
28 KB | Reef ball breakwater. Image credit Ecoshape Building with Nature https://www.ecoshape.org/en/ | 1 |
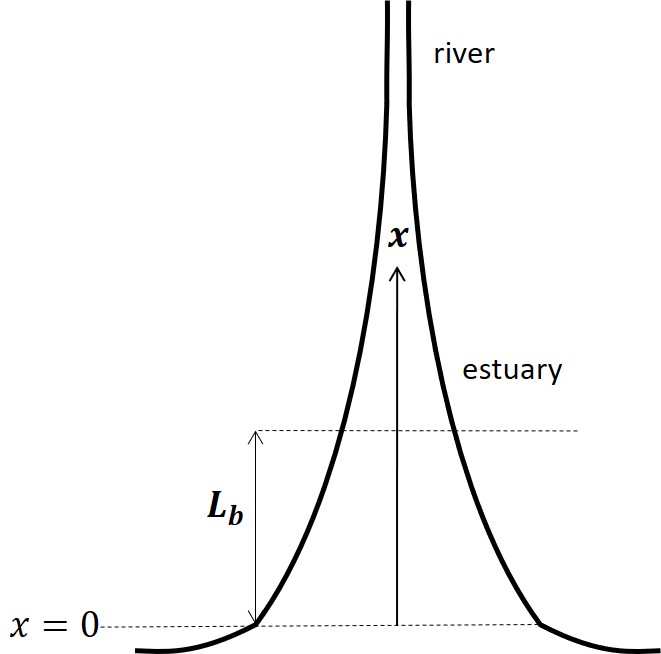
| 21:48, 11 September 2019 | ConvergingTidalChannel.jpg (file) |  |
28 KB | Schematization of a converging tidal channel | 1 |
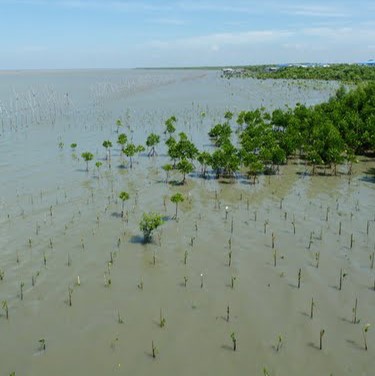
| 19:32, 16 February 2019 | MangroveRestorationThailand.jpg (file) |  |
28 KB | Mangrove reforestation project in Chachoengsao district, Thailand. | 1 |
| 12:27, 12 April 2016 | LateralEstCirc.jpg (file) | 29 KB | Lateral density-driven exchange flow related to cross-channel depth variation. | 1 | |
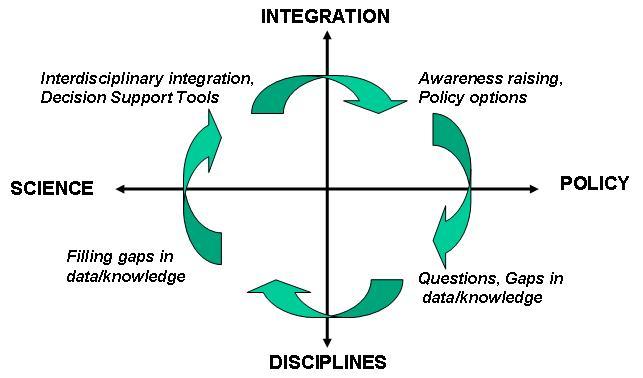
| 23:50, 29 August 2008 | Knowledgecycle.JPG (file) |  |
29 KB | 4 | |
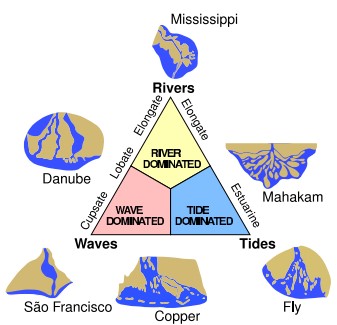
| 18:48, 18 August 2016 | NienhuisFig1.jpg (file) |  |
29 KB | Figure 1: The ternary diagram of delta morphology. | 1 |
| 13:37, 12 November 2016 | LeeuwinU.jpg (file) |  |
30 KB | The poleward Leeuwin current off Western Australia shown by warm sea-surface temperature. | 1 |
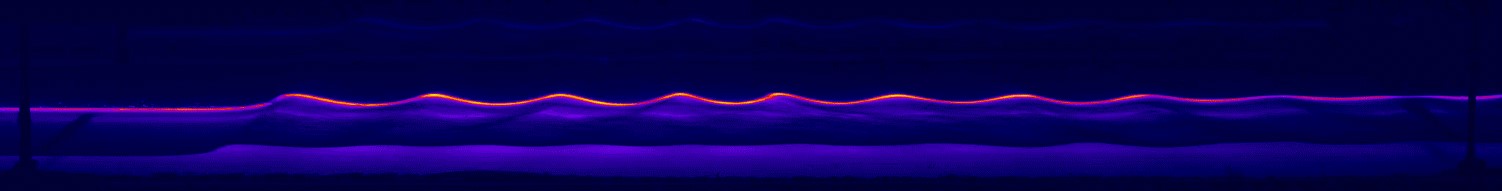
| 23:10, 25 May 2019 | FlumeUndularBoresDye.jpg (file) | 30 KB | Experimental study of tidal-like bore using a laser sheet and fluorescent dye. | 1 | |
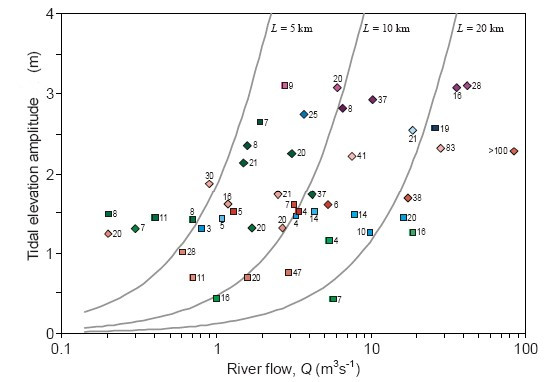
| 23:38, 5 August 2016 | PrandleFig9.jpg (file) |  |
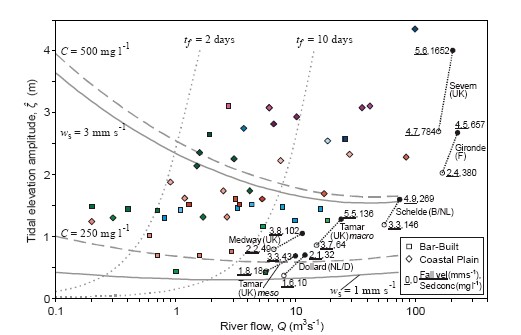
30 KB | Figure 9. Theoretical and observed estuarine lengths L as function of (Q, Z). | 1 |
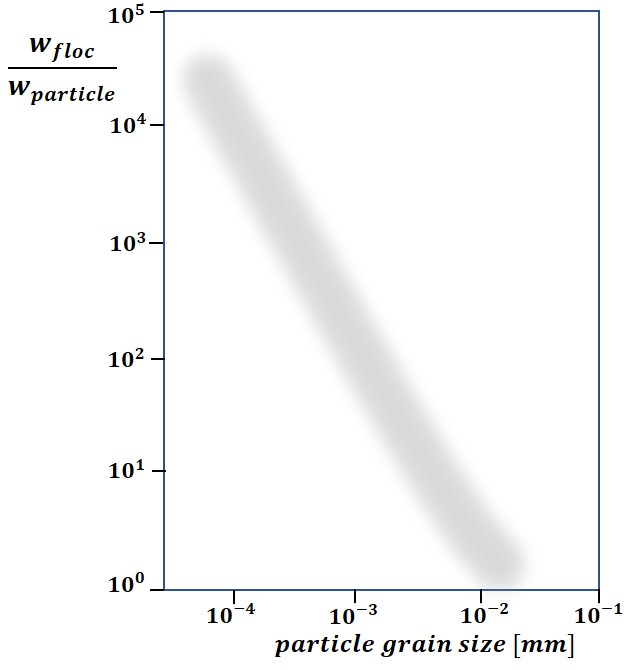
| 00:39, 18 November 2018 | FlocRelativeFallVelocity.jpg (file) |  |
31 KB | The ratio of floc fall velocity and fall velocity of the constituent particles. | 1 |
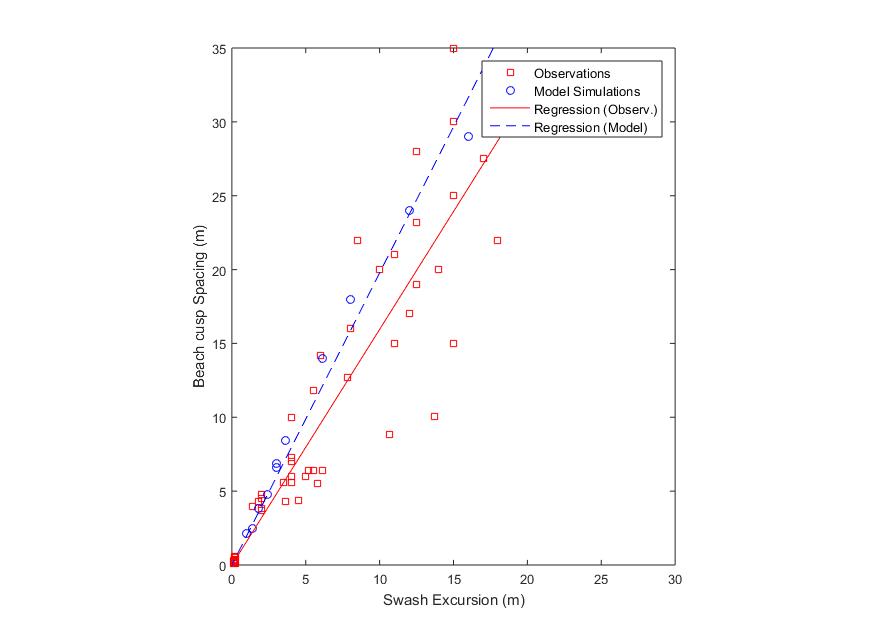
| 16:35, 14 September 2016 | CocoFig3.jpg (file) |  |
31 KB | Figure 3: Beach cusp spacing as a function of swash excursion for measurements (field and laboratory) and numerical simulations. | 1 |
| 21:37, 19 November 2016 | Cpump.jpg (file) |  |
32 KB | Sketch of south-north section through the North Sea. | 2 |
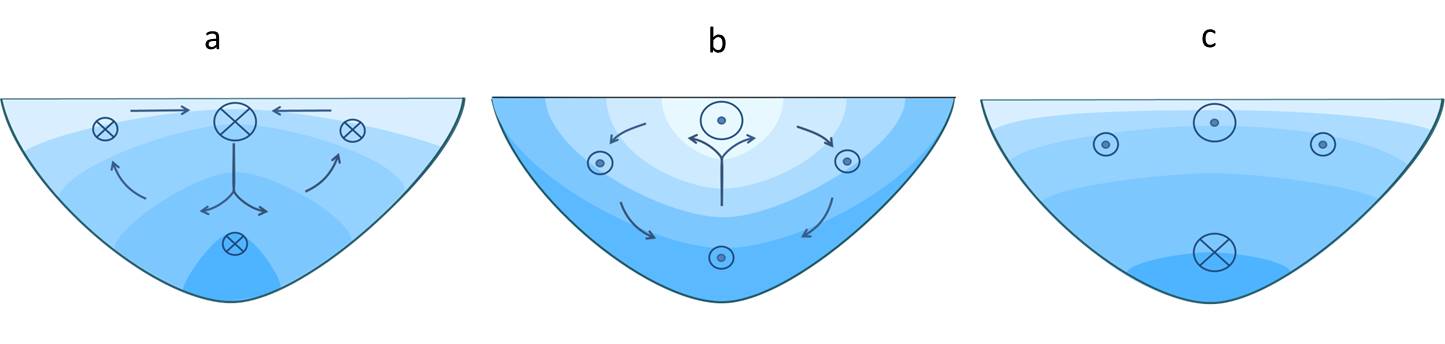
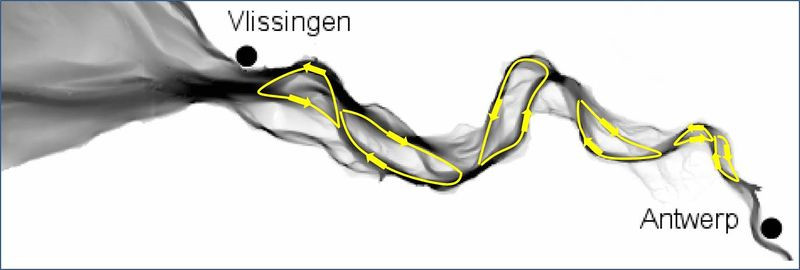
| 18:45, 2 November 2016 | FigHuib9.jpg (file) |  |
32 KB | Residual circulation cells Westerschelde. | 1 |
| 12:16, 4 April 2020 | SaltFreshBalance.jpg (file) |  |
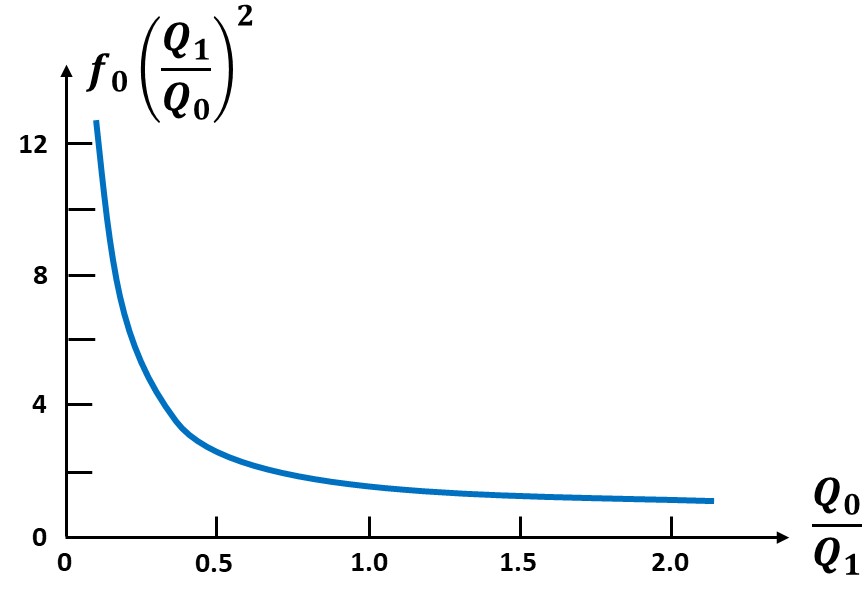
32 KB | A small level difference is sufficient to keep a large fresh water column in balance with a salt water column, because of the small relative density difference. | 1 |
| 13:57, 6 June 2023 | MeanFriction.jpg (file) |  |
32 KB | Contribution of friction to the mean water level gradient in a tidal river. | 1 |
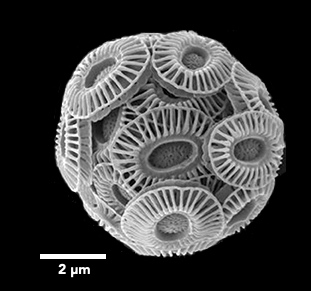
| 16:13, 10 August 2023 | EmilianiaHuxleyi.jpg (file) |  |
33 KB | ''Emiliania huxleyi'' | 1 |
| 18:56, 18 August 2016 | NienhuisFig3.jpg (file) |  |
33 KB | Figure 3: Three deltas with varying wave influence. | 1 |
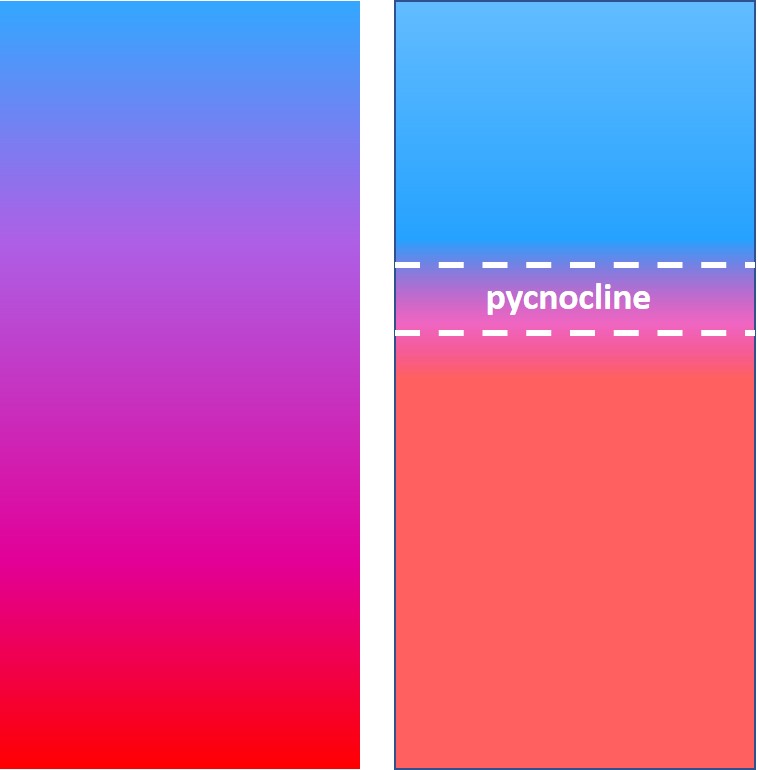
| 16:25, 22 December 2020 | Stratification.jpg (file) |  |
33 KB | Well-mixed (left) and stratified (right) water column. | 1 |
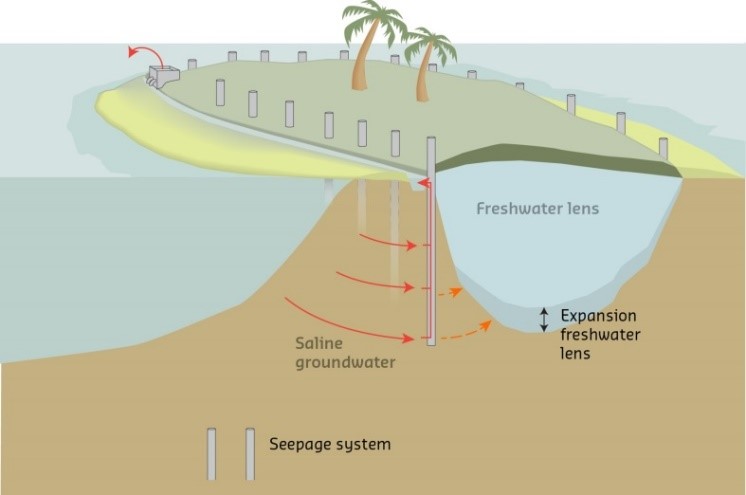
| 12:22, 29 May 2020 | Seepcat1.jpg (file) |  |
33 KB | SeepCat system, consisting of vertical pipes that abstract saline groundwater around the freshwater lens on a small island and pump the saline groundwater to the sea via a horizontal collector pipe. | 1 |
| 10:14, 28 April 2024 | SettlingvelocityBarataria.jpg (file) |  |
34 KB | Settling velocity as function of the velocity shear rate measured in Barataria basin (USA Gulf coast). Redrawn after McDonell et al. (2024). | 1 |
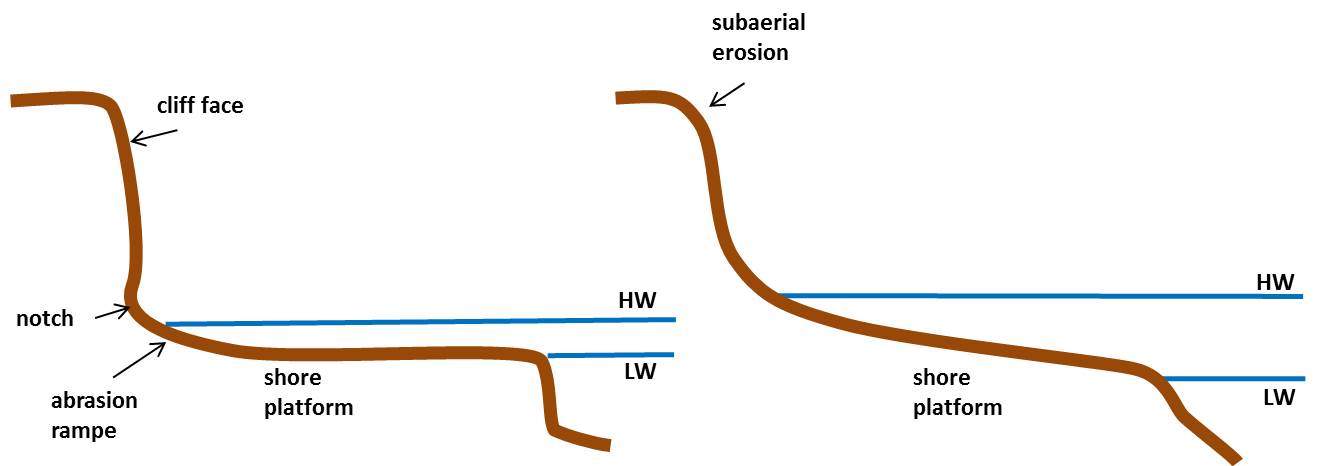
| 12:04, 26 November 2015 | ShorePlatform.jpg (file) |  |
34 KB | Typical rocky shore profiles. | 1 |
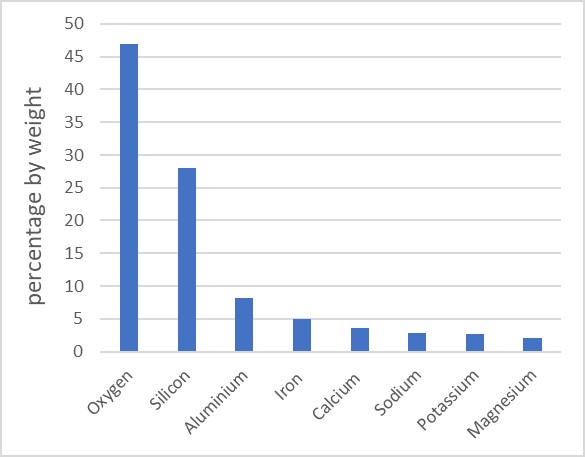
| 12:04, 14 November 2018 | ElementsLithosphere.jpg (file) |  |
34 KB | Composition by weight of chemical elements in the lithosphere. | 1 |
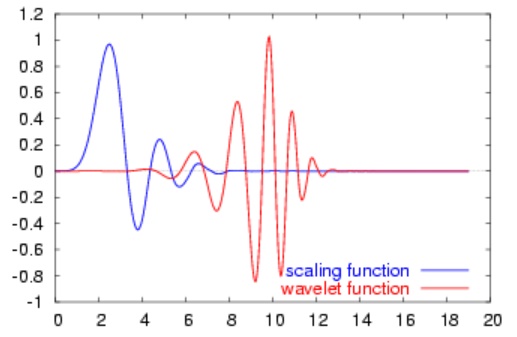
| 21:53, 17 November 2021 | Daubechies20.jpg (file) |  |
34 KB | Daubechies scaling and wavelet functions of order 20. From [https://en.wikipedia.org/wiki/Daubechies_wavelet Wikipedia]. | 1 |
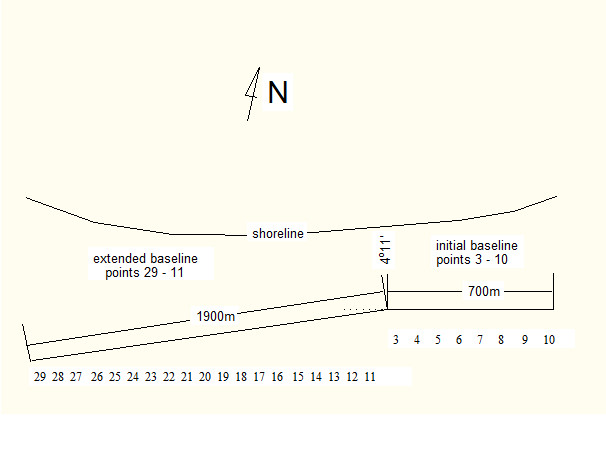
| 16:48, 8 April 2019 | Geodetic base for shoreline measurements.jpg (file) |  |
35 KB | Geodetic base for shoreline measurements. | 1 |
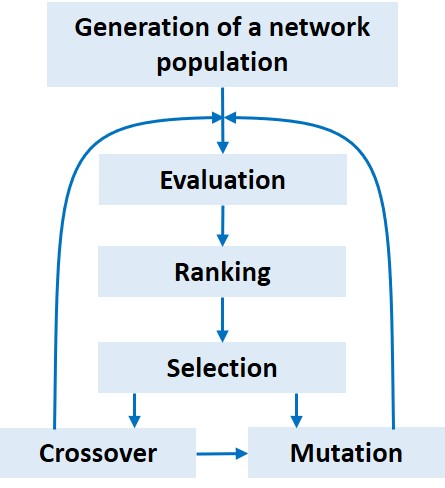
| 11:11, 1 November 2021 | GeneticNetwork.jpg (file) |  |
36 KB | Flowchart of a genetic neural network. | 1 |
| 12:26, 12 April 2016 | CoriolisEstCirc.jpg (file) |  |
36 KB | Influence of earth rotation on estuarine circulation. | 1 |
| 17:28, 15 April 2020 | SalsolaKali.jpg (file) |  |
37 KB | Salsola kali (common saltwort). | 1 |
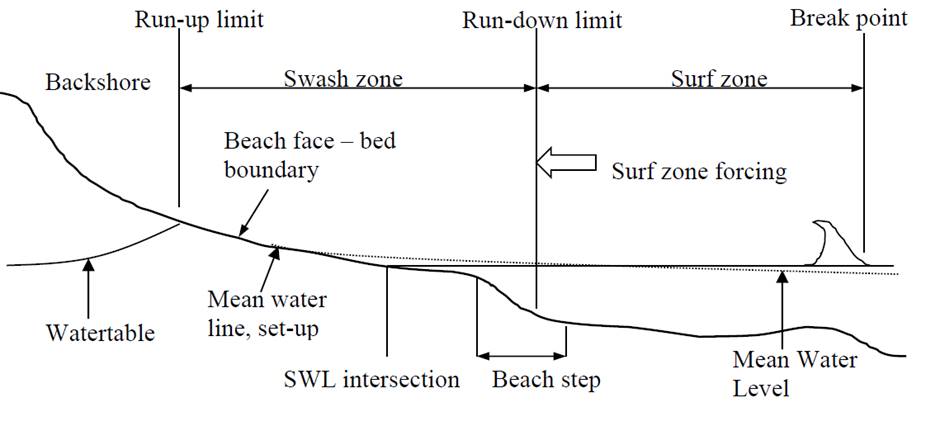
| 09:04, 30 May 2017 | BaldockFig1.jpg (file) |  |
37 KB | Definition sketch for the nearshore littoral zone (swash zone width exaggerated). | 1 |
| 18:39, 29 December 2022 | WaveSplash.jpg (file) |  |
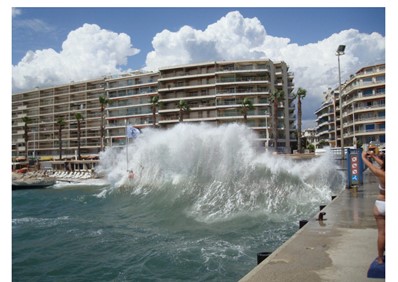
37 KB | Wave splashing on a vertical wall. Photo Niels Mejlhede Jensen. | 1 |
| 12:34, 19 February 2020 | SeepageUpconing.jpg (file) |  |
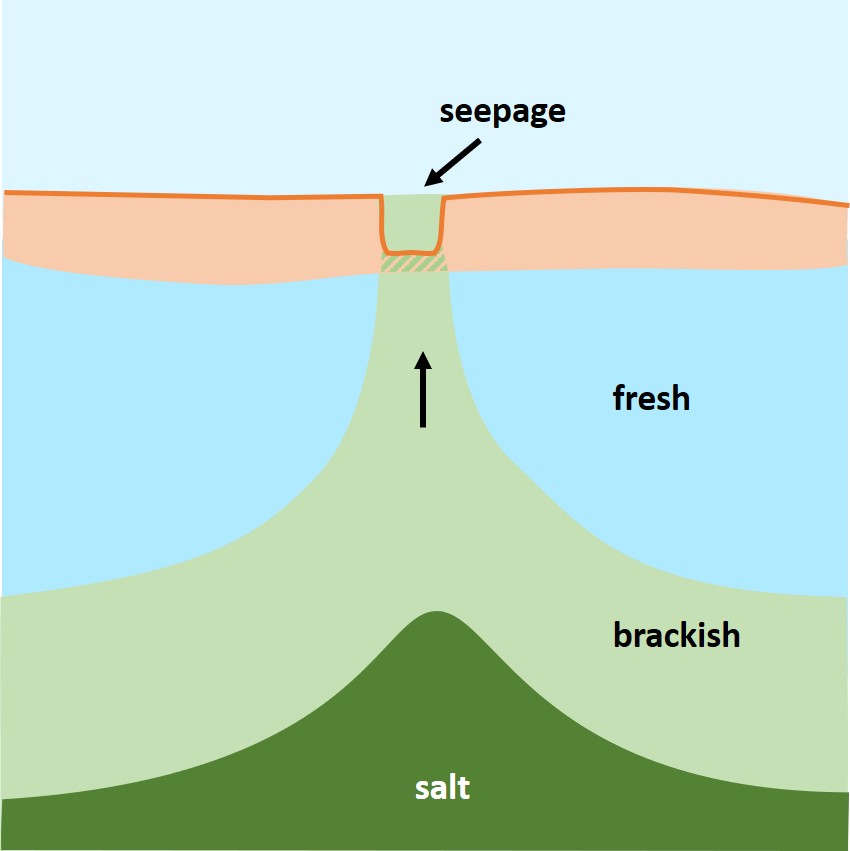
37 KB | Salt water upconing under a seepage hotspot. | 1 |
| 09:17, 30 May 2017 | BaldockFig7.jpg (file) |  |
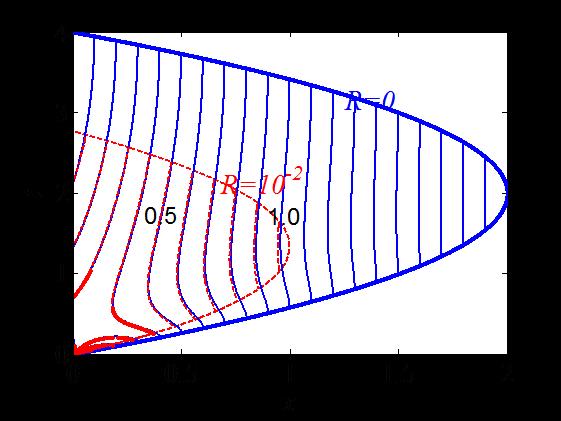
38 KB | Contours of surface elevation with two different resistance coefficients, R=0 (blue lines) and R=0.01 (red dashed lines) in non-dimensional coordinates. From Deng, X., H. Liu, Z. Jiang and T. E. Baldock, 2016. Swash flow properties with bottom resistan... | 1 |
| 11:23, 11 October 2016 | VanRijnTable1.jpg (file) |  |
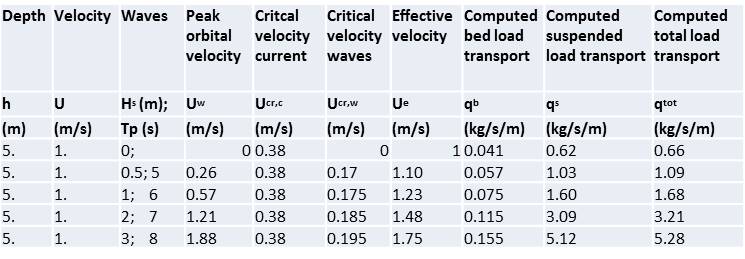
38 KB | Computed sand transport rates. | 1 |
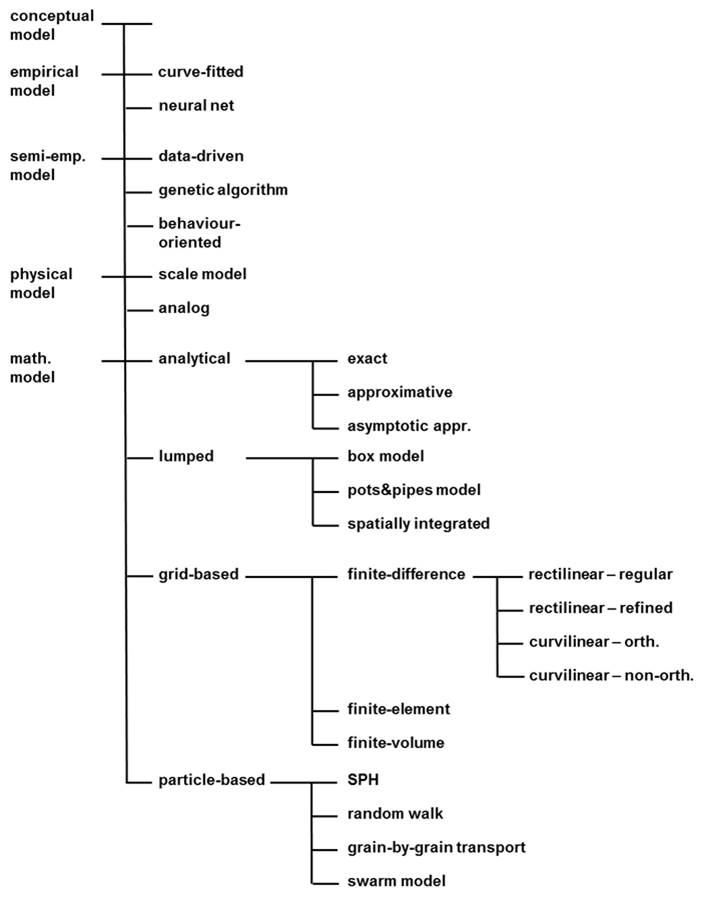
| 22:28, 15 October 2016 | HuibScheme.jpg (file) |  |
38 KB | Model tree. | 2 |
| 18:46, 2 November 2016 | FigHuib10.jpg (file) |  |
38 KB | Morphological evolution in a hypothetical estuary of constant width. | 1 |
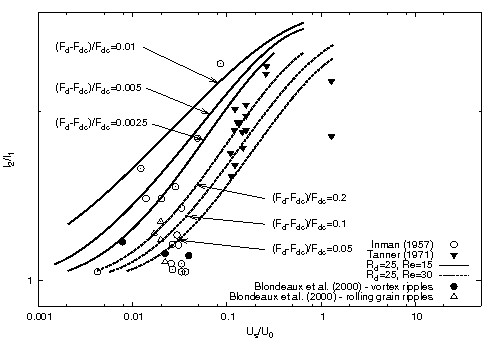
| 11:22, 3 July 2017 | WaveRippleFormationFig11.jpg (file) |  |
39 KB | Theoretical value of the symmetry index plotted versus <math>U_s/U_0</math>. | 1 |
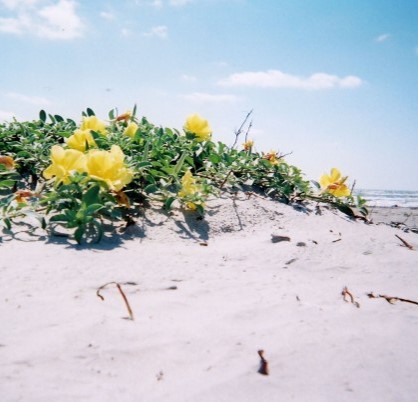
| 21:03, 21 April 2020 | OenotheraDrummondii.jpg (file) |  |
39 KB | Oenothera drummondii (beach evening primrose) Photo credit: Rusty Feagin https://www.newswise.com/articles/media-article/514782 | 1 |
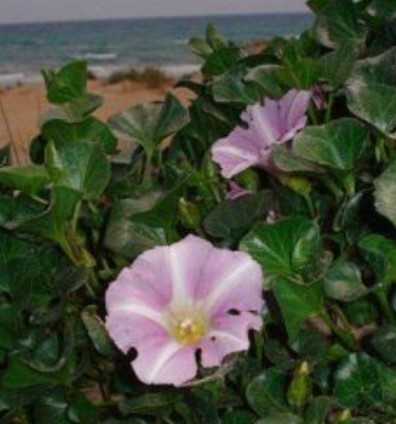
| 22:41, 18 April 2020 | CalystegiaSoldanella.jpg (file) |  |
39 KB | Calystegia soldanella (beach morning glory, shore bindweed) Photo credit: Alfonso La Rosa http://luirig.altervista.org/flora/taxa/index2.php?scientific-name=calystegia+soldanella | 1 |
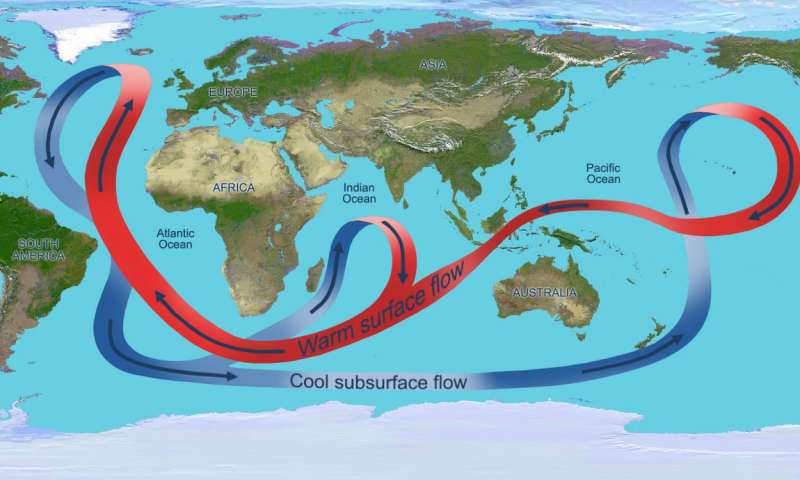
| 11:56, 21 April 2018 | ConveyorBelt NASA.jpg (file) |  |
39 KB | Simplified picture of the conveyor belt. Credit: NASA. | 1 |
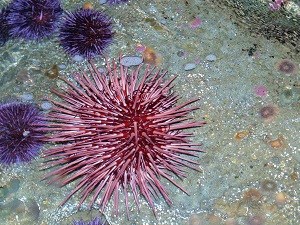
| 21:01, 16 December 2020 | SeaUrchin.jpg (file) |  |
39 KB | Sea urchin. Photo credit US National Park Service. | 1 |
| 16:34, 14 September 2016 | Fig2.jpg (file) |  |
40 KB | Figure 2: Snapshots of flow circulation over beach cusps. | 1 |
| 10:56, 15 September 2016 | GiovanniFig2.jpg (file) |  |
40 KB | Figure 2. Flow circulation over beach cusps. | 1 |
| 23:43, 5 August 2016 | PrandleFig13.jpg (file) |  |
40 KB | Figure 13. ‘Equilibrium’ values of sediment concentrations and fall velocities. | 1 |
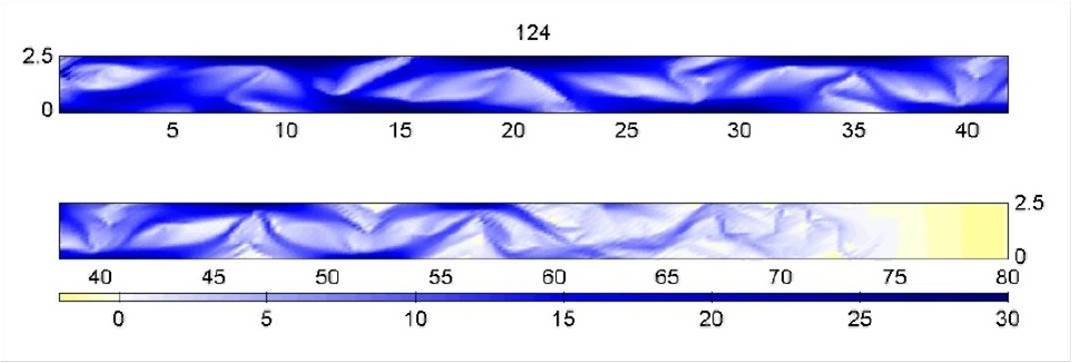
| 14:52, 16 August 2019 | DispersiveUndularBores.jpg (file) |  |
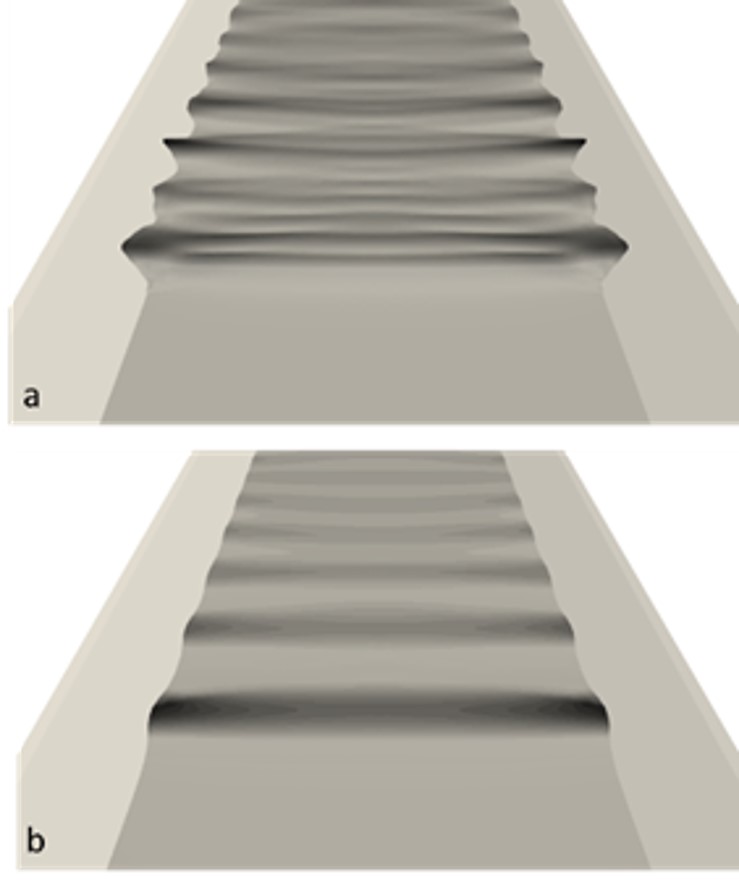
41 KB | Numerical simulations of the two undular tidal bore regimes. Panel a: Dispersive regime, F1=1.20. Panel b: Dispersive-like regime, F1=1.05. | 1 |
| 20:36, 16 October 2023 | AiryFunction.jpg (file) |  |
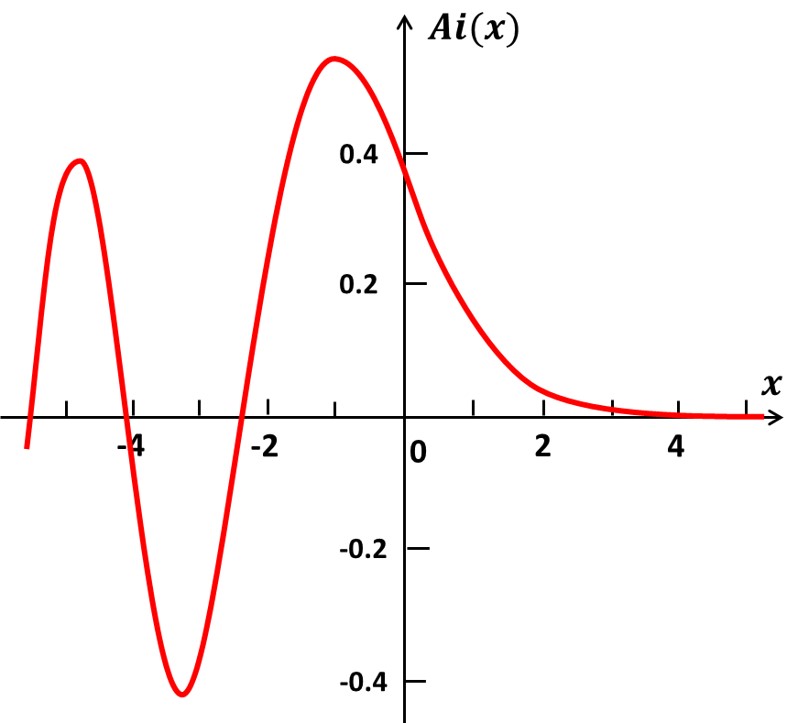
41 KB | The Airy function. | 1 |
| 15:48, 28 April 2018 | RhineConcNitratePhosphate.jpg (file) |  |
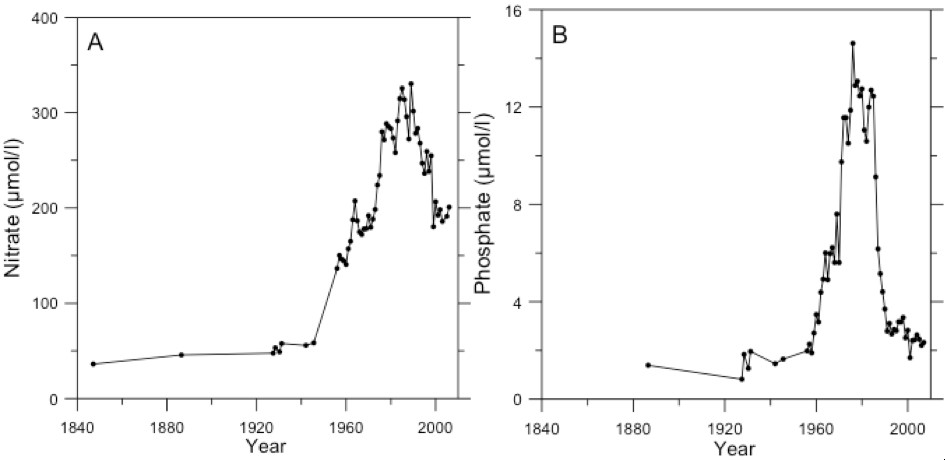
41 KB | Historic development of nitrate (a) and phosphate (b) concentrations in the Rhine. | 1 |