File list
This special page shows all uploaded files.
| Date | Name | Thumbnail | Size | Description | Versions |
|---|---|---|---|---|---|
| 10:47, 3 July 2017 | WaveRippleFormationFig4.jpg (file) |  |
47 KB | Visualization of the sediments picked-up from the bed and carried into suspension by the vortices shed at the crests of large amplitudes ripples in an oscillatory flow (courtesy of Dr. Megale). | 1 |
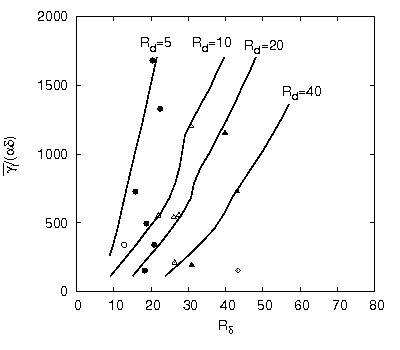
| 10:46, 3 July 2017 | WaveRippleFormationFig3.jpg (file) |  |
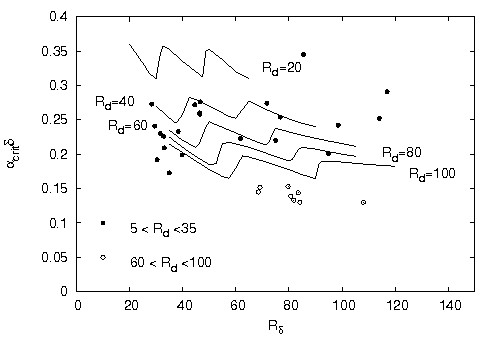
25 KB | Critical value <math>\alpha_{crit}</math> of <math>\alpha</math> plotted versus the flow Reynolds number <math>R_\delta</math> for <math>s=2.65, \mu=0.15, n=0.4</math> and different values of <math>R_d=R_p\sqrt{\psi_d}</math>. | 1 |
| 10:44, 3 July 2017 | WaveRippleFormationFig2.jpg (file) |  |
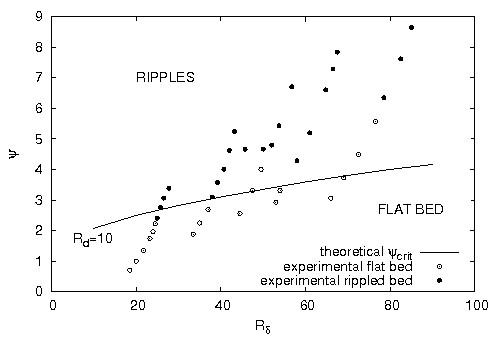
21 KB | Region of existence of ripples and flat beds (adapted from Blondeaux 1990). | 1 |
| 11:27, 3 July 2017 | WaveRippleFormationFig14.jpg (file) |  |
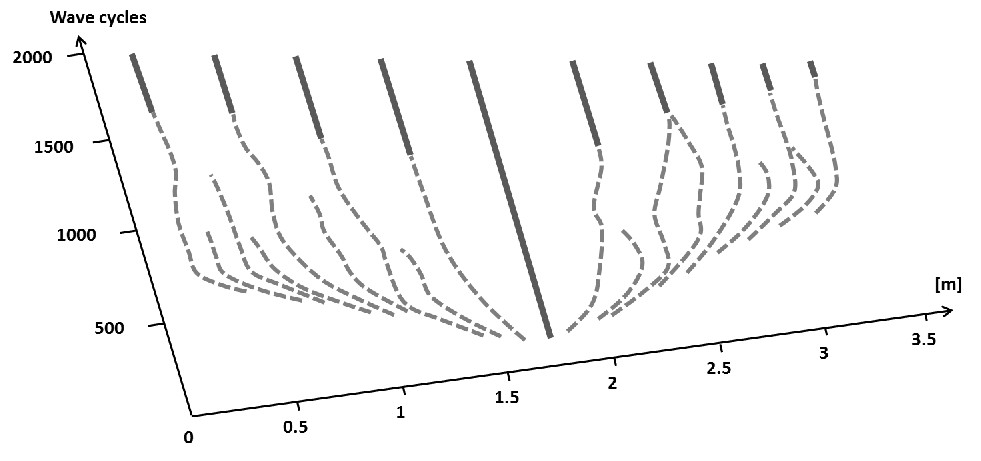
47 KB | Time evolution of the crests of the ripples generated by the growth of a sandy Gaussian hump which interacts with an oscillatory flow (adapted from Marieu et al. 2008). | 1 |
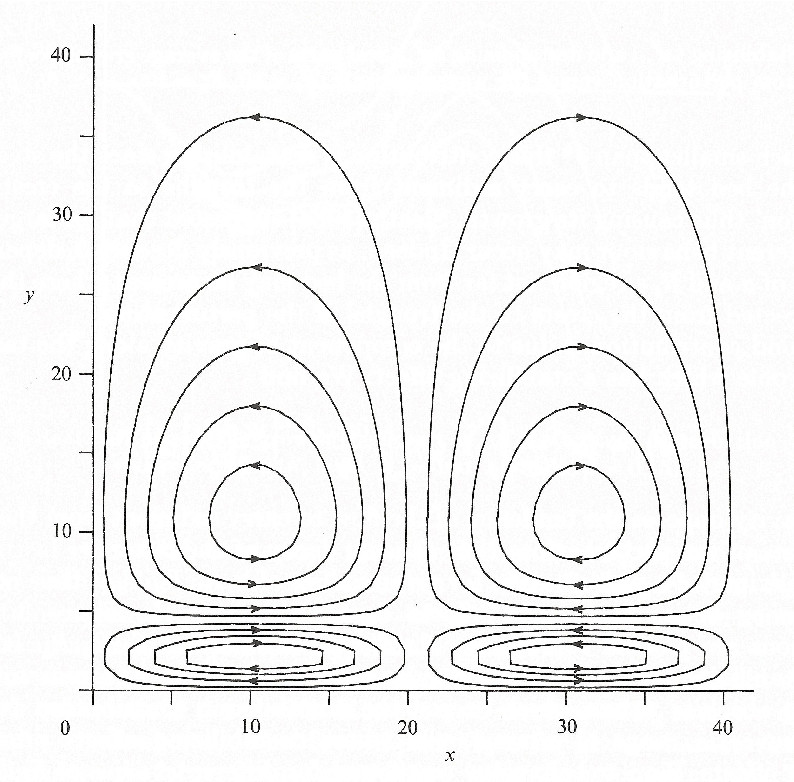
| 11:25, 3 July 2017 | WaveRippleFormationFig13.jpg (file) |  |
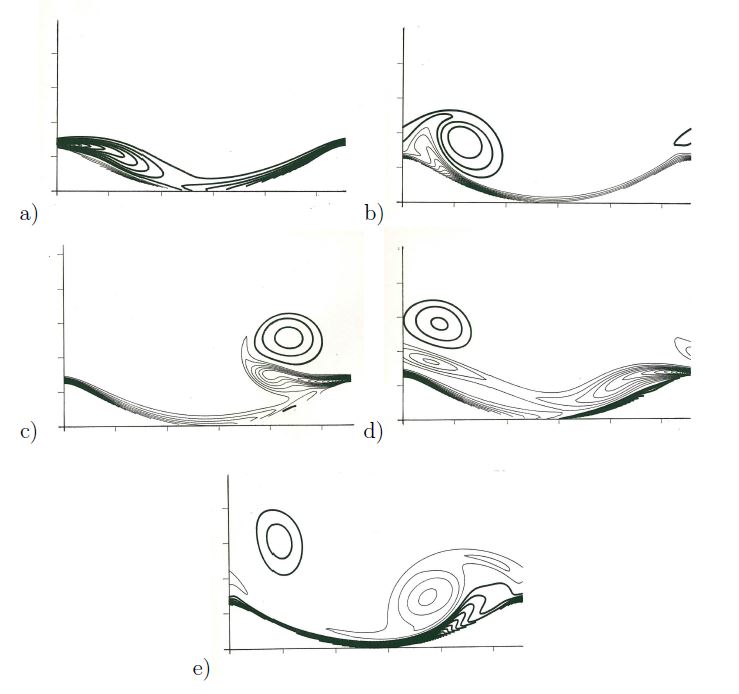
47 KB | Vorticity contours of the oscillatory flow over a wavy wall at different wave phases. | 1 |
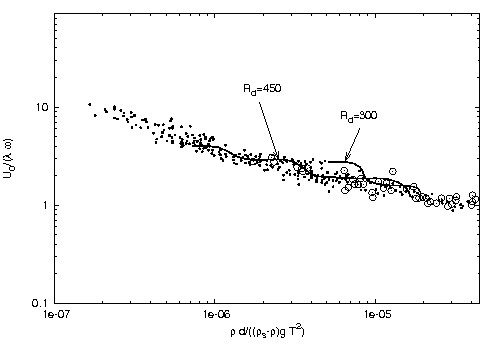
| 11:23, 3 July 2017 | WaveRippleFormationFig12.jpg (file) |  |
20 KB | Ratio between the amplitude <math>U_0/\omega</math> of the fluid displacement oscillations and the wavelength <math>\lambda</math> of the ripples plotted versus the parameter <math>\rho d/(\rho_s-\rho) g T^2</math>. | 1 |
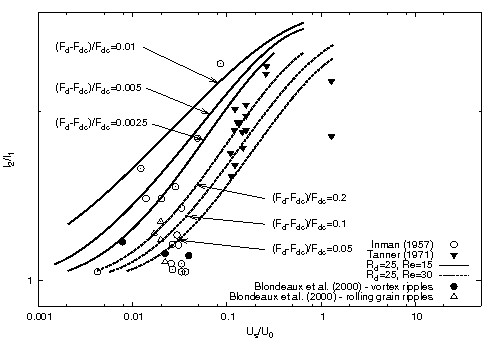
| 11:22, 3 July 2017 | WaveRippleFormationFig11.jpg (file) |  |
39 KB | Theoretical value of the symmetry index plotted versus <math>U_s/U_0</math>. | 1 |
| 11:21, 3 July 2017 | WaveRippleFormationFig10.jpg (file) |  |
20 KB | Theoretical and experimental values of the dimensioless migration speed of ripples plotted versus <math>R_\delta</math>. | 1 |
| 10:43, 3 July 2017 | WaveRippleFormationFig1.jpg (file) |  |
125 KB | Steady streaming generated by an oscillatory flow over a wavy wall (adapted from Blondeaux 1990). | 1 |
| 10:40, 3 July 2017 | WaveRippleFormationFig0.jpg (file) |  |
678 KB | Ripples observed at Sea Rim State Park, along the coast of east Texas close to the border with Louisiana (courtesy by Zoltan Sylvester). | 1 |
| 17:08, 29 March 2021 | WaveRefraction.jpg (file) |  |
263 KB | Refraction of oblique incident waves when entering shallow coastal. Bending of the wave crests to become shore parallel. Image Google Earth. | 1 |
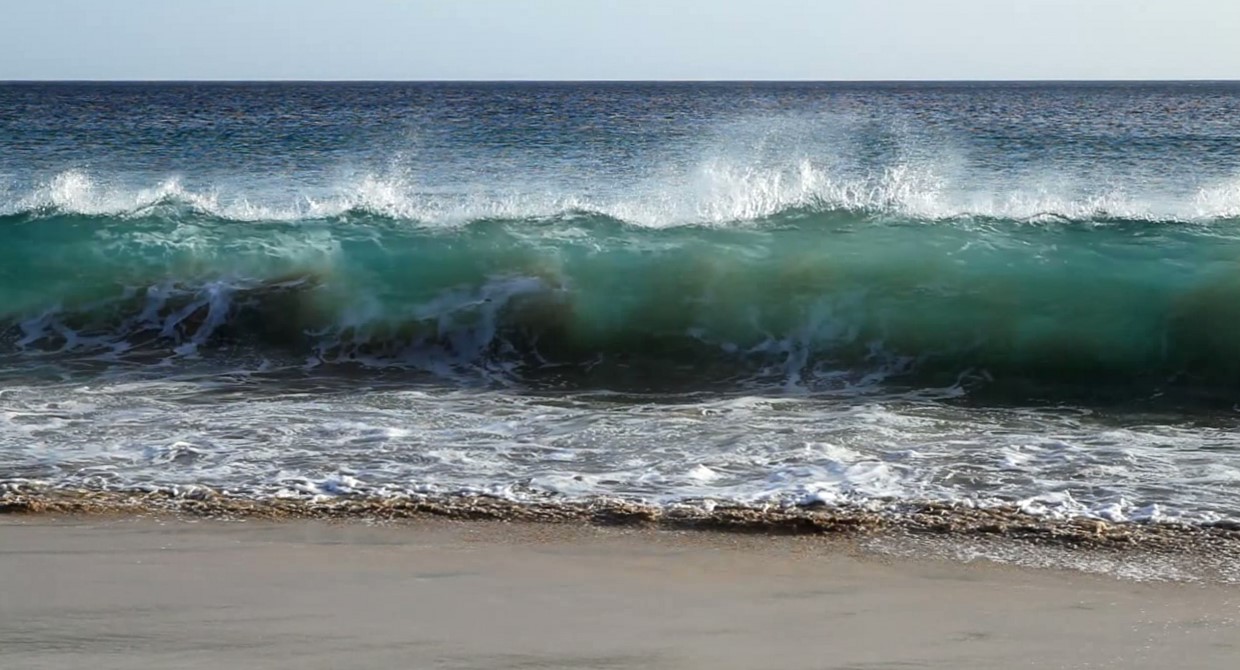
| 19:09, 27 February 2024 | WavePlungeLipari.jpg (file) |  |
175 KB | Plunging wave, still from the video by Vincentz 2013 https://zenodo.org/records/8070591 under licence CC Y-SA (attribution and share-alike). | 1 |
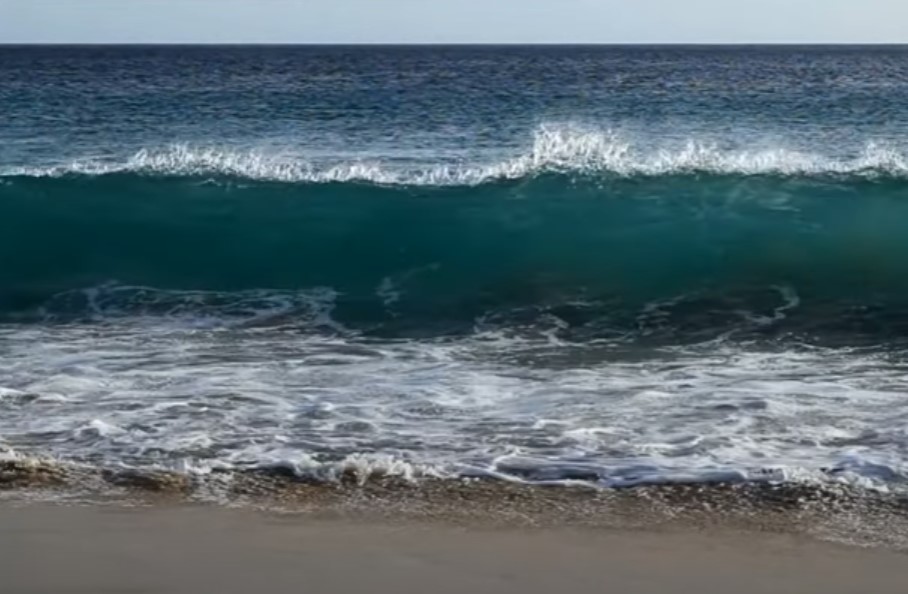
| 11:56, 23 February 2024 | WavePlunge.jpg (file) |  |
94 KB | Plunging wave, still from the video by Vincentz 2013 https://zenodo.org/records/8070591 under licence CC Y-SA (attribution and share-alike). | 1 |
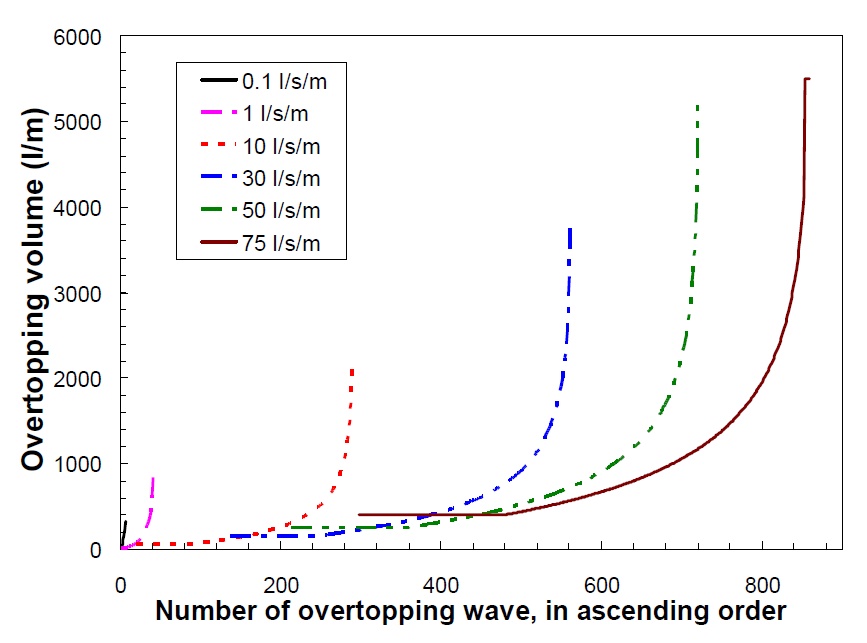
| 12:34, 17 September 2020 | WaveOvertoppingVolume.jpg (file) |  |
98 KB | Distribution of overtopping volumes of waves for sea dikes and various mean overtopping discharges, as simulated by the Wave Overtopping Simulator. | 1 |
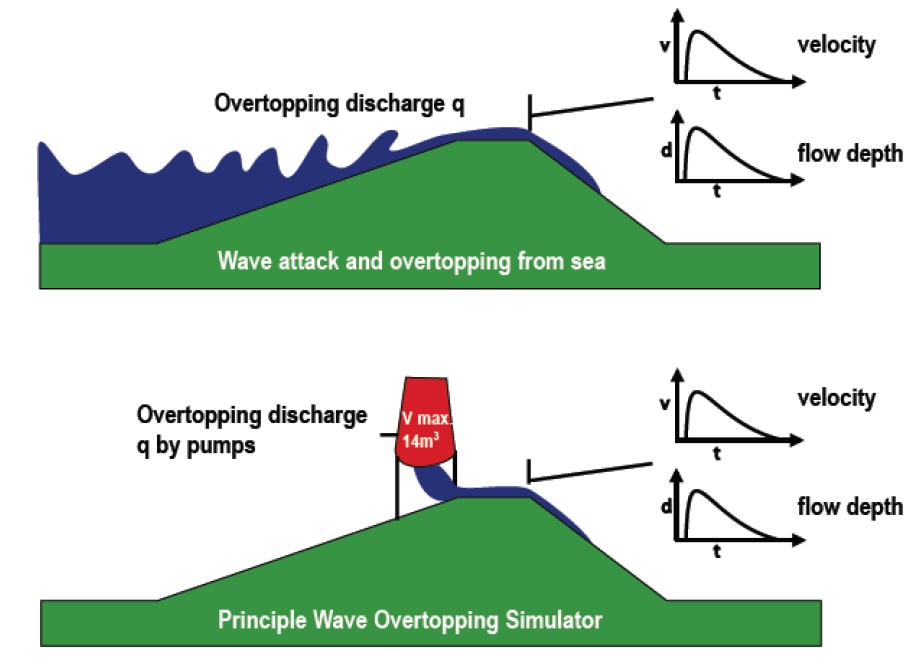
| 12:32, 17 September 2020 | WaveOvertoppingSimulator.jpg (file) |  |
85 KB | Principle of the Wave Overtopping Simulator. | 1 |
| 12:33, 17 September 2020 | WaveOvertoppingExperiment.jpg (file) |  |
96 KB | Release of a wave from the simulator. | 1 |
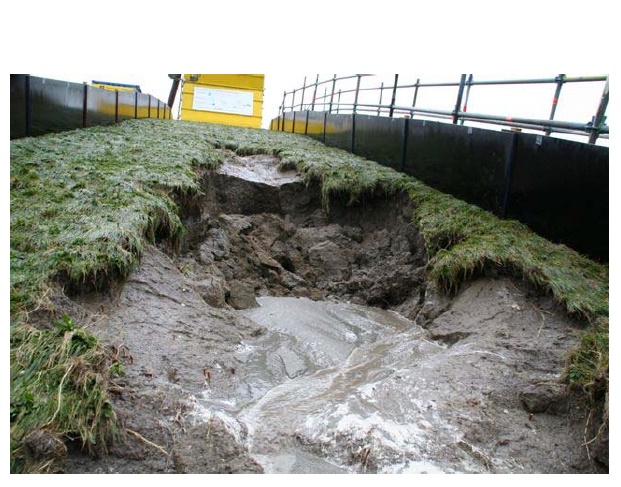
| 12:35, 17 September 2020 | WaveOvertoppingDamage1.jpg (file) |  |
139 KB | Example of damage by the wave overtopping simulation. | 1 |
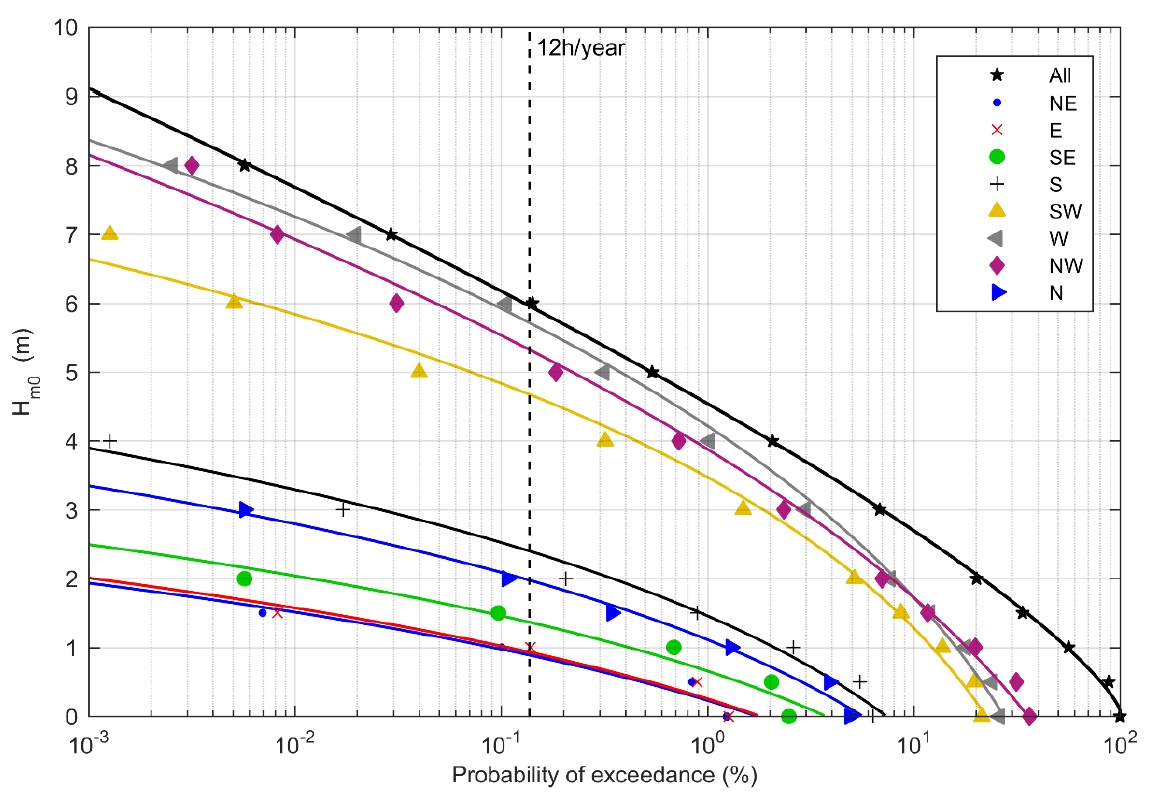
| 18:56, 14 December 2019 | WaveHeightExceedanceDistribution.jpg (file) |  |
261 KB | Wave height exceedance distribution for various wave directions. | 1 |
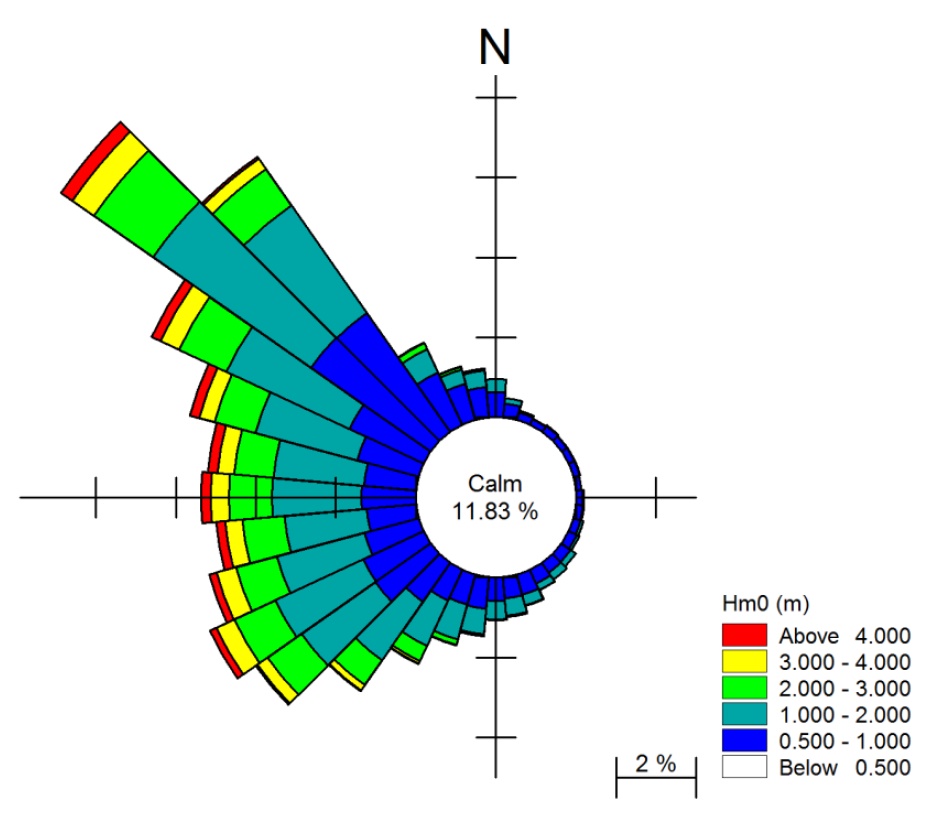
| 18:58, 14 December 2019 | WaveHeightDirectionalSpreading.jpg (file) |  |
114 KB | Wave height directional distribution, a so-called wave rose. | 1 |
| 21:15, 20 January 2017 | WaveHeight.jpg (file) |  |
512 KB | Significant wave height values of incoming (triangles) and outgoing (dots) infragravity waves for different frequency bands. | 1 |
| 21:13, 20 January 2017 | WaveGroups.jpg (file) |  |
218 KB | Merging of two wave trains of slightly different wave lengths. | 1 |
| 21:05, 24 October 2020 | WaveFieldOffBrest.jpg (file) |  |
195 KB | Wave field measured by HF radar off the coast of Brest. | 1 |
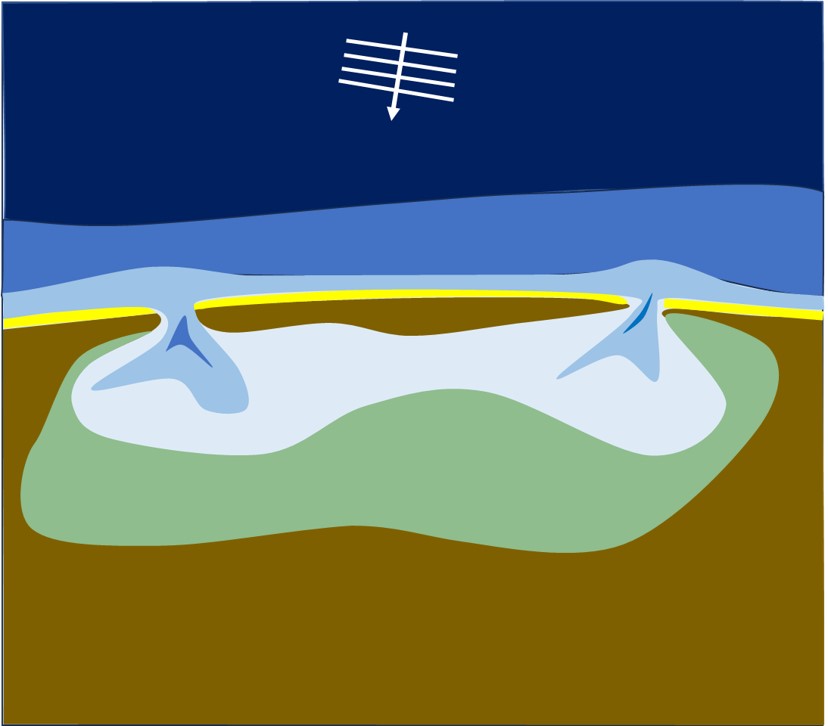
| 19:29, 18 February 2023 | WaveEstuary.jpg (file) |  |
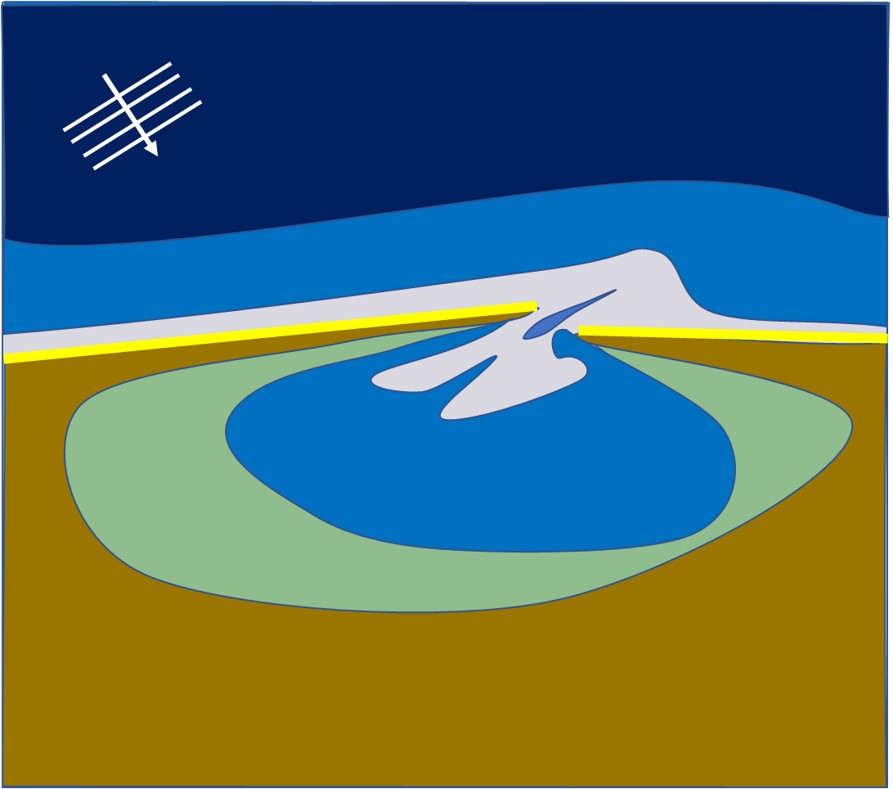
58 KB | Schematic plan view of a wave-dominated estuary (oblique wave incidence). | 1 |
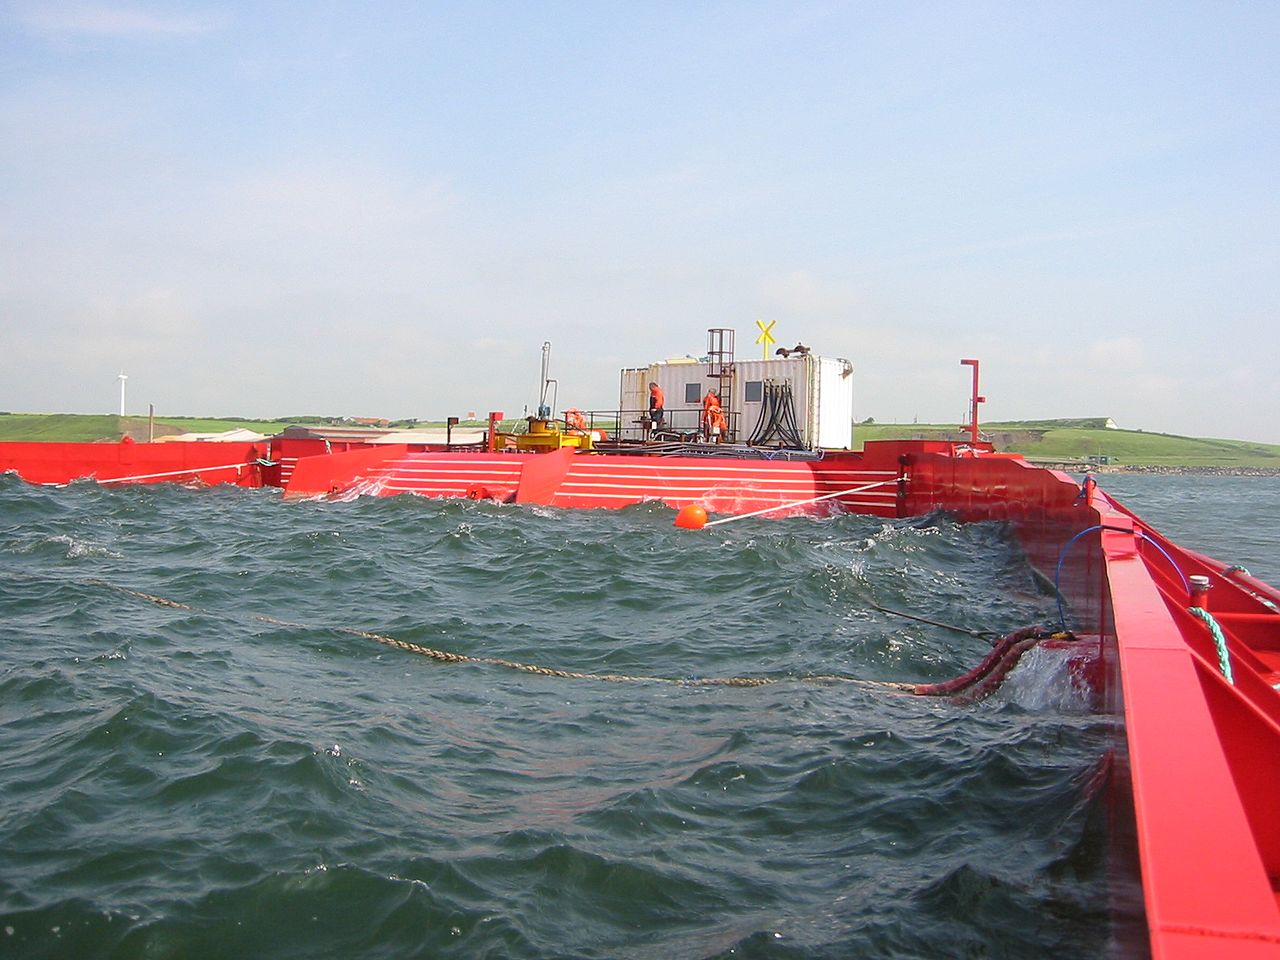
| 22:05, 8 January 2021 | WaveDragon.jpg (file) |  |
170 KB | Wave Dragon overtopping wave energy converter. | 1 |
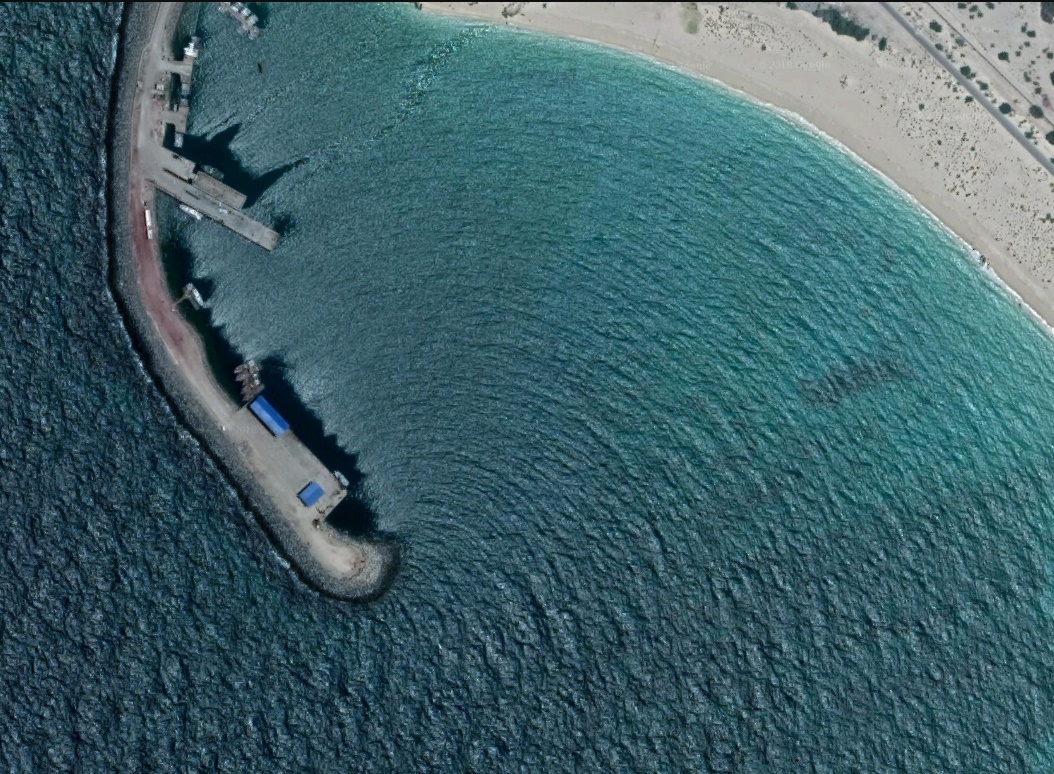
| 16:47, 29 March 2021 | WaveDiffraction.jpg (file) |  |
442 KB | Wave diffraction around the tip of a breakwater. Image Google Earth. | 1 |
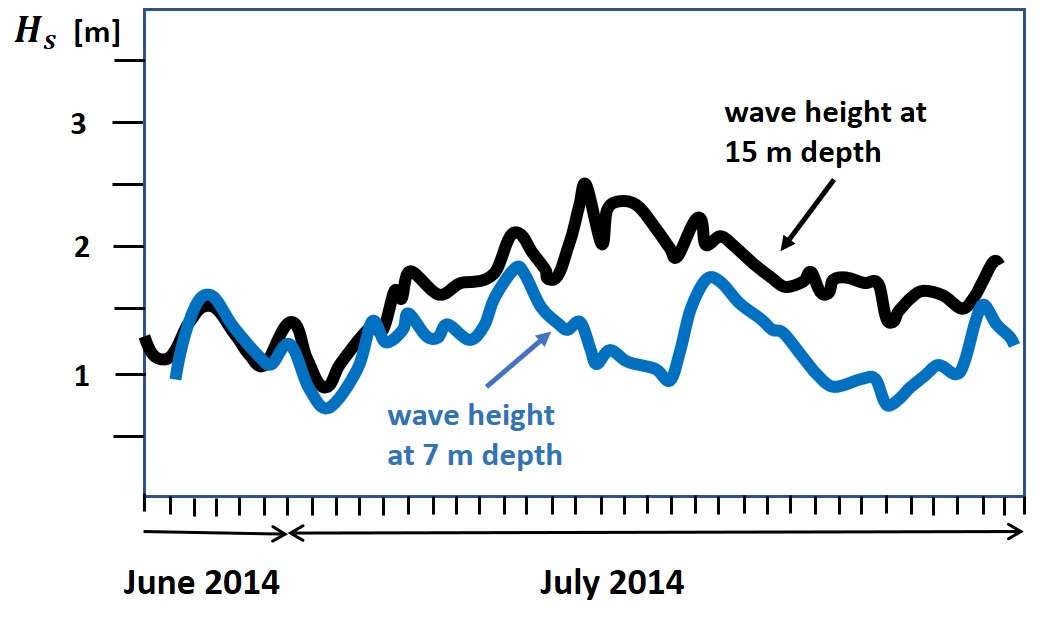
| 11:51, 1 May 2021 | WaveDampingKeralaCoast.jpg (file) |  |
89 KB | Records of significant wave height <math>H_s</math> off the Kerala coast (India). Black line: wave height at 15 m depth, seaward of a mud bank. Blue line: wave height at the mud bank. | 1 |
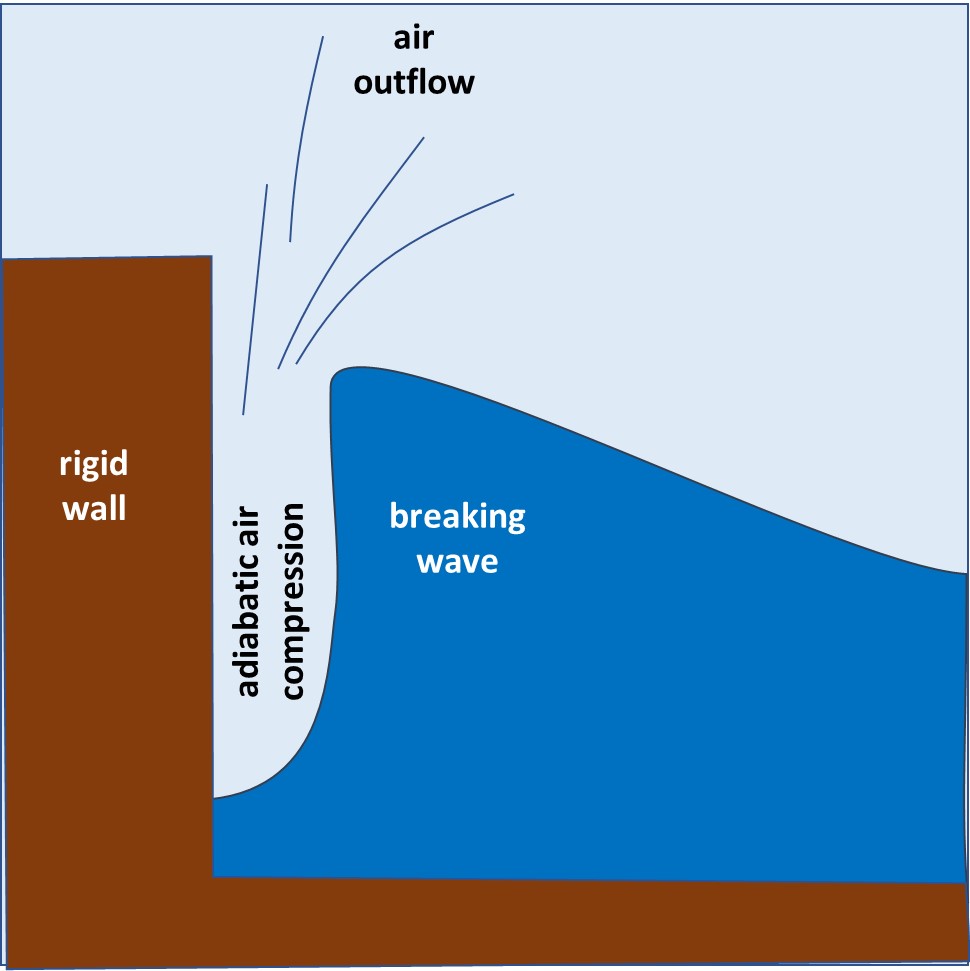
| 20:50, 29 December 2022 | WaveCollisionShock.jpg (file) |  |
63 KB | Schematic of a wave breaking on a vertical wall. | 1 |
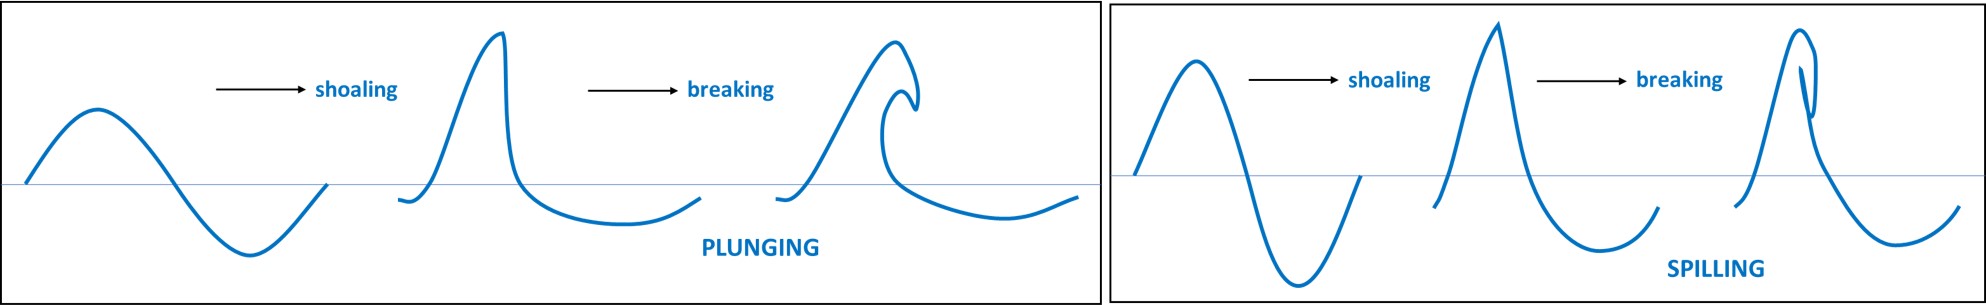
| 12:12, 12 April 2022 | WaveBreakingTypes.jpg (file) | 68 KB | Schematic of wave evolution towards breaking, for swell waves (left panel) and sea waves (right panel). | 1 | |
| 17:05, 15 January 2024 | WaveBarrierIslandLagoon.jpg (file) |  |
45 KB | Schematic plan view of a wave-dominated estuary/lagoon with barrier island (close-to-normal wave incidence). | 1 |
| 17:46, 23 March 2021 | WaveAsymmetry.jpg (file) |  |
87 KB | Onshore-offshore asymmetry of the wave orbital velocity and acceleration in the shoaling zone. | 1 |
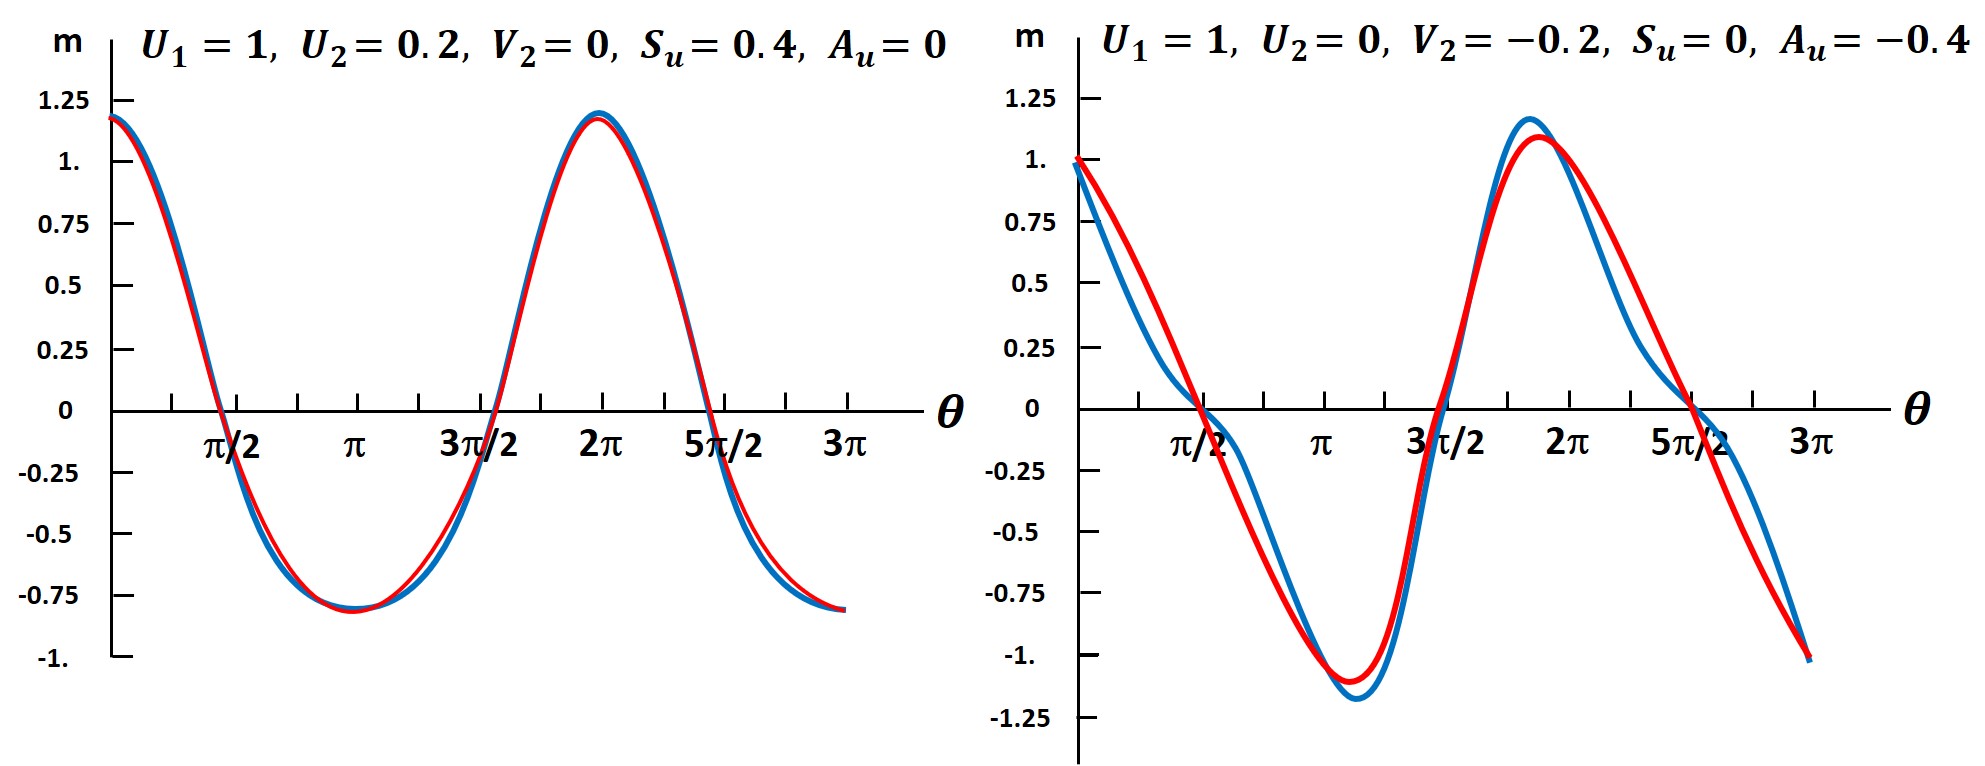
| 19:07, 28 June 2022 | WaveAsymmetries.jpg (file) |  |
149 KB | Wave orbital velocity as function of the phase <math>\theta</math>. Left panel: Velocity skewness. Right panel: Acceleration skewness. Blue lines: Eq. (A1). Red lines: Eq. (A5). | 1 |
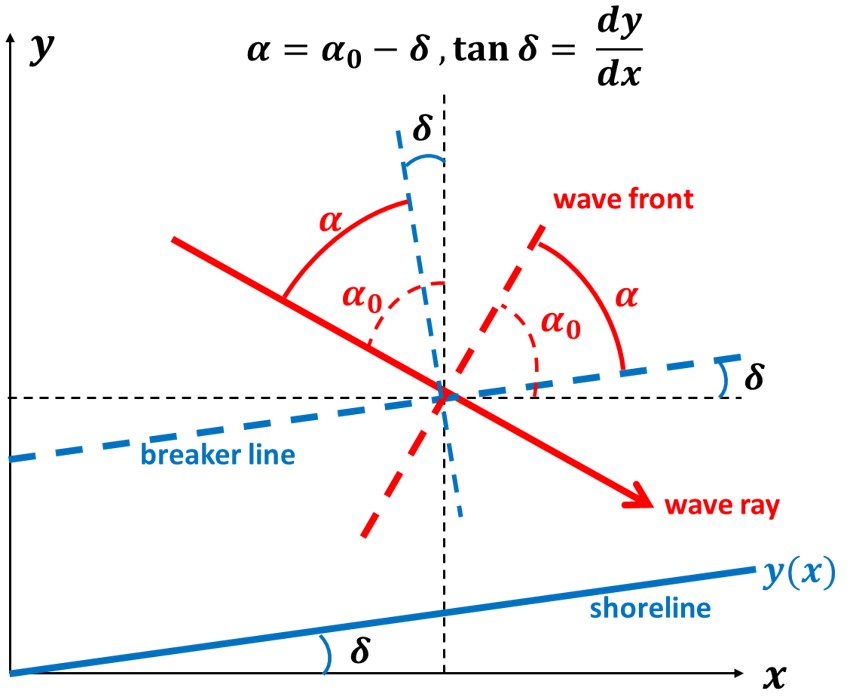
| 23:11, 17 November 2023 | WaveAngles.jpg (file) |  |
70 KB | Wave incidence angles in a 1-line model where the breaker line is parallel to the shoreline. | 1 |
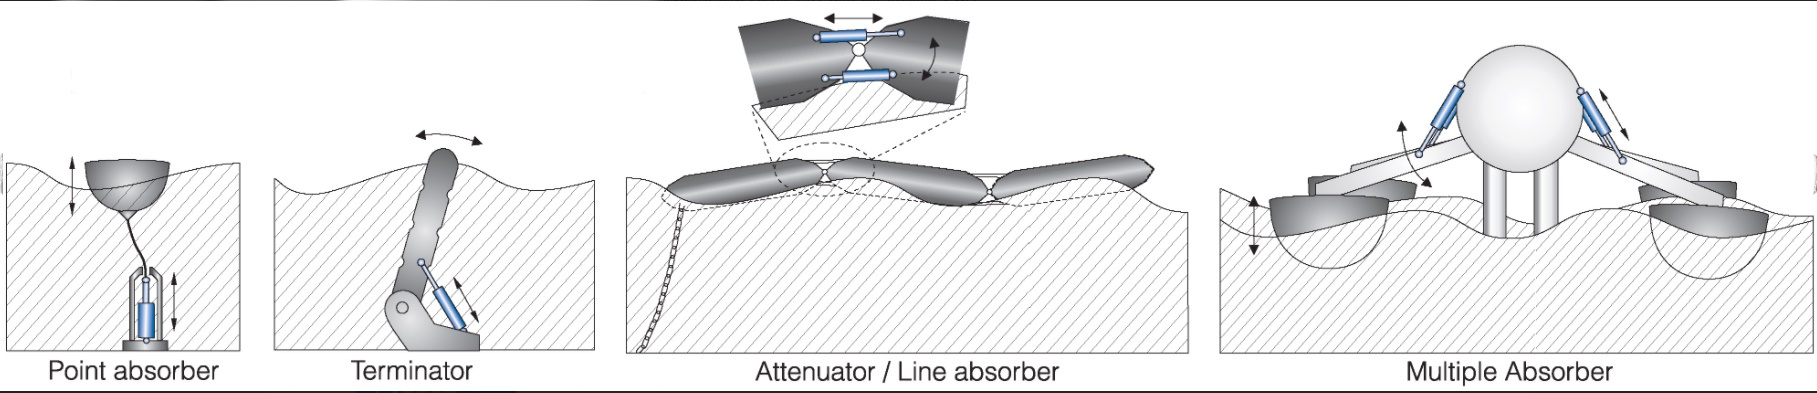
| 11:00, 9 January 2021 | WaveAbsorbers.jpg (file) | 208 KB | Different energy conversion principles based on absorption of wave energy. | 1 | |
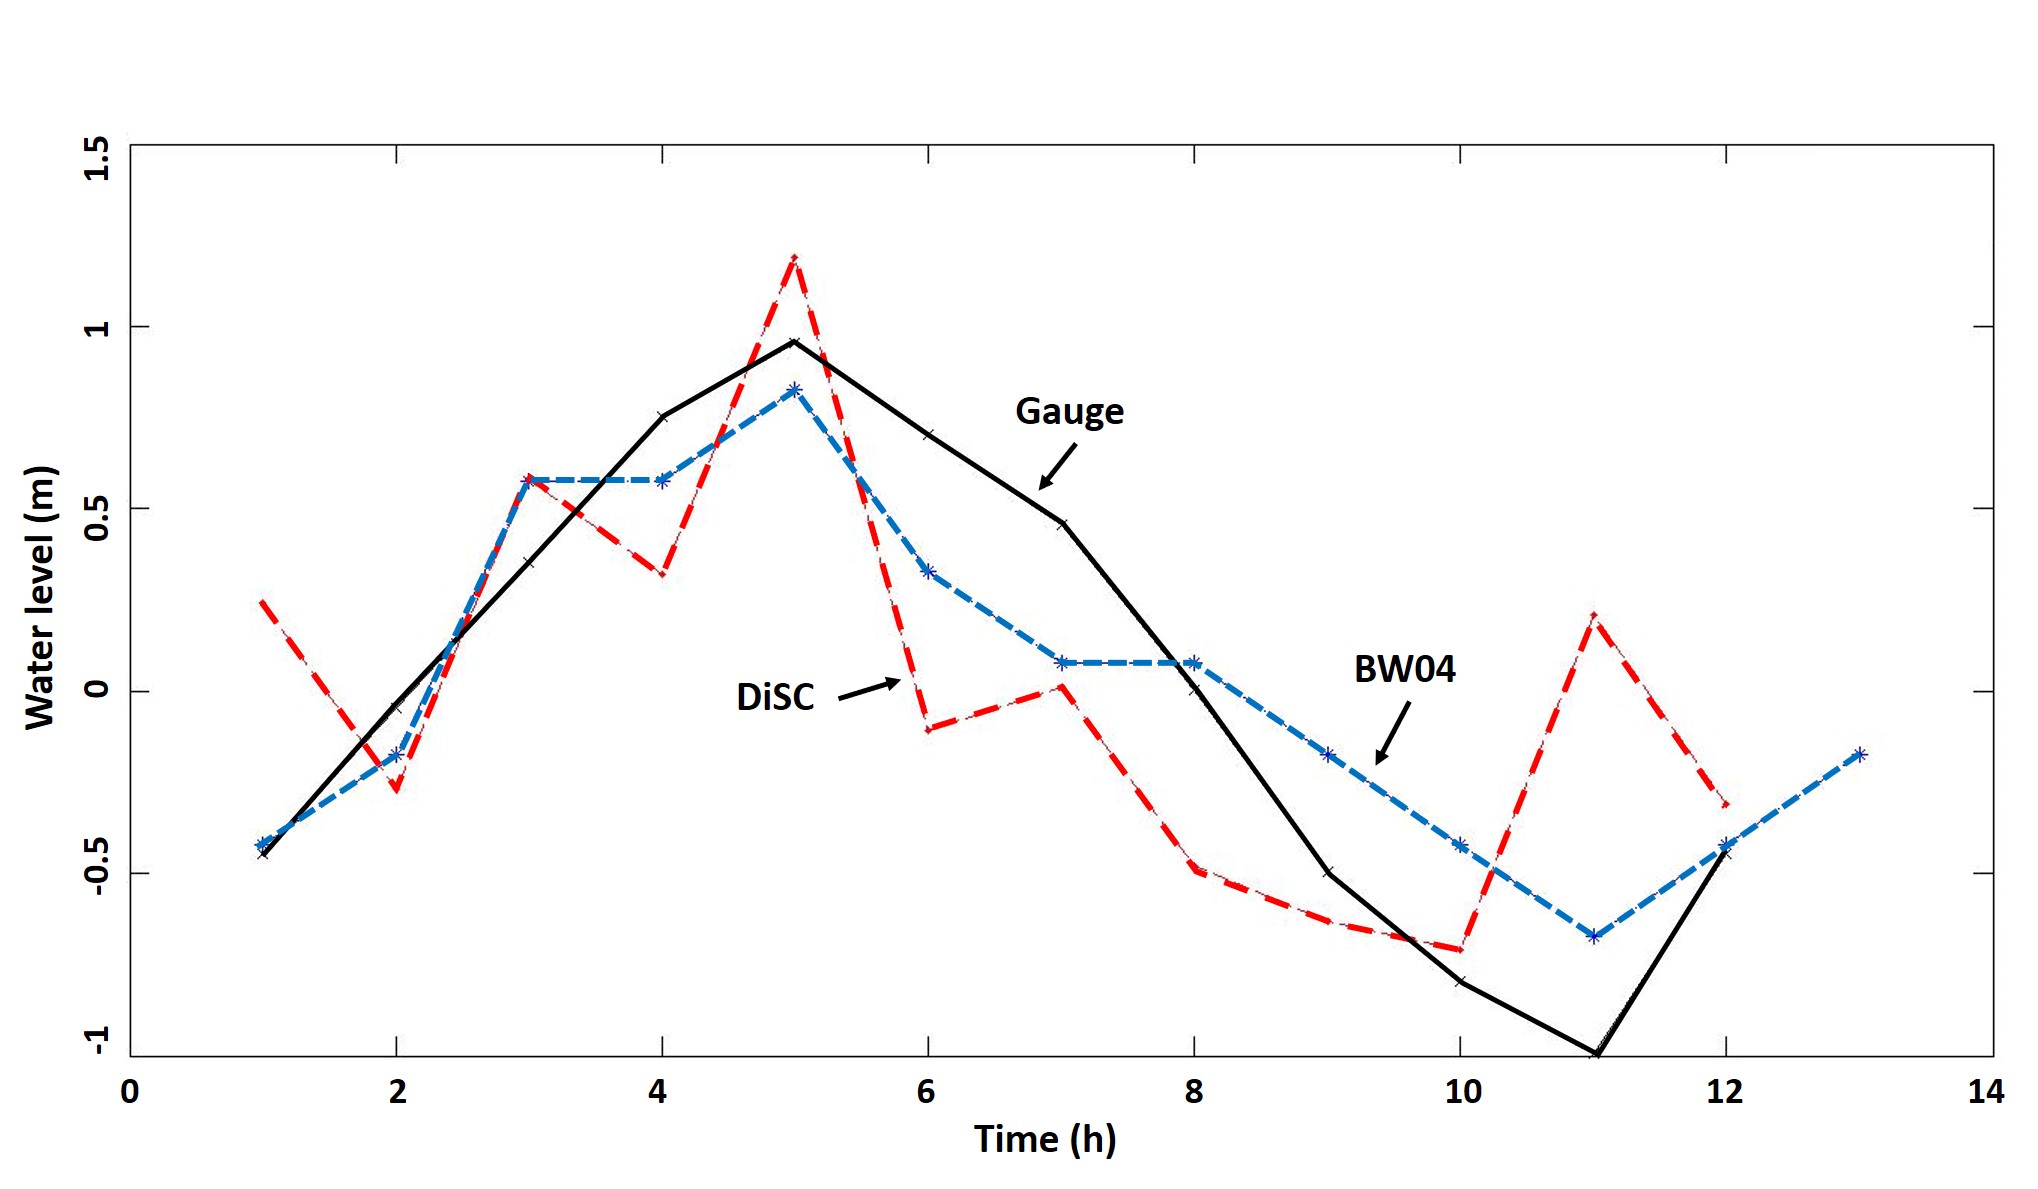
| 12:20, 26 October 2020 | WaterLevels.jpg (file) |  |
163 KB | Time series of water level calculated with BW04, DiSC in the deepest part of the tidal channel together with the measured water level. | 1 |
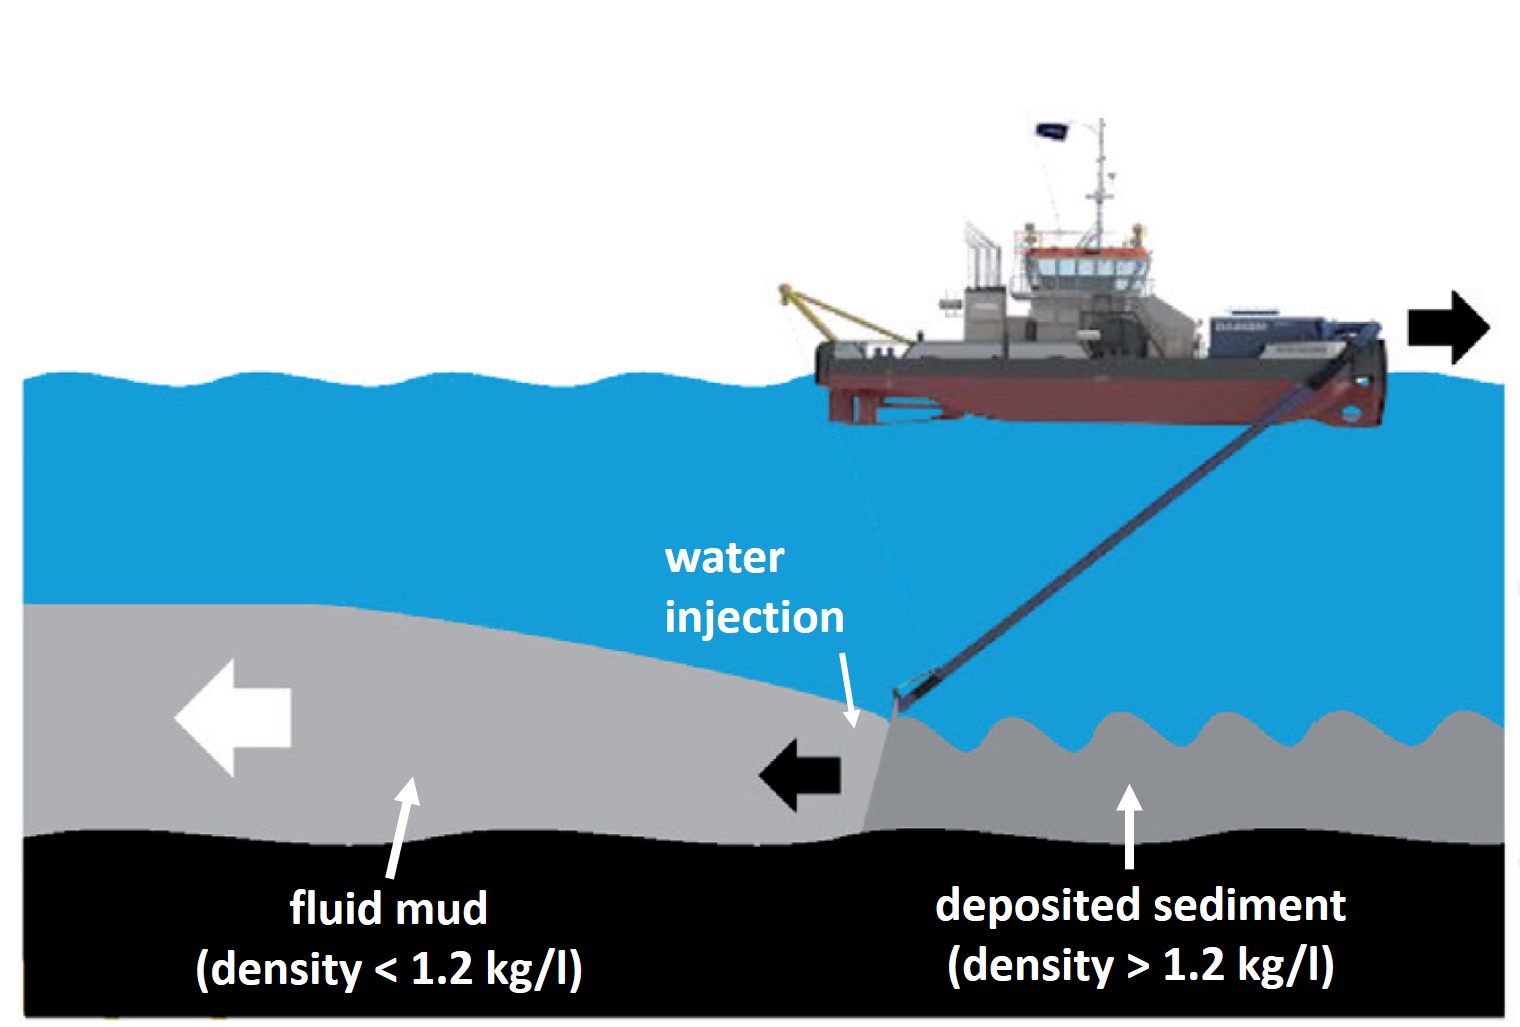
| 12:19, 19 February 2022 | WaterInjectionDredging.jpg (file) |  |
116 KB | Cartoon of water injection dredging. | 1 |
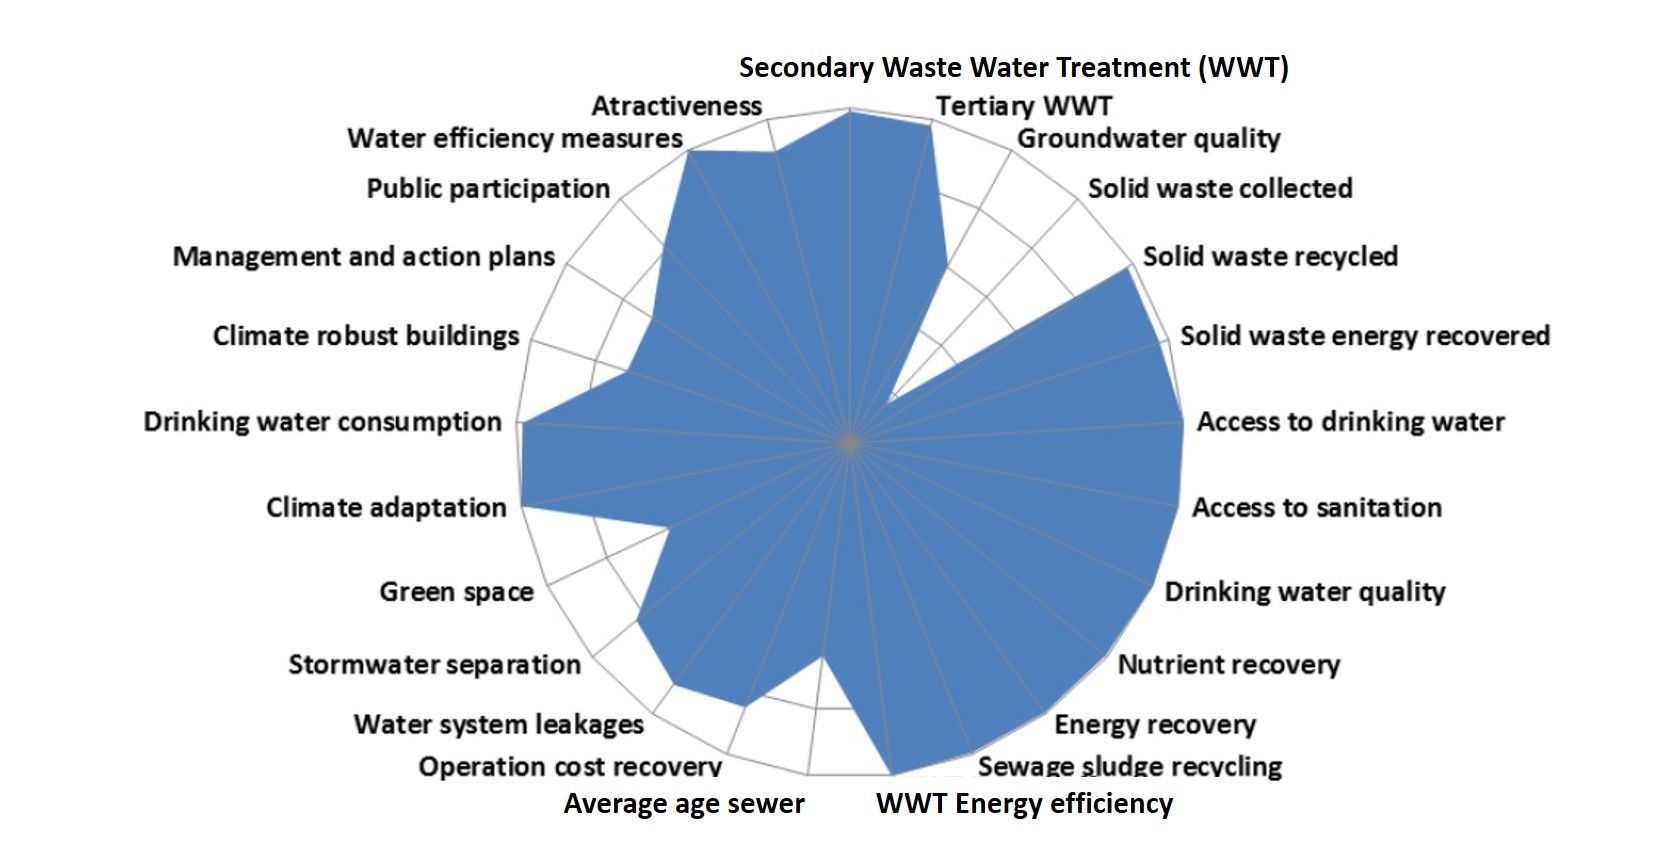
| 17:56, 5 February 2020 | WaterAssessmentAmsterdam.jpg (file) |  |
153 KB | Assessment of policy objectives related to urban water management for the city of Amsterdam. | 1 |
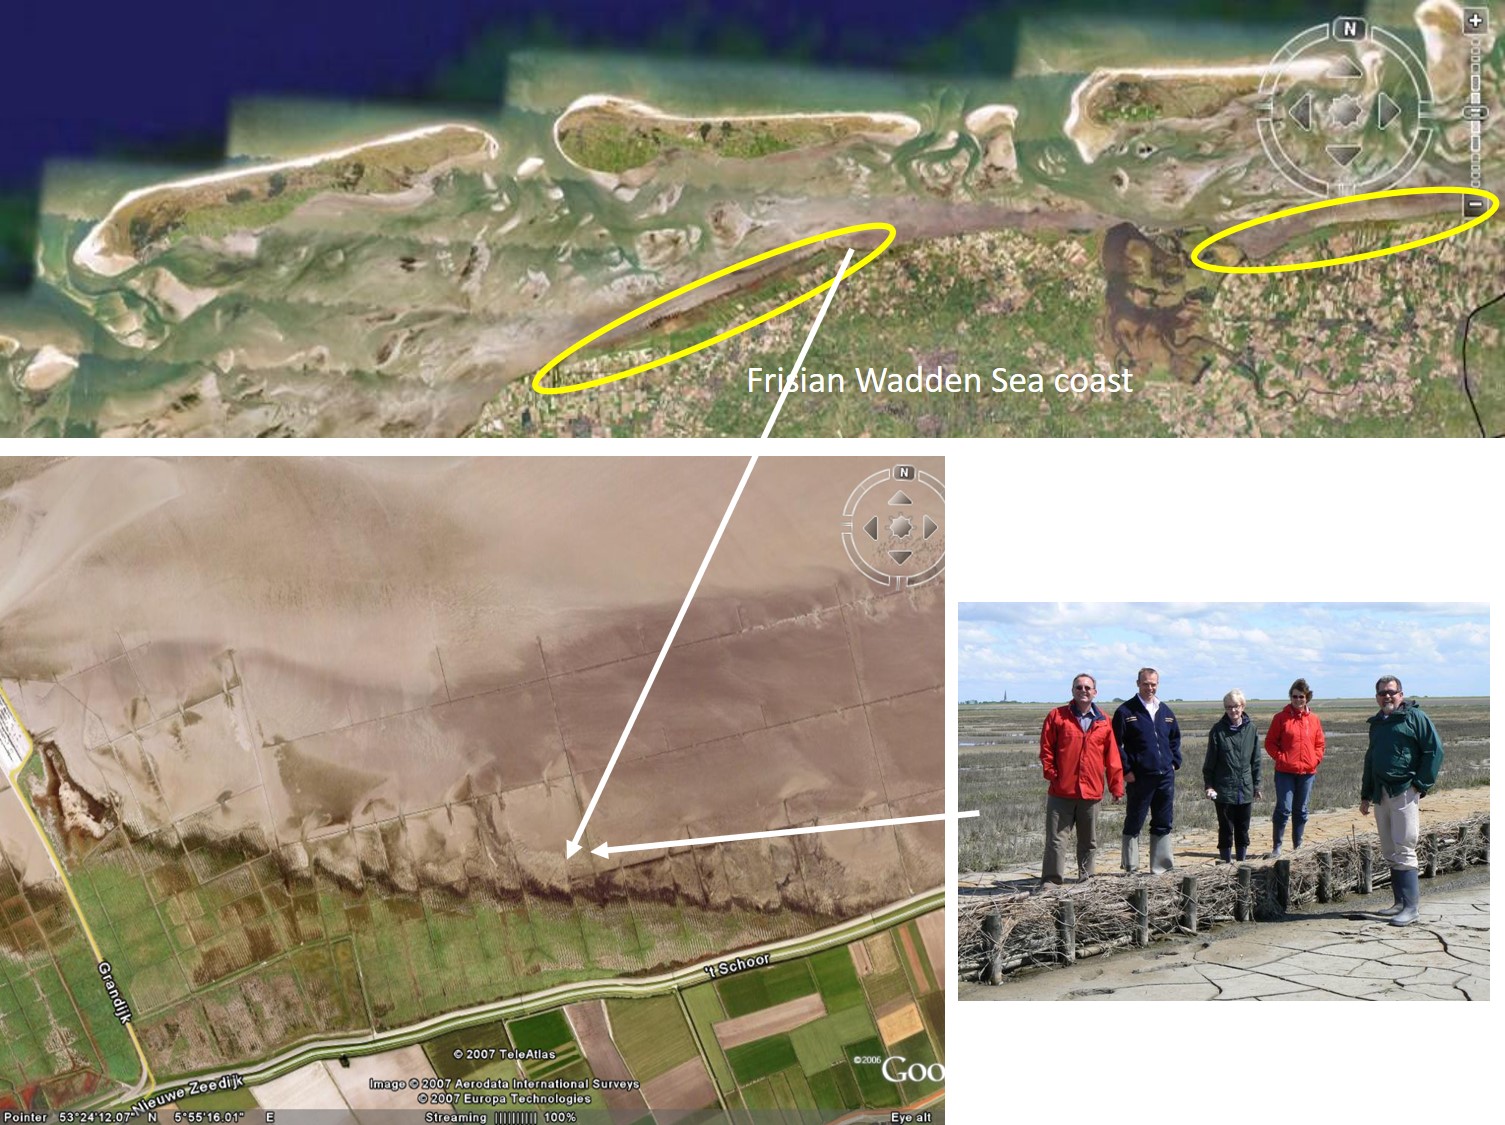
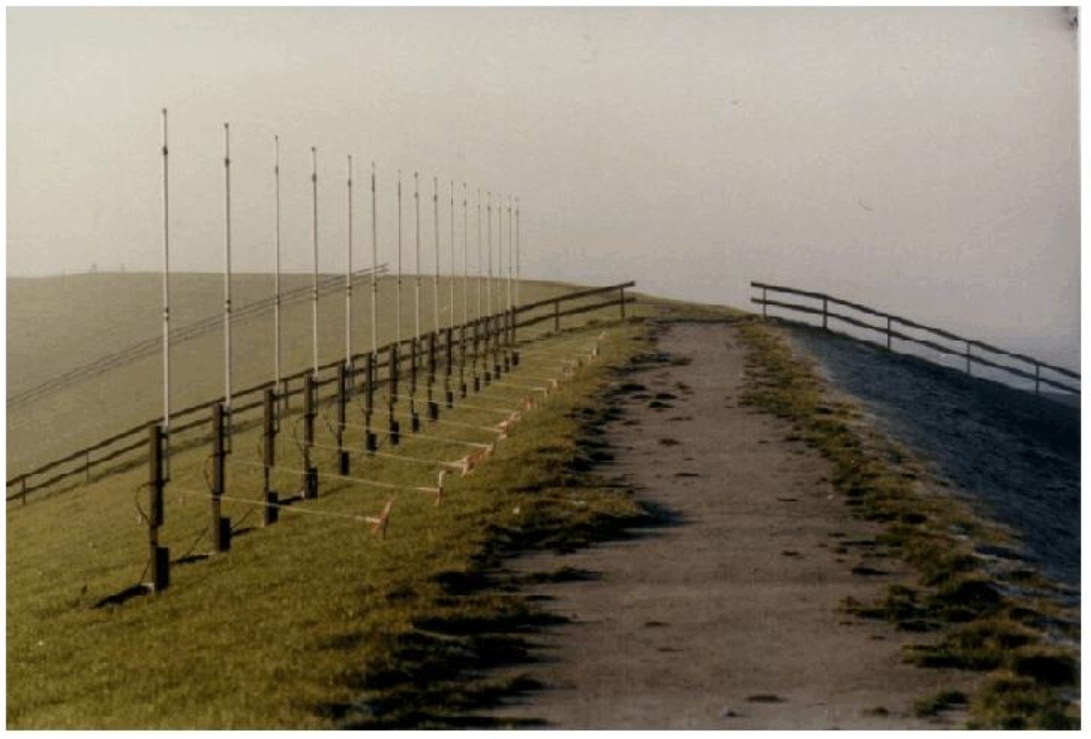
| 21:32, 29 September 2019 | WaddenSeaMarshCreation.jpg (file) |  |
388 KB | Dikes along the Wadden Sea are protected by marshland created by stimulating natural sedimentation through fences of braided willow twigs. | 1 |
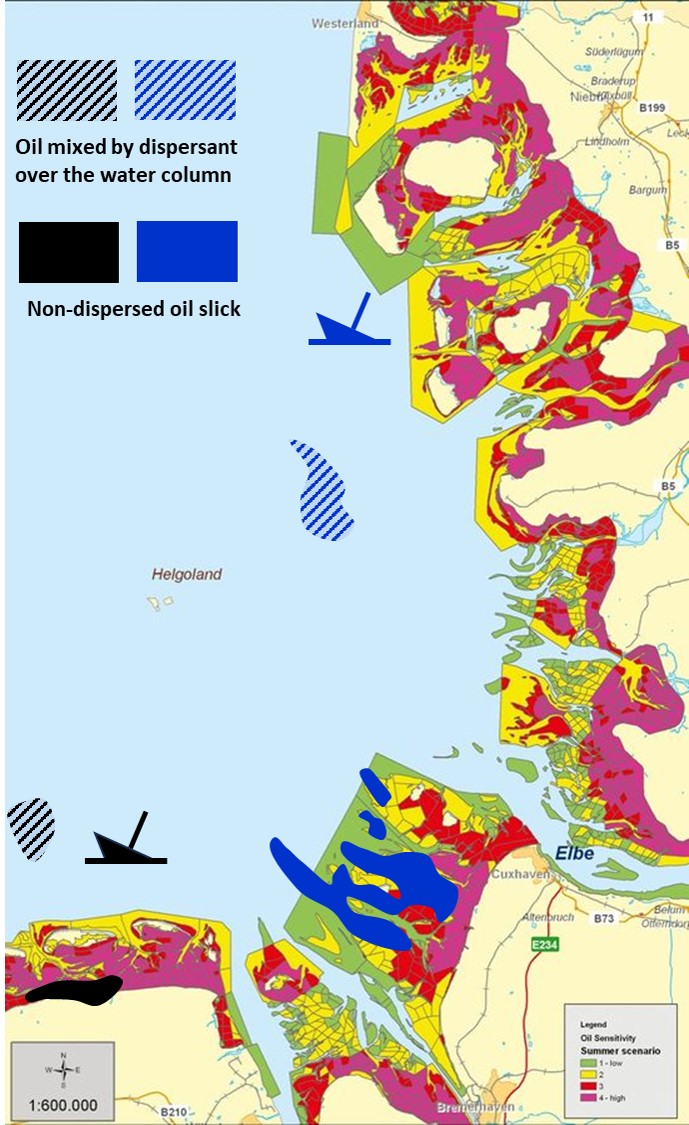
| 18:23, 6 February 2024 | WaddenOilSpill.jpg (file) |  |
185 KB | Numerical simulation of oil spill locations 5 days after hypothetical oil releases on 15th of March 2008 at 04:00 UTC from a black oil tanker and a blue oil tanker. Dashed spills are mixed over the water column by dispersant application. Full black and... | 1 |
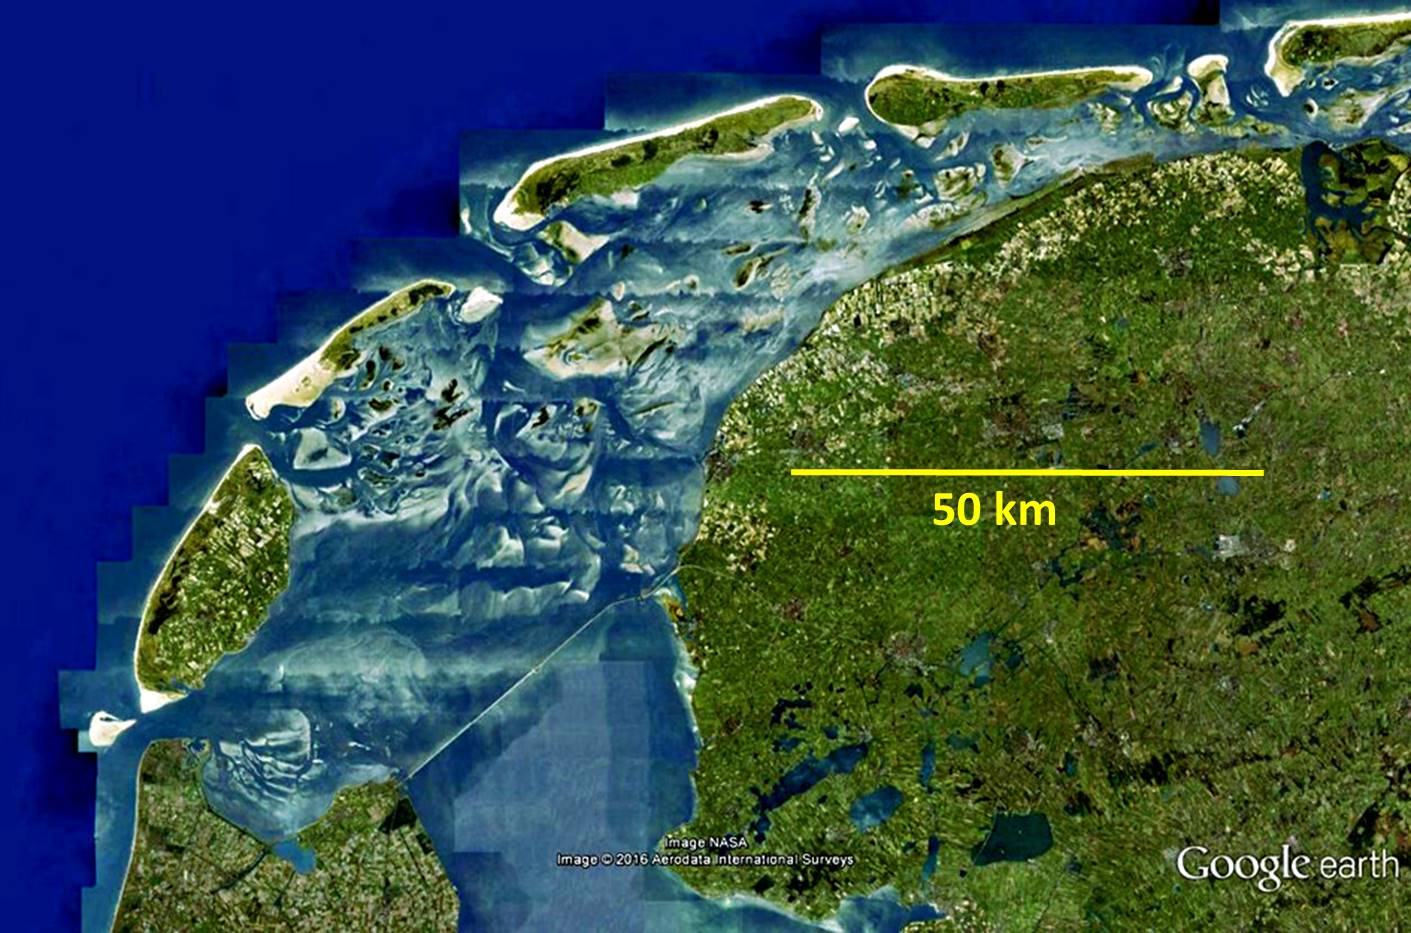
| 17:21, 6 July 2016 | Wadden.jpg (file) |  |
209 KB | Western Wadden Sea | 1 |
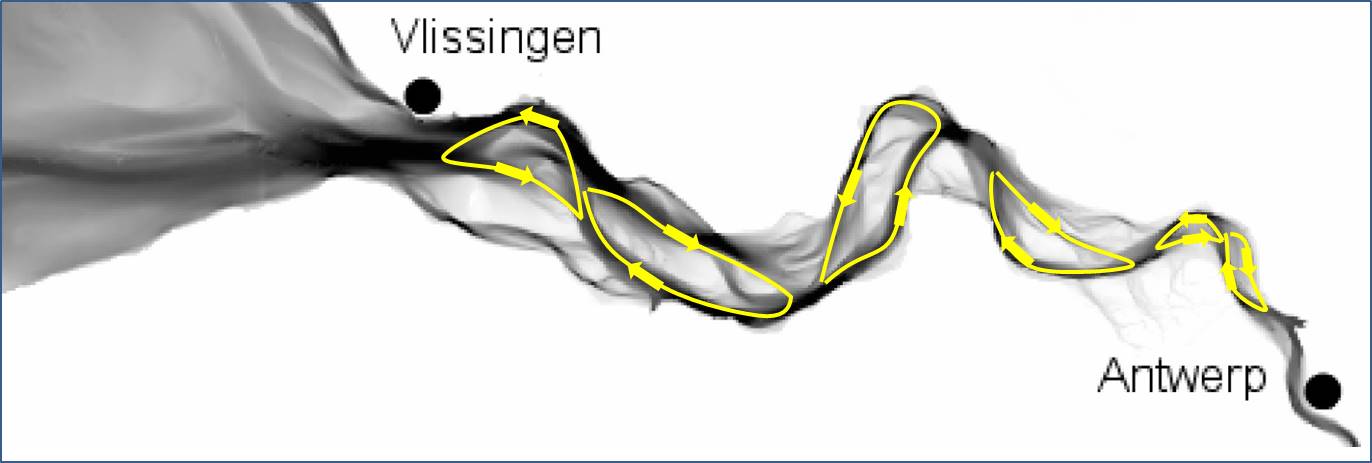
| 23:01, 25 January 2016 | WScirculations.JPG (file) |  |
48 KB | Circulation cells in the Western Scheldt related to ebb- and flood-dominated channels. | 1 |
| 21:08, 24 October 2020 | WERAspectrum.jpg (file) |  |
77 KB | Typical backscatter spectrum of sea echoes, normalized to the strongest signal measured by WERA. | 1 |
| 21:07, 24 October 2020 | WERAantenna.jpg (file) |  |
162 KB | Typical example of an antenna installation for WERA radar. | 1 |
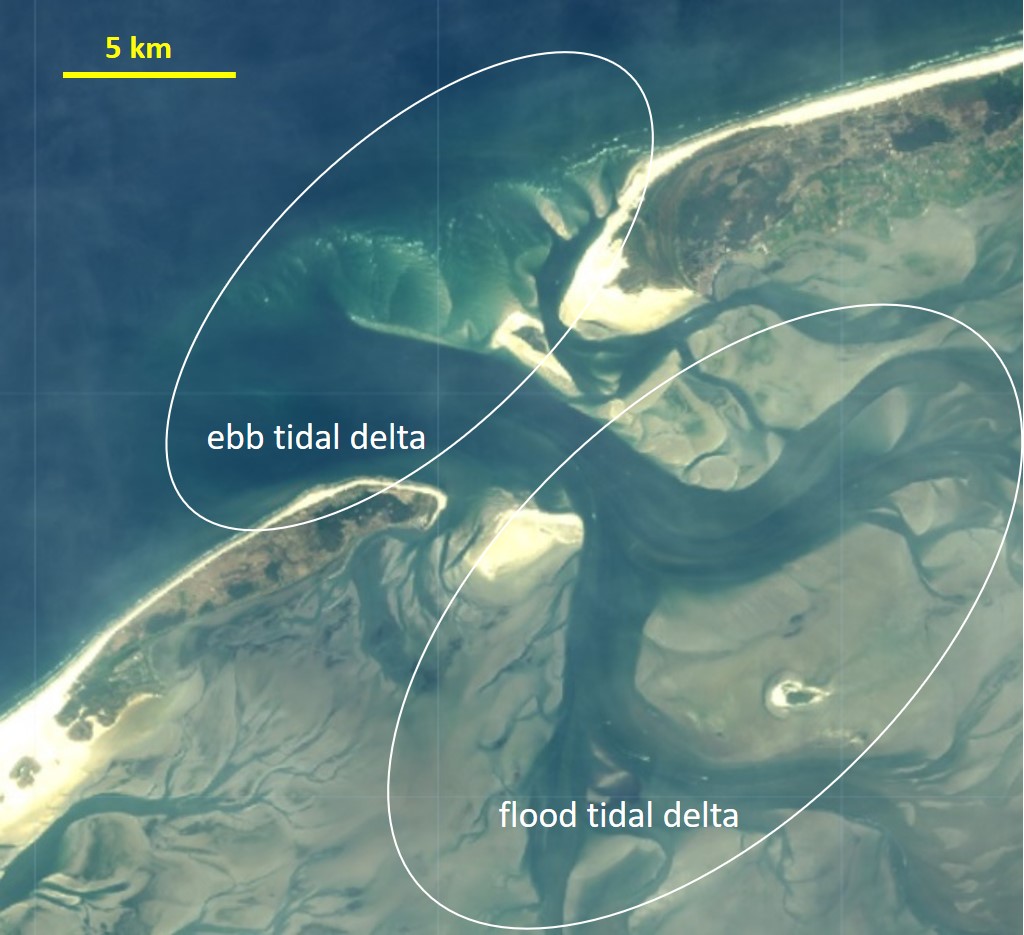
| 22:52, 29 March 2021 | VlieEbbFloodDelta.jpg (file) |  |
140 KB | Vlie inlet in the Western Wadden Sea (Netherlands). | 1 |
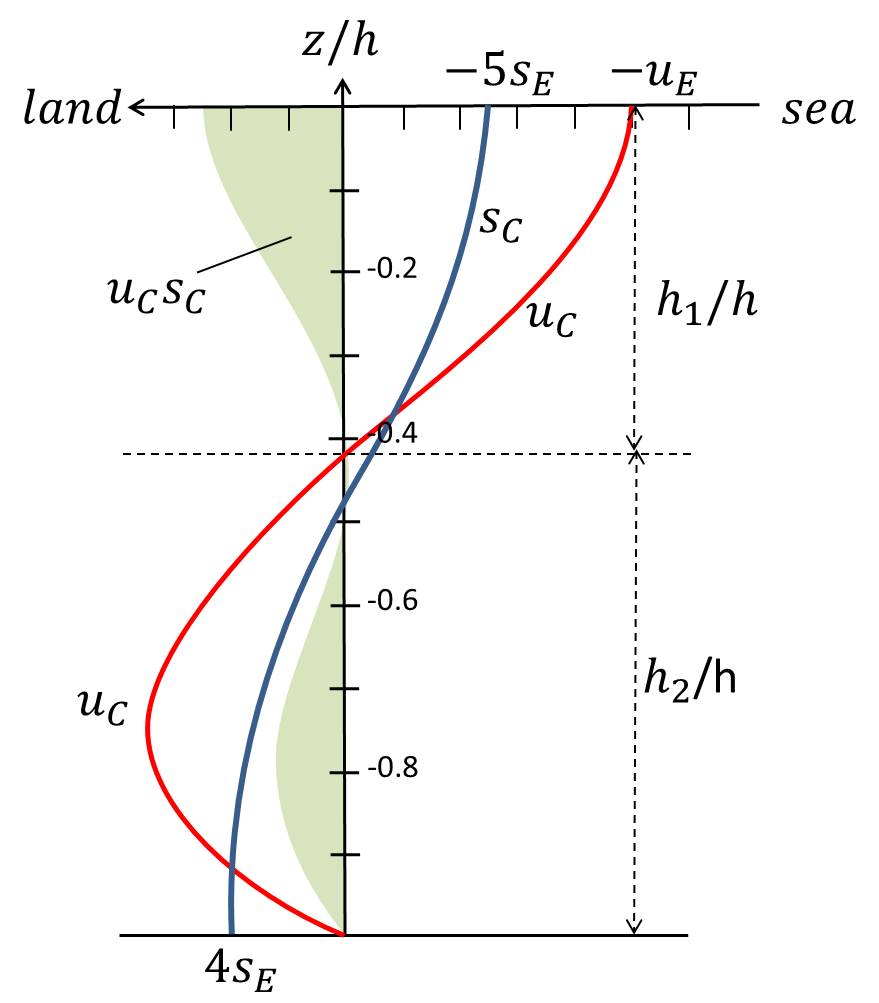
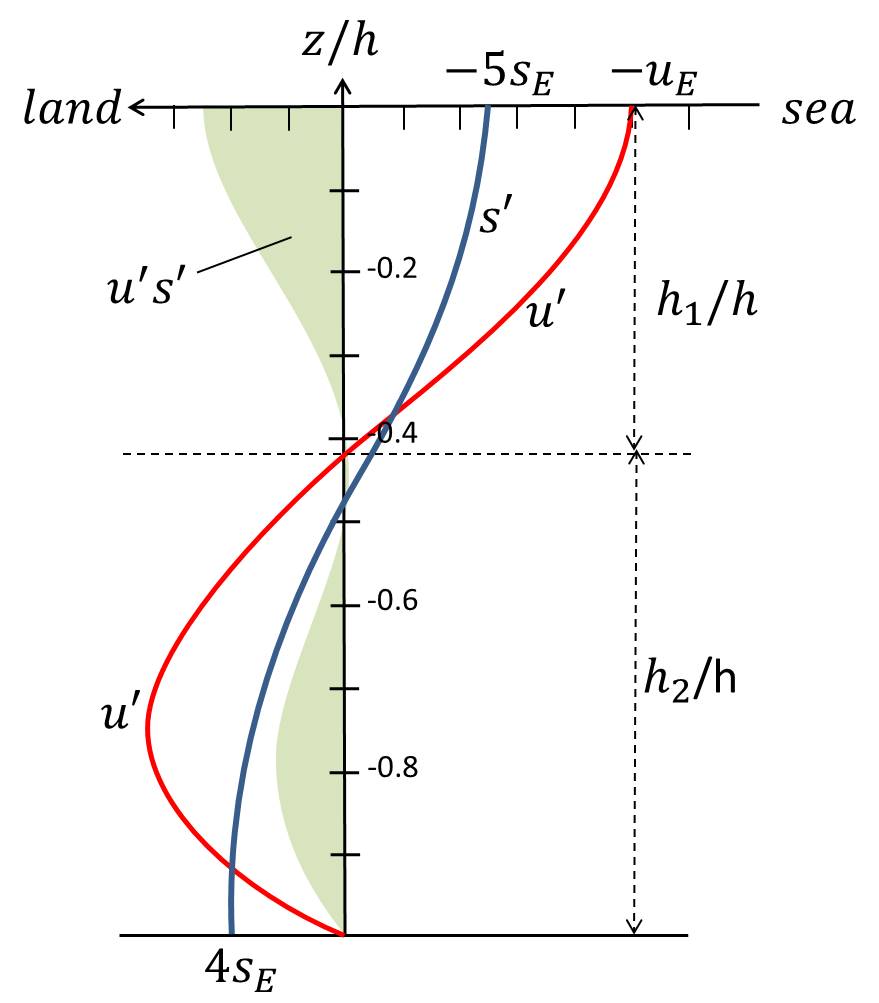
| 17:00, 25 November 2016 | VelSalProfilesNew.jpg (file) |  |
53 KB | Vertical profiles of estuarine circulation and salinity according to the classical theory. | 1 |
| 12:31, 12 April 2016 | VelSalProfiles.jpg (file) |  |
52 KB | Vertical profiles of estuarine circulation and salinity according to the classical theory. | 1 |
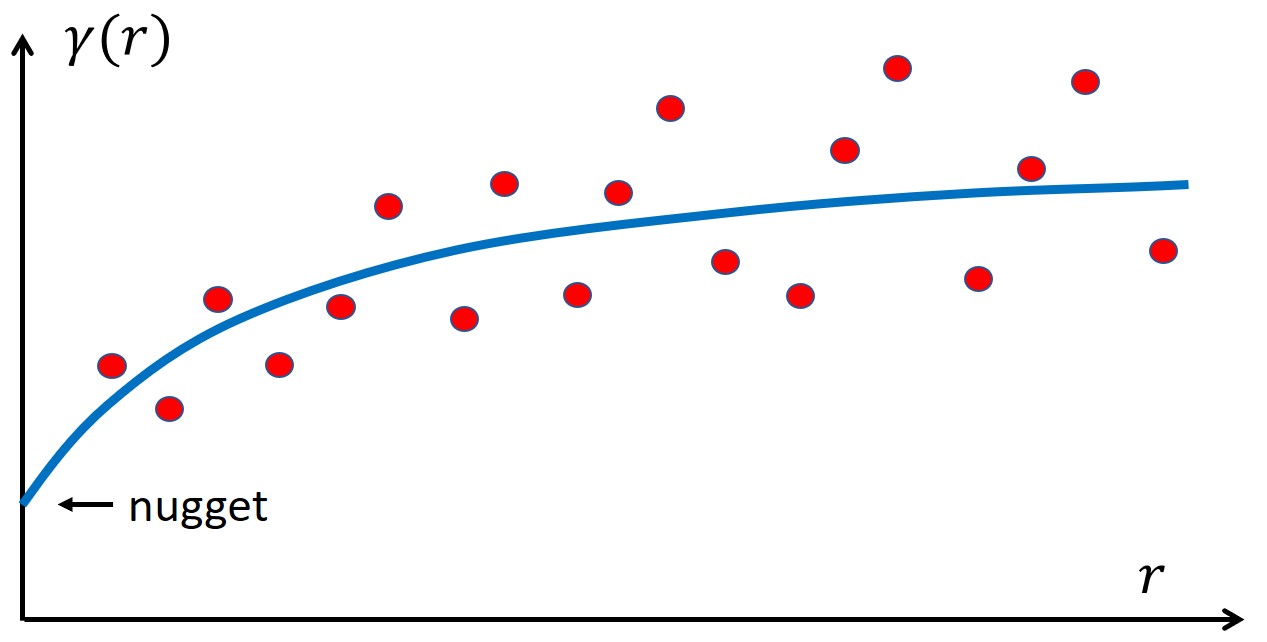
| 22:41, 16 October 2021 | Variogram.jpg (file) |  |
50 KB | Example of a variogram. | 1 |
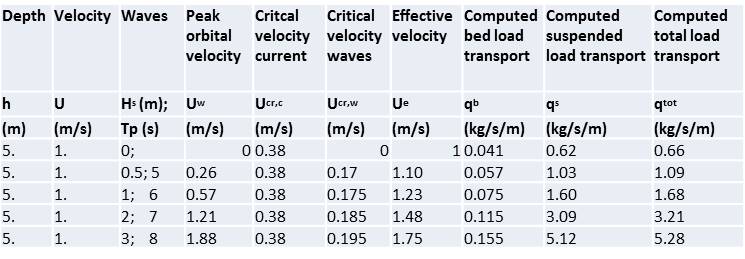
| 11:23, 11 October 2016 | VanRijnTable1.jpg (file) |  |
38 KB | Computed sand transport rates. | 1 |
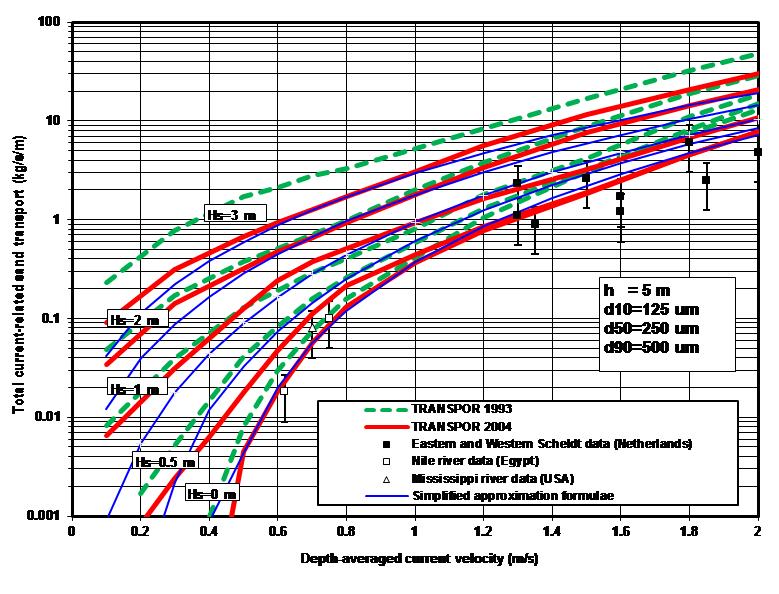
| 11:09, 11 October 2016 | VanRijnFig8.jpg (file) |  |
119 KB | Total sand transport for combined wave plus current conditions. | 1 |
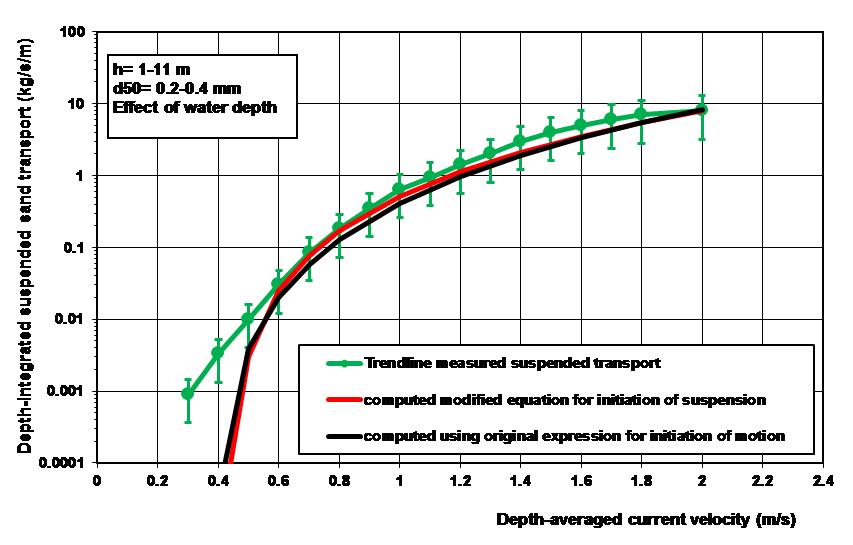
| 11:07, 11 October 2016 | VanRijnFig7.jpg (file) |  |
67 KB | Suspended transport as function of depth-averaged velocity. | 1 |
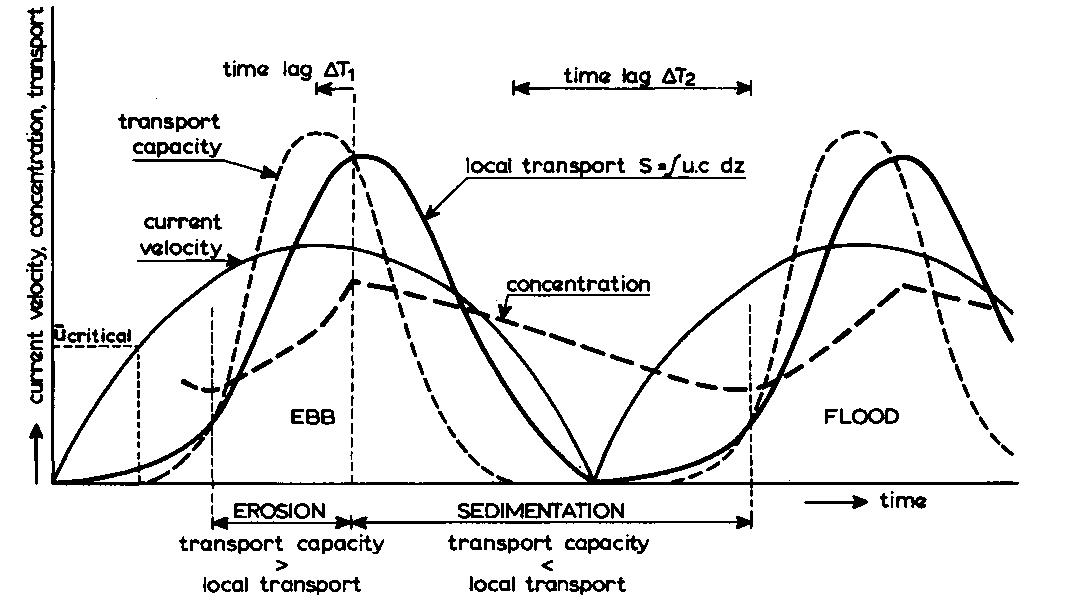
| 11:05, 11 October 2016 | VanRijnFig6.jpg (file) |  |
89 KB | Time lag of suspended sediment concentration in tidal flow. | 1 |