File list
This special page shows all uploaded files.
| Date | Name | Thumbnail | Size | Description | Versions |
|---|---|---|---|---|---|
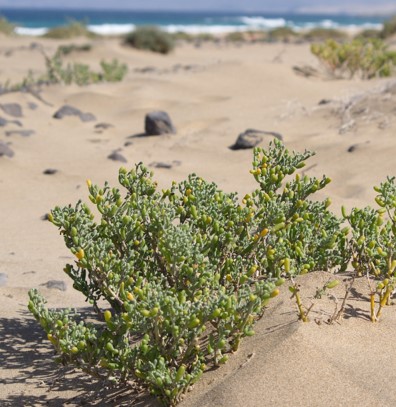
| 12:54, 20 April 2020 | ZygophyllumFontanesii.jpg (file) |  |
59 KB | Zygophyllum fontanesii / Tetraena fontanesii (sea grape) Photo credit: Jorge Íñiguez Yarza https://www.flickr.com/photos/georgeoide/35511391030 | 1 |
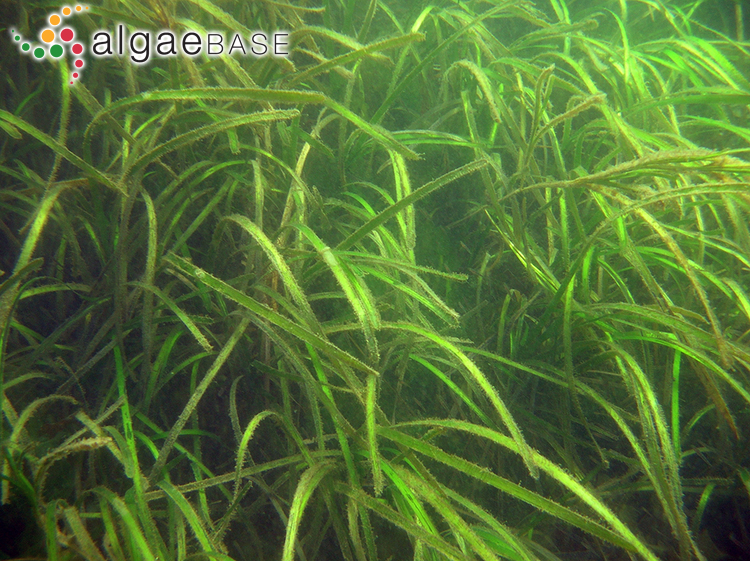
| 13:31, 2 March 2021 | ZosteraNoltii.jpg (file) |  |
281 KB | ''Zostera noltii'' [https://www.algaebase.org/ Photo credit Ignacio Barbara]. | 1 |
| 13:26, 2 March 2021 | ZosteraMarina.jpg (file) |  |
581 KB | Zostera marina. Photo credit Ignacio Barbara. www.algaebase.org | 1 |
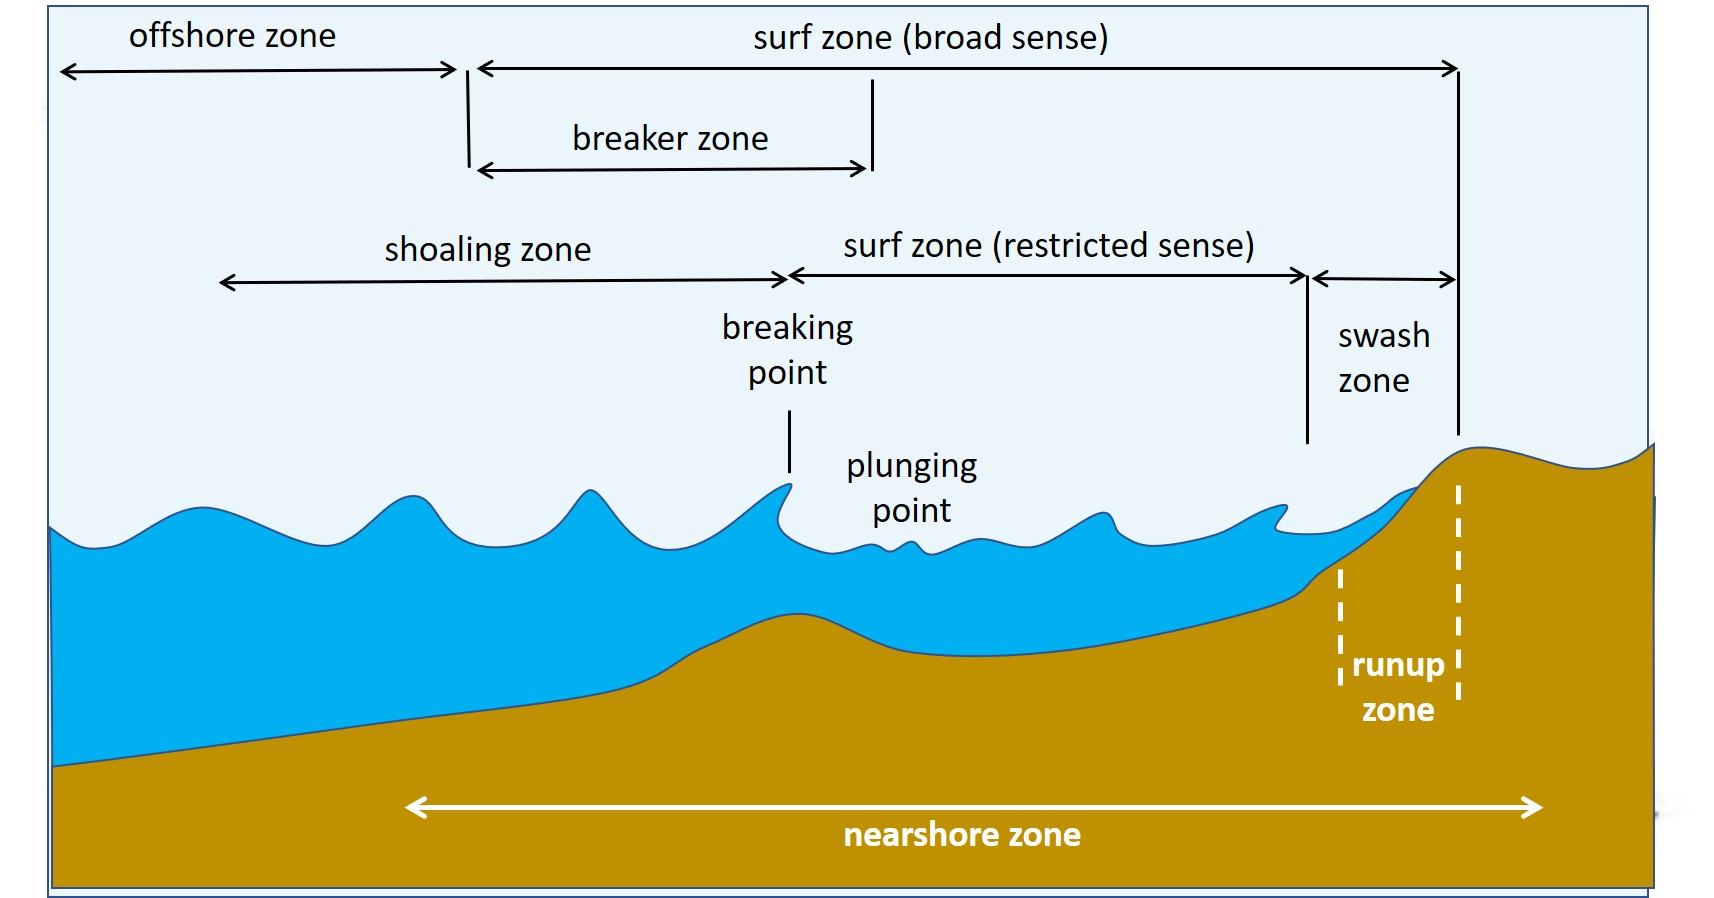
| 17:31, 18 September 2020 | ZoneDivisionNearshore.jpg (file) |  |
135 KB | Zone division in the nearshore region. | 1 |
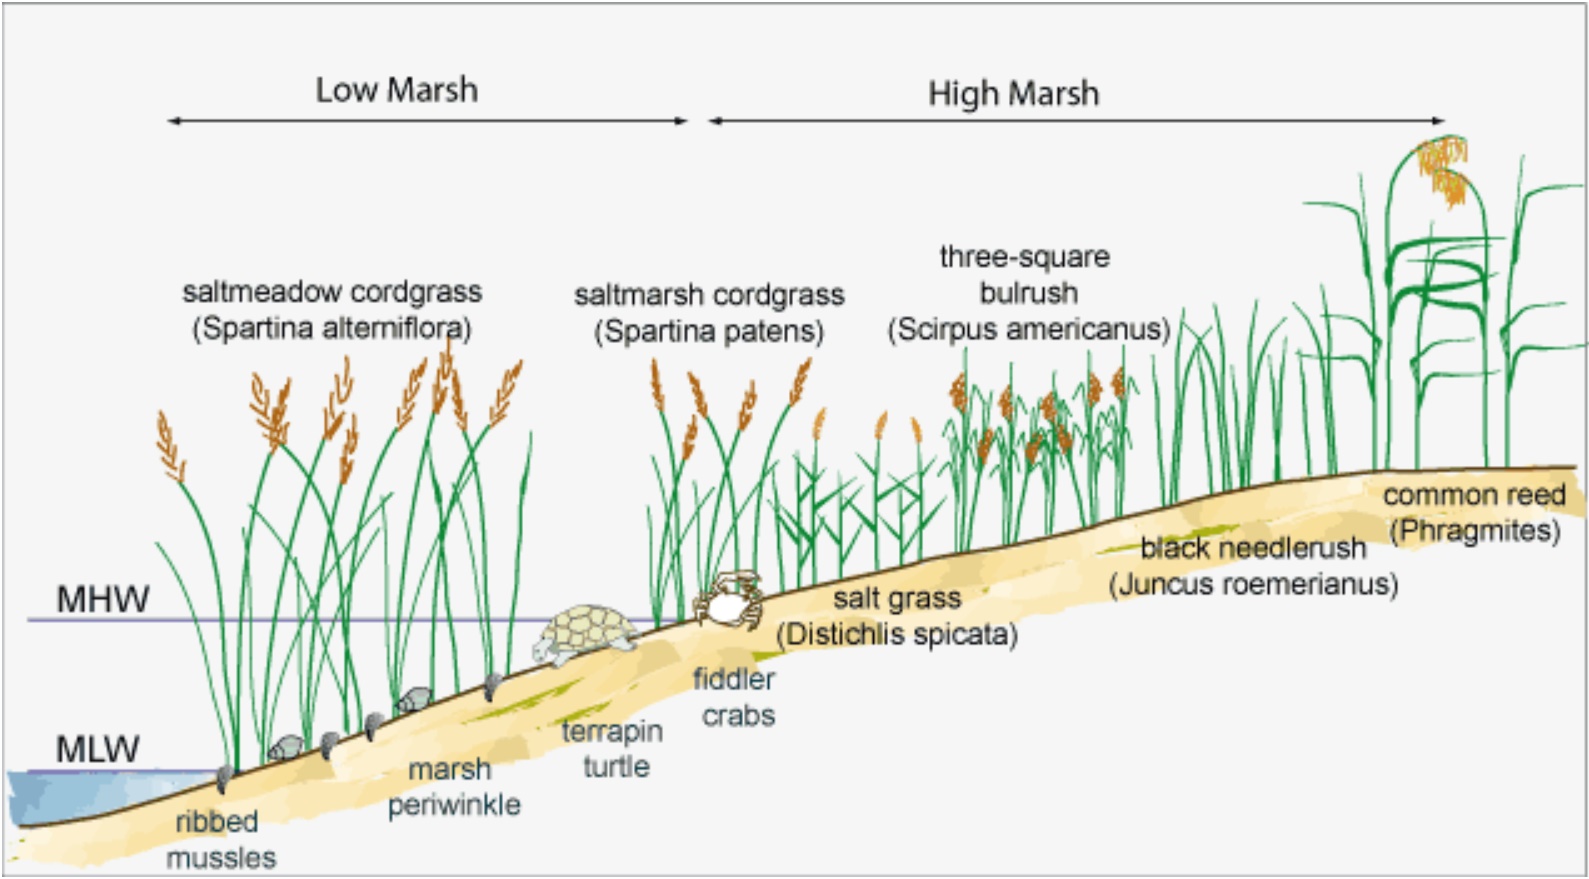
| 11:46, 27 February 2021 | ZonationSaltMarshes.jpg (file) |  |
235 KB | Zonation salt marshes. | 1 |
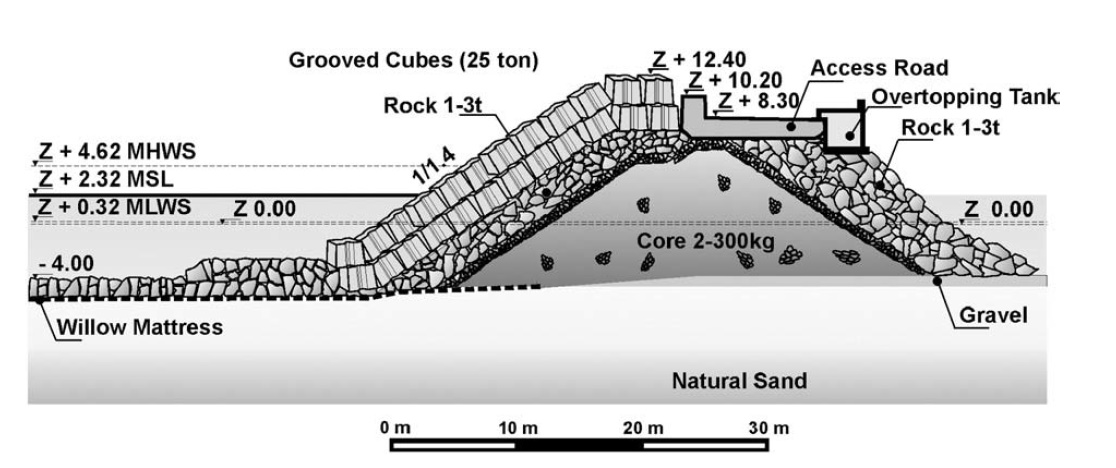
| 17:29, 18 September 2020 | ZeebruggeBreakwater.jpg (file) |  |
134 KB | Cross-section of Zeebrugge rubble mound breakwater. | 1 |
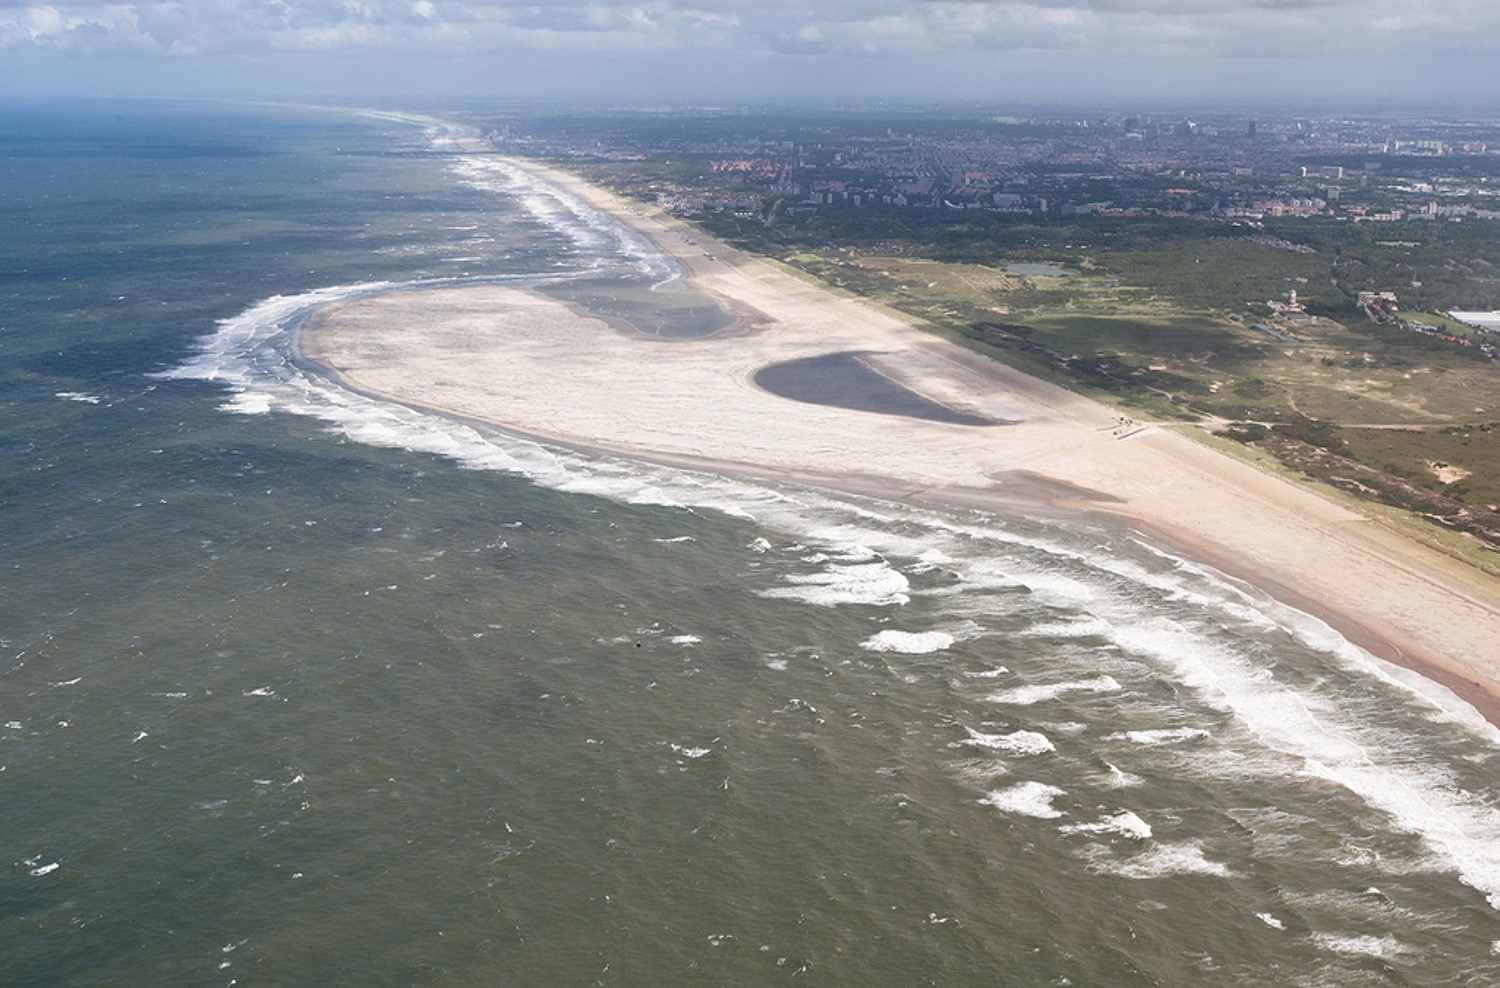
| 19:36, 16 February 2019 | Zandmotor2012.jpg (file) |  |
324 KB | A massive foreshore nourishment increases the strength of the narrow dune system protecting the coast between Rotterdam and The Hague (Netherlands). | 1 |
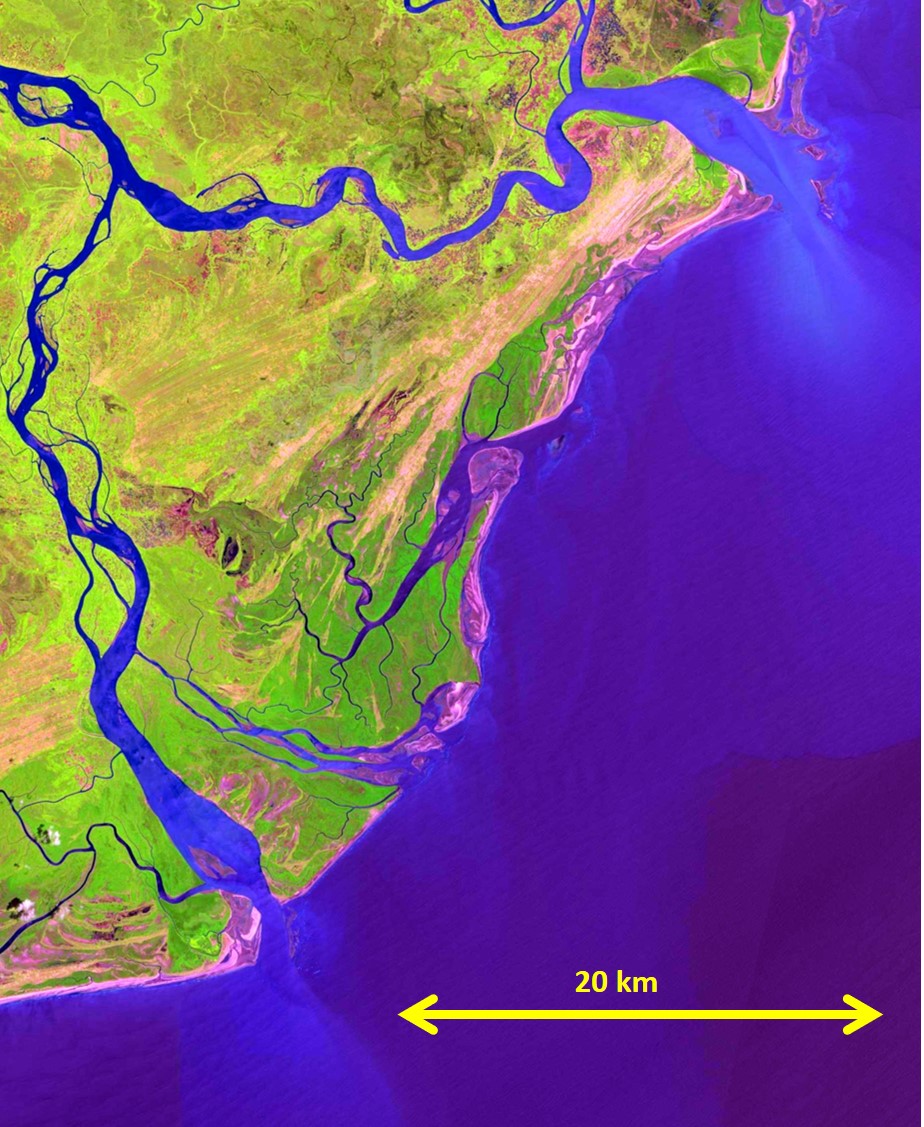
| 22:48, 26 November 2018 | ZambeziSentinelJan2017.jpg (file) |  |
277 KB | Zambezi River Delta on the Indian Ocean, Mozambique (Sentinel image). | 1 |
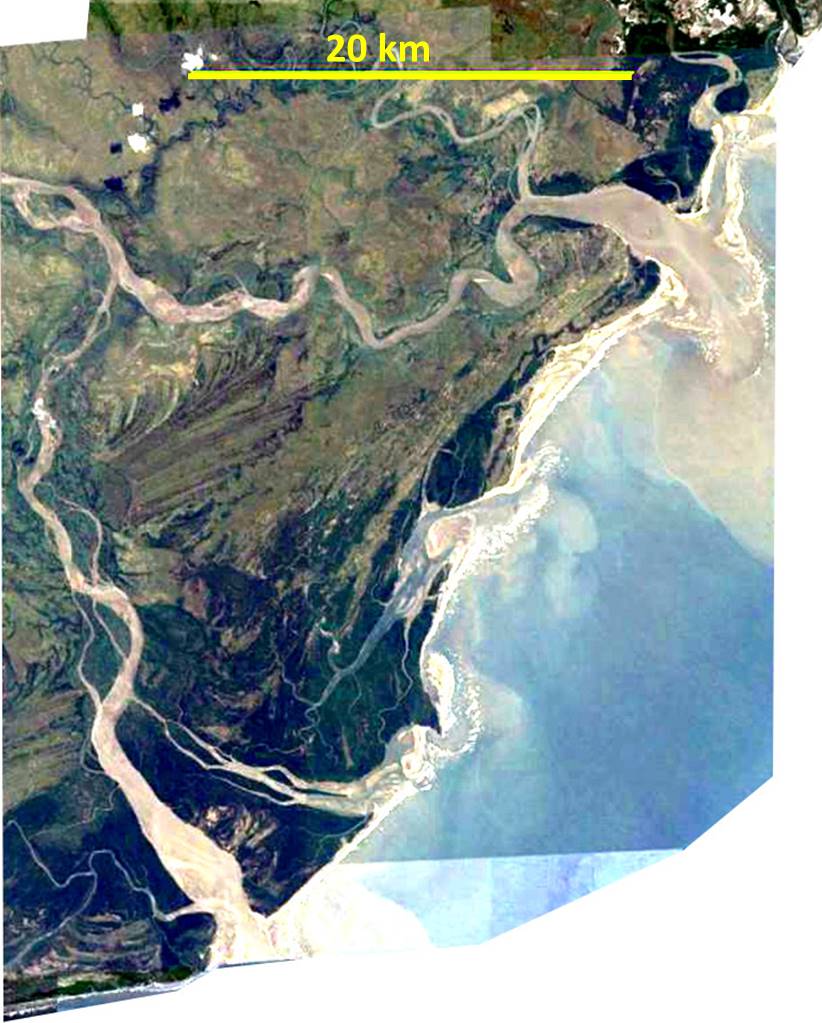
| 17:15, 6 July 2016 | Zambezi.jpg (file) |  |
120 KB | Zambezi River delta | 1 |
| 12:47, 27 February 2023 | YieldStressProbes.jpg (file) |  |
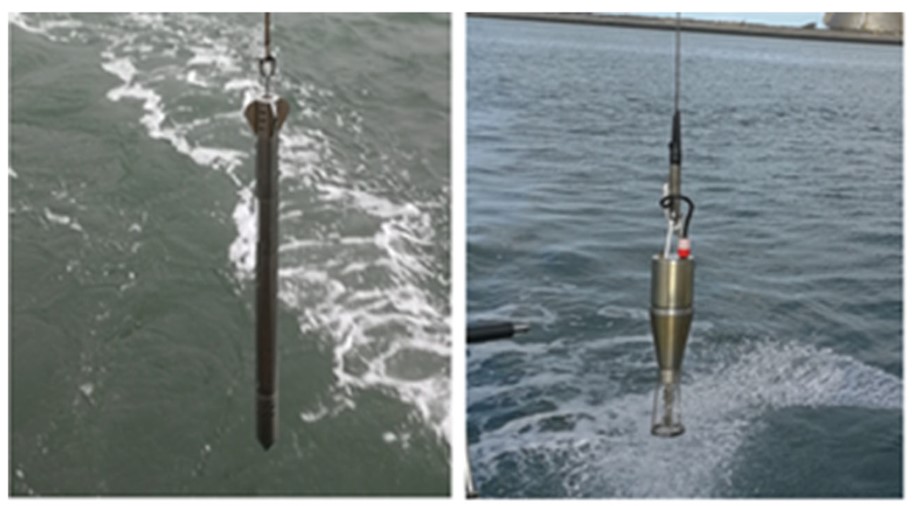
75 KB | Measurement devices for in situ yield stress determination. Left: Graviprobe. Right: Rheotune. From Kirichek, A., Shakeel, A. and Chassagne, C. 2020. Using in situ density and strength measurements for sediment maintenance in ports and waterways. J. So... | 1 |
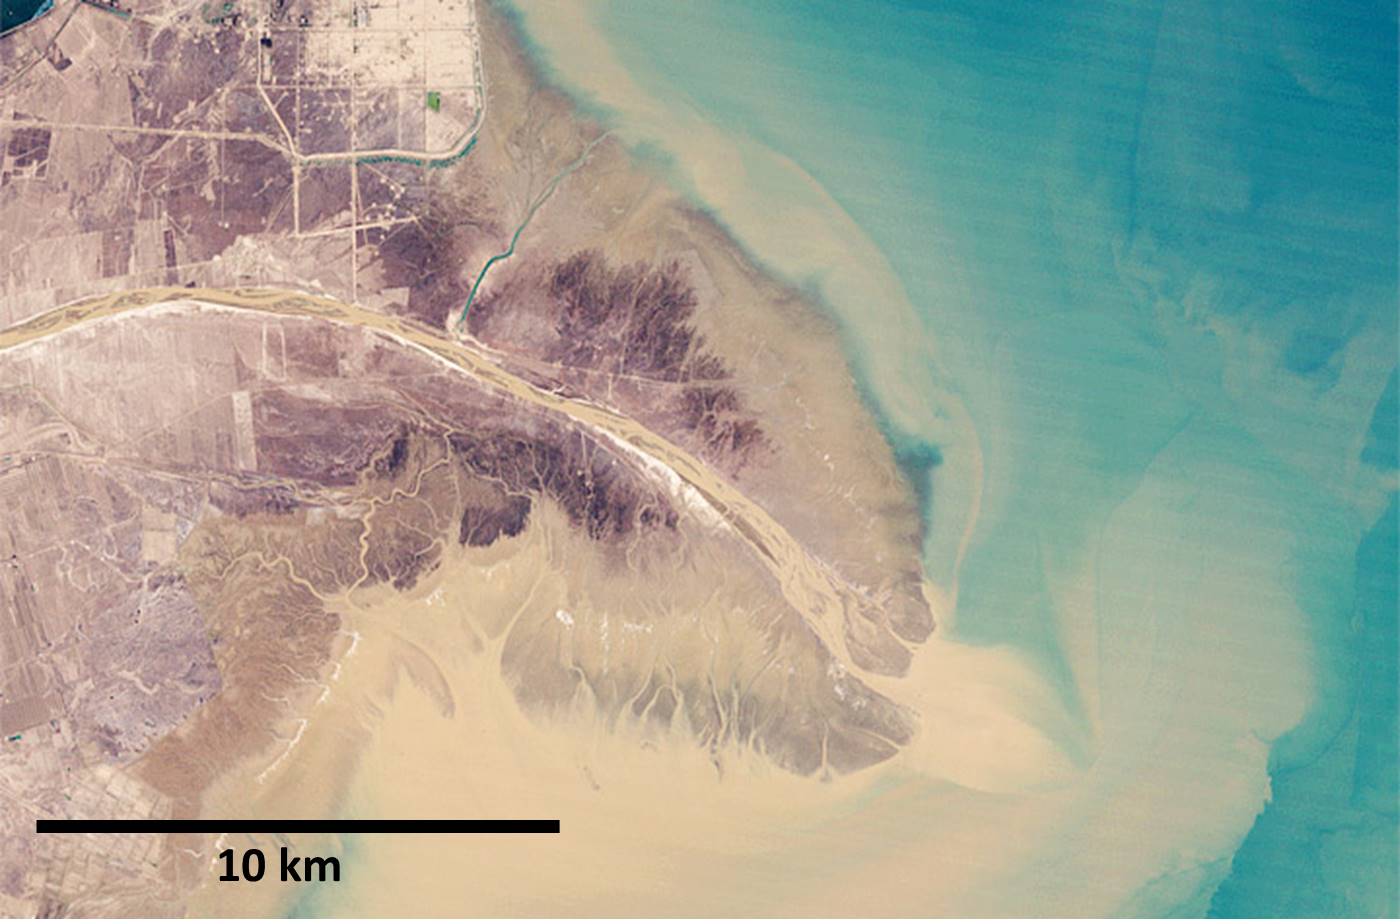
| 17:20, 6 July 2016 | Yellow.jpg (file) |  |
118 KB | Yellow River delta | 1 |
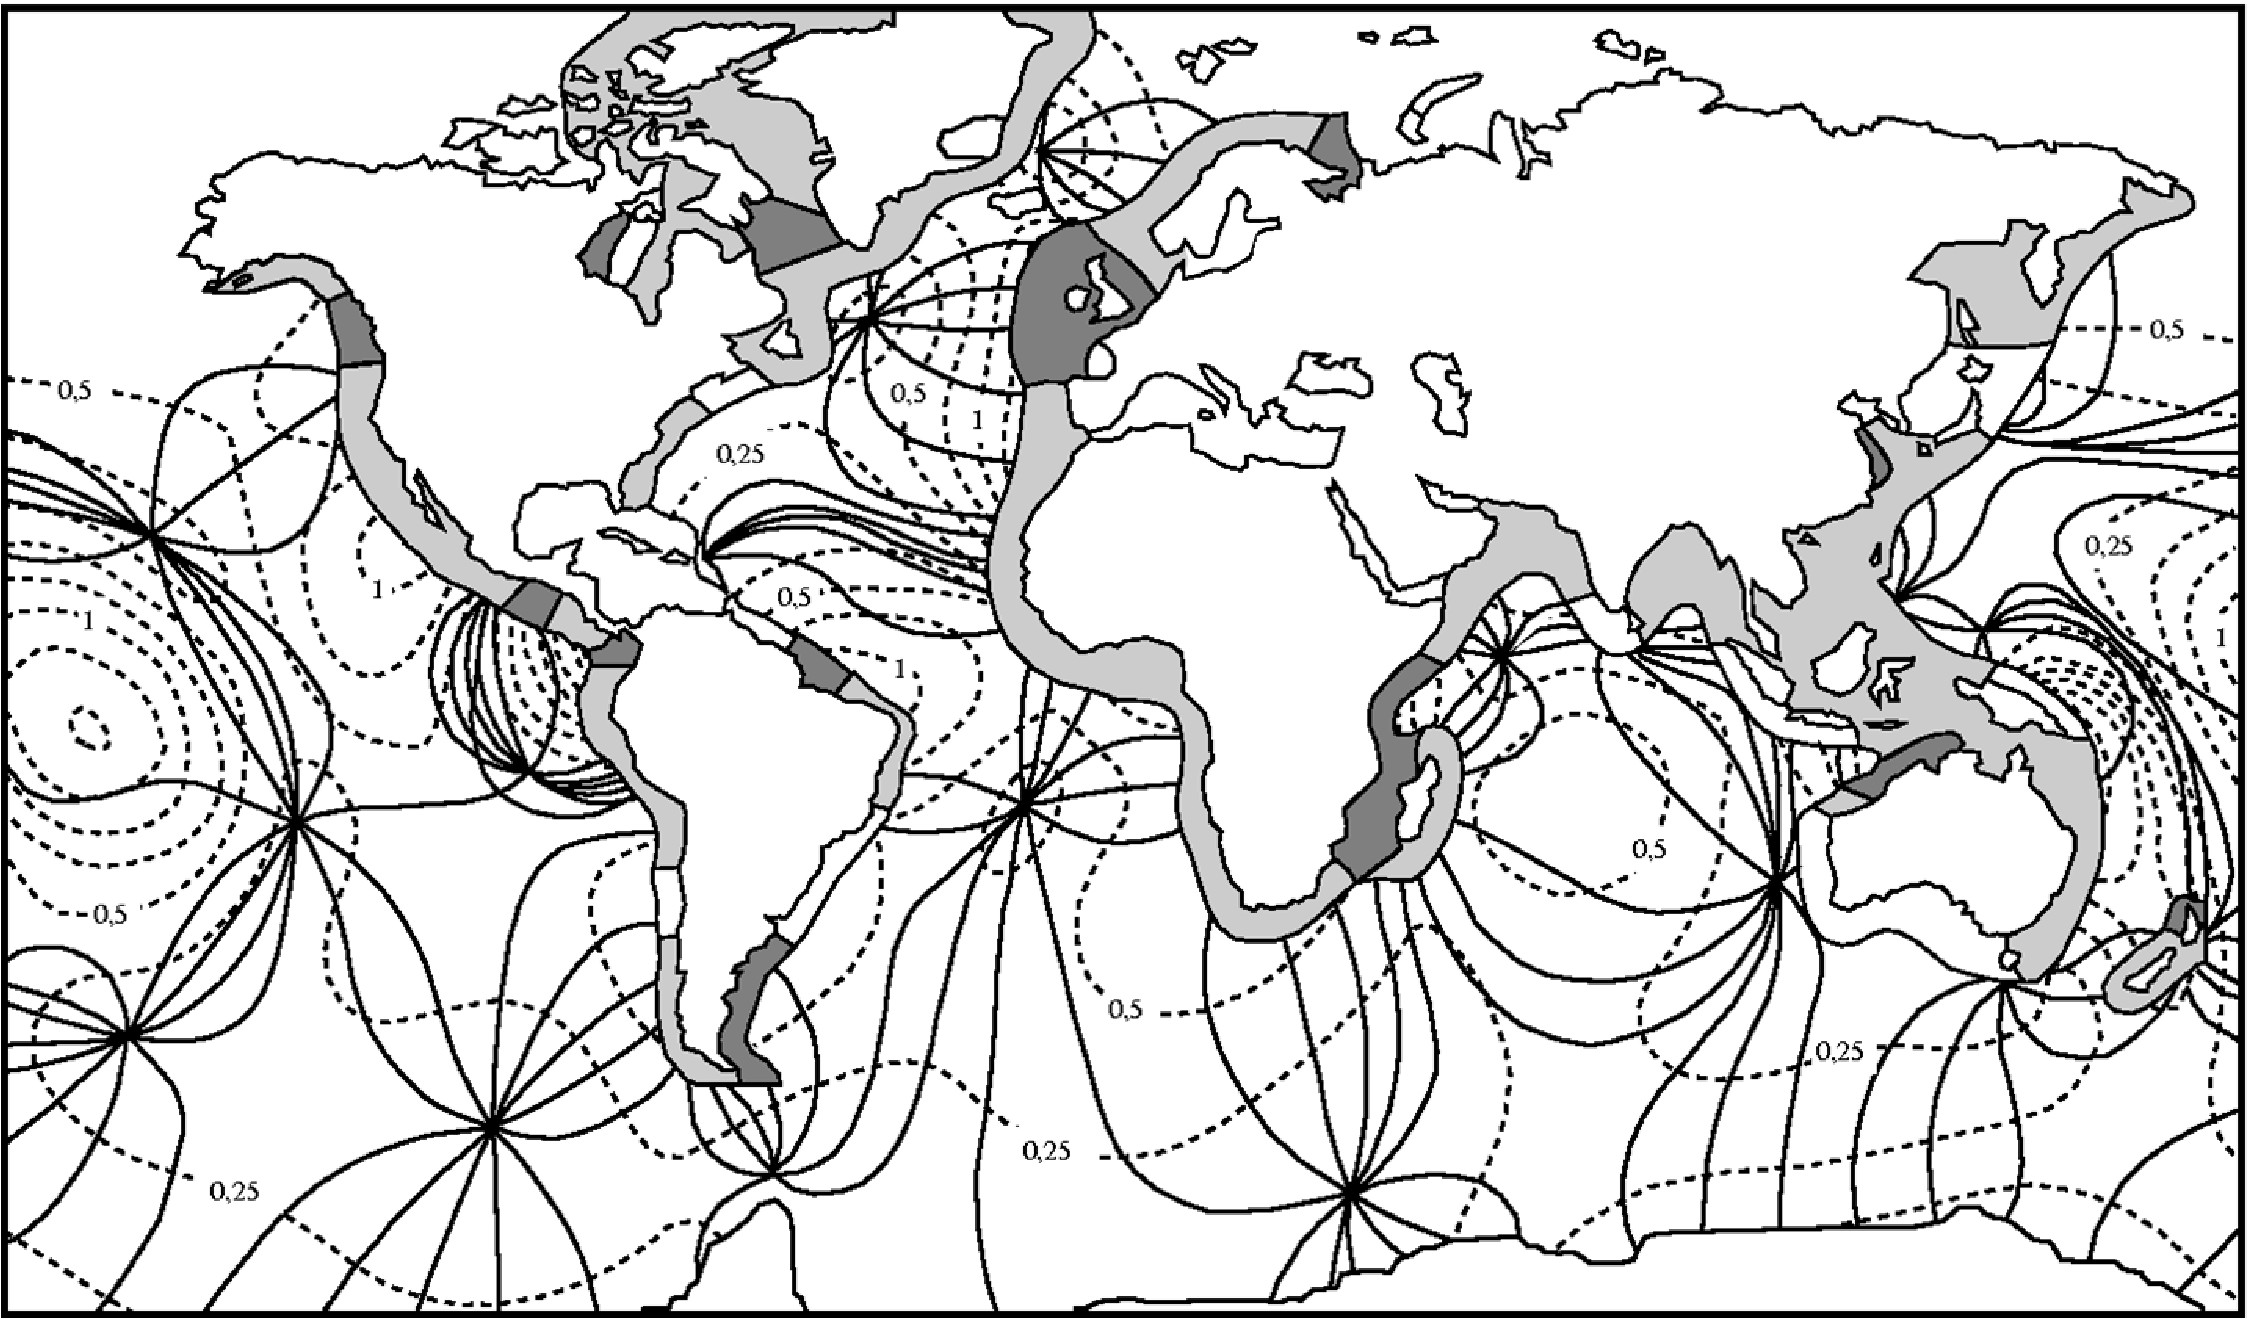
| 14:34, 22 March 2016 | Worldtides.jpeg (file) |  |
596 KB | Co-tidal lines (solid lines) and lines of equal amplitude (dashed lines, amplitude in meters) of the semidiurnal lunar M2-tide in the oceans. The tidal range along the coast is indicated in dark for tidal ranges larger than 4 m, in grey for tidal range... | 1 |
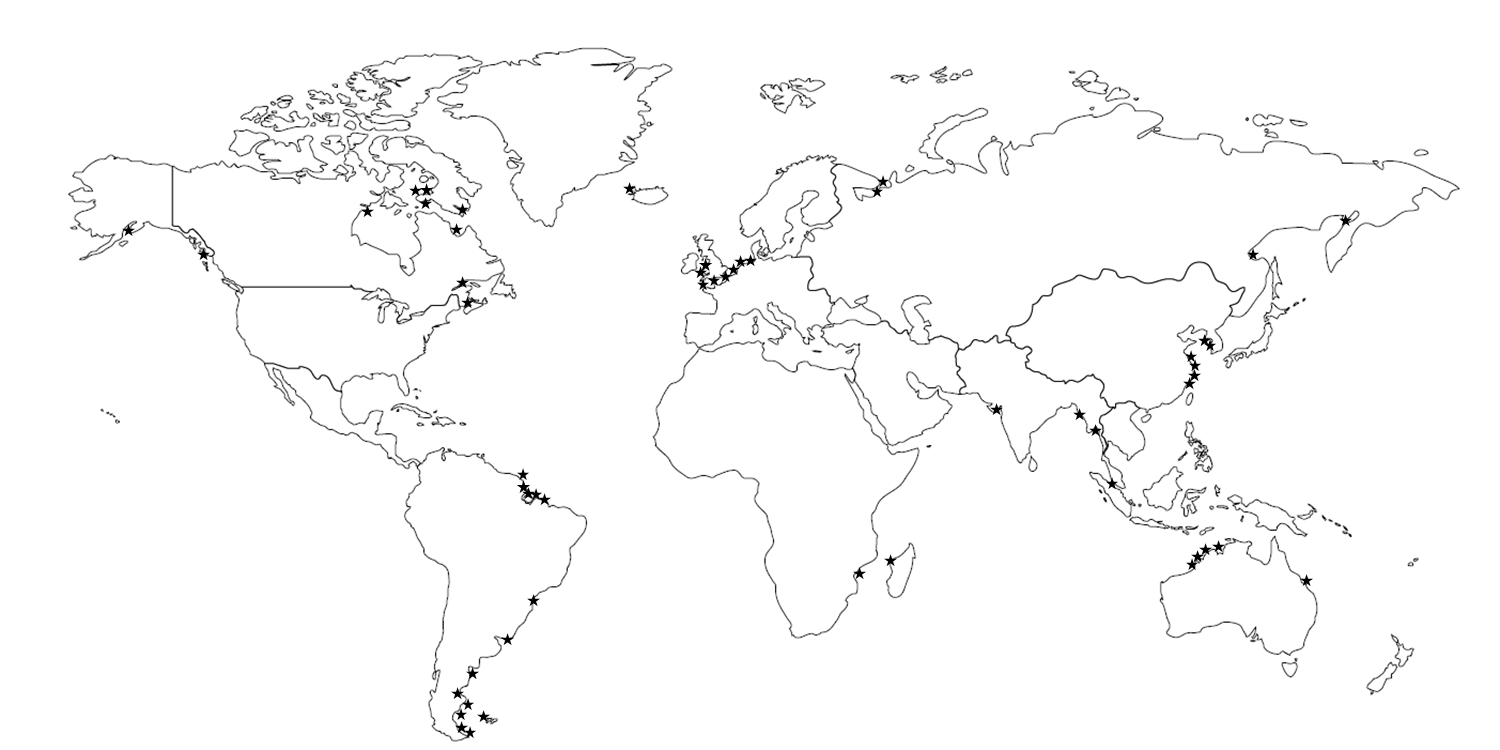
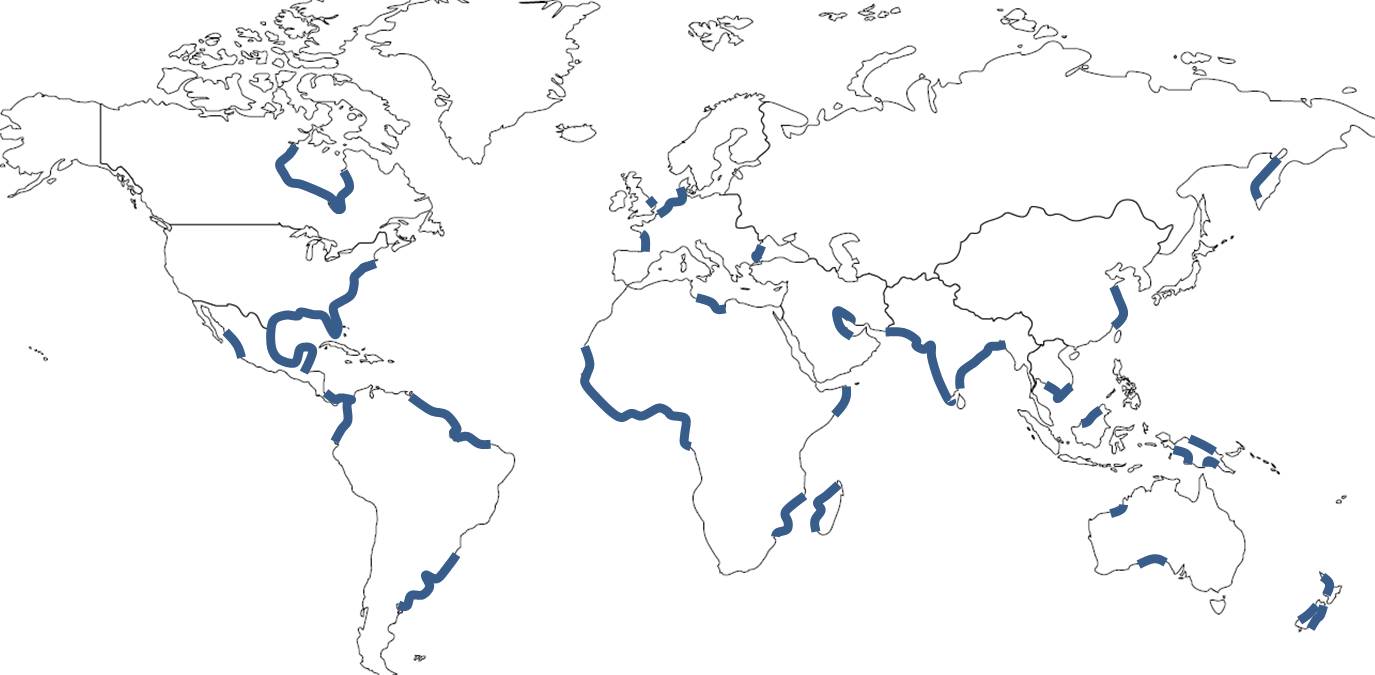
| 14:32, 28 September 2018 | WorldmapM4.png (file) |  |
150 KB | Coastal zones with important quarter-diurnal tide. | 1 |
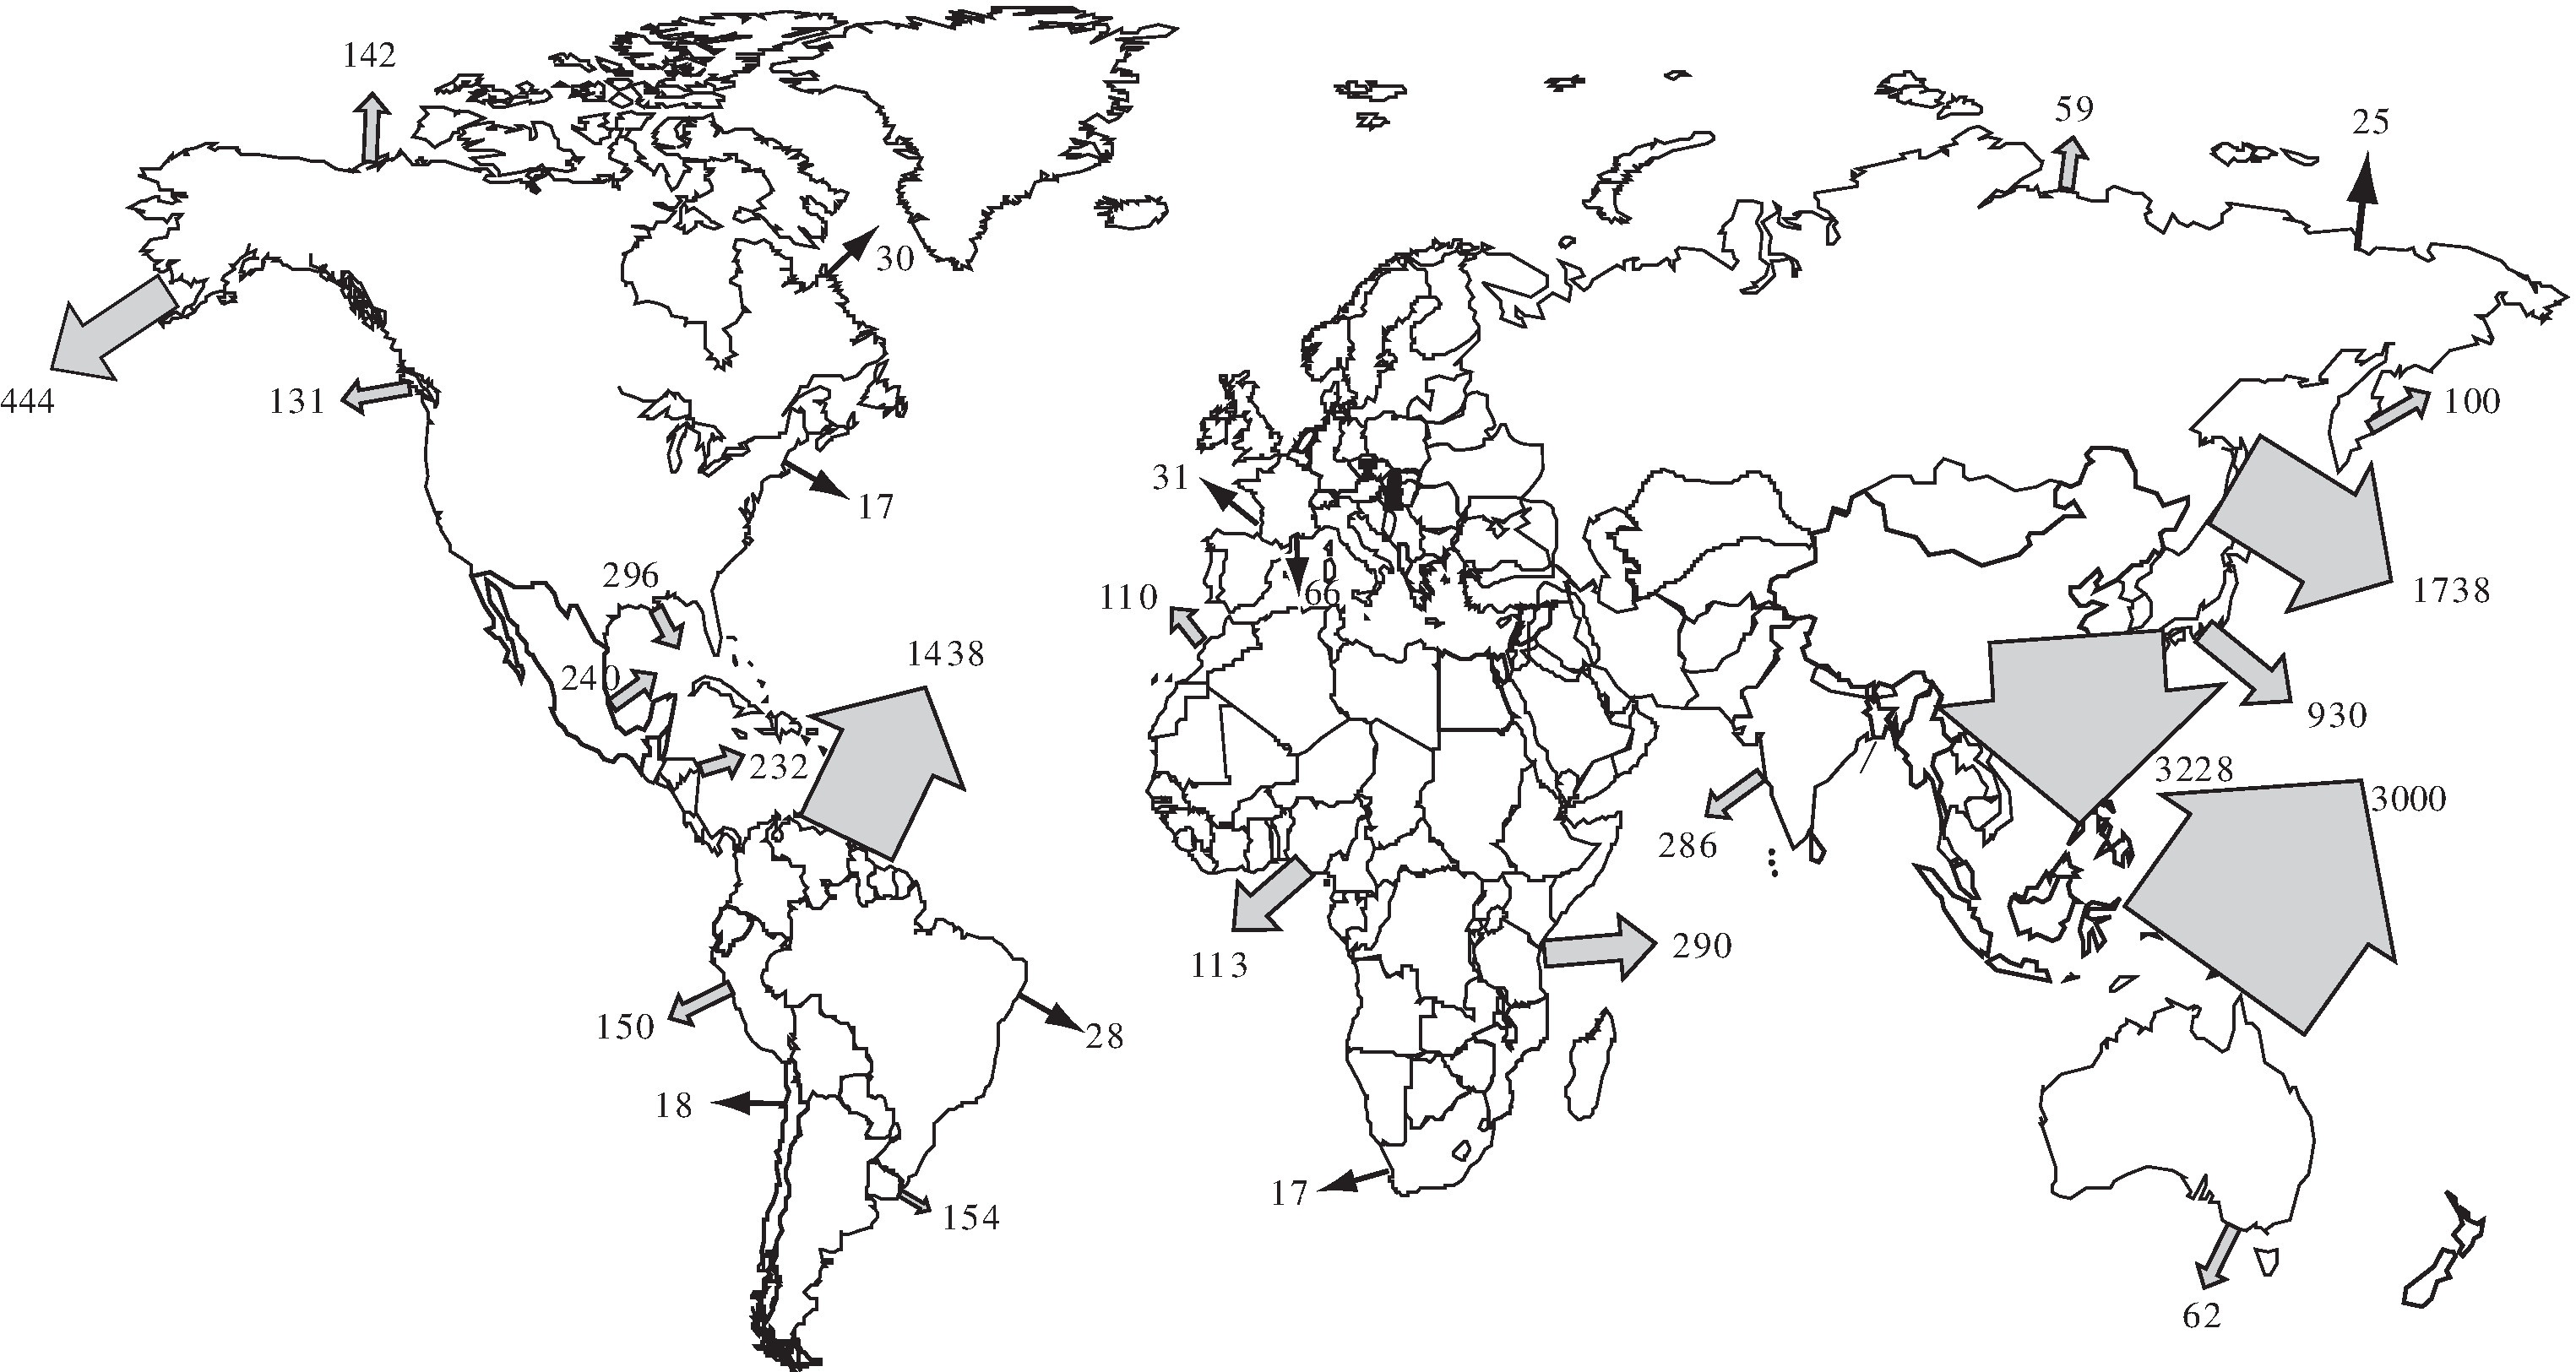
| 12:03, 14 November 2018 | Worlderosion.jpg (file) |  |
543 KB | Annual discharge of sediments from world's catchment basins. Redrawn after Milliman and Meade (1983). | 1 |
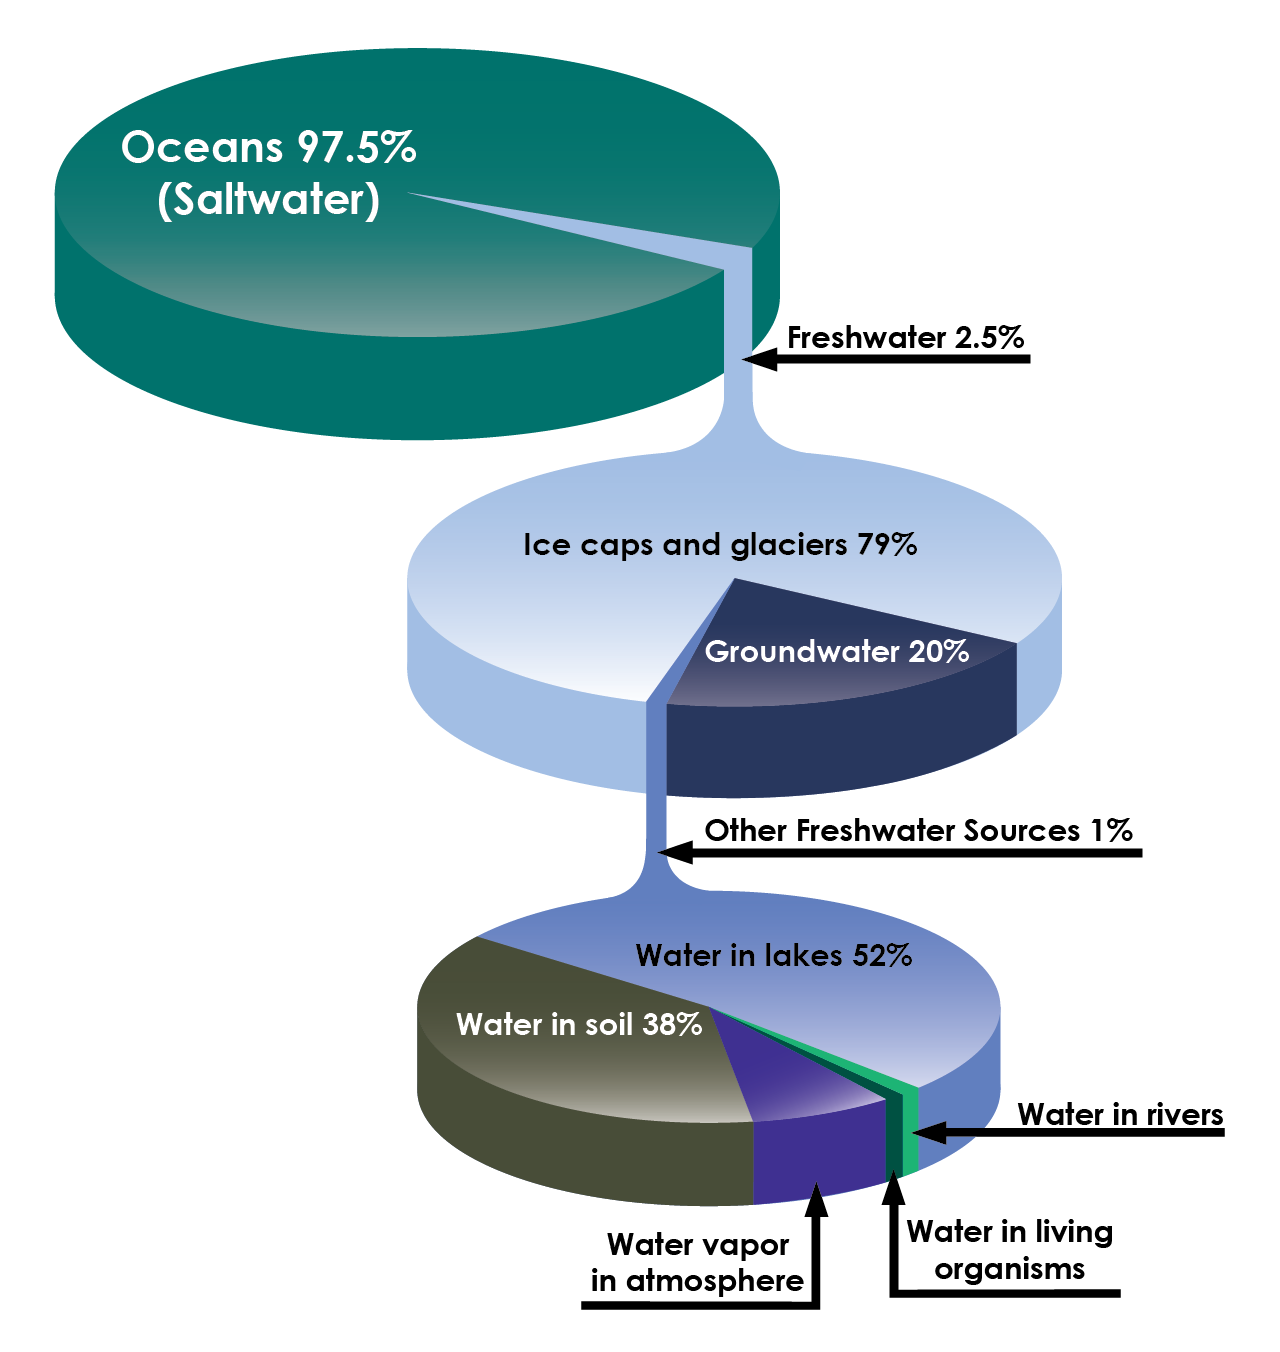
| 11:24, 5 April 2020 | WorldWaterDistribution.png (file) |  |
92 KB | World water distribution. Credit: pbslearningmedia. | 1 |
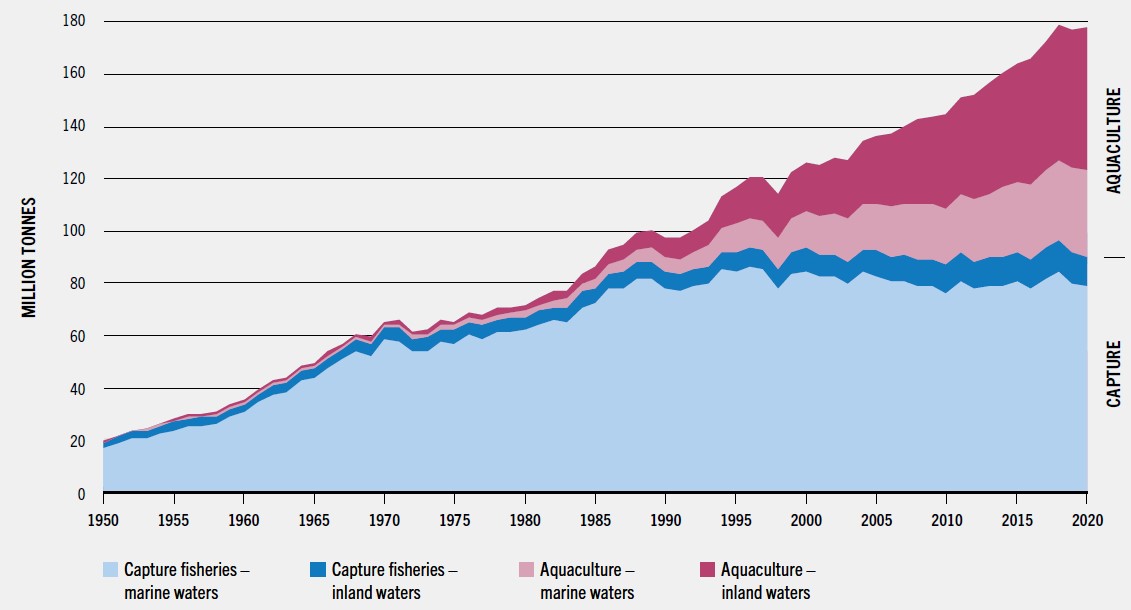
| 11:09, 20 August 2023 | WorldProdFisheryAquacultureFAO2020.jpg (file) |  |
73 KB | Global trends in different types of fisheries, showing the fast increase of aquaculture. In 2020 the total aquaculture production (algae mariculture excluded) exceeded the production of capture (wild) fisheries. The production of inland aquaculture was... | 1 |
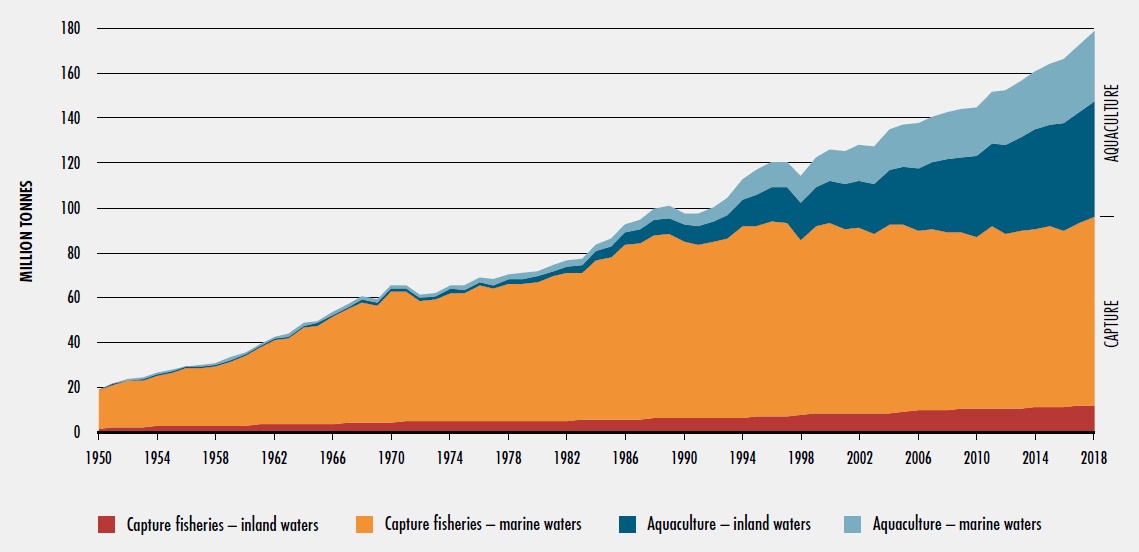
| 17:26, 27 December 2020 | WorldProdFisheryAquacultureFAO.jpg (file) |  |
88 KB | Global trends in different types of fisheries. Source: FAO (2020) | 1 |
| 23:01, 4 November 2019 | WorldMapColdWaterCoralReef.jpg (file) |  |
164 KB | World map of cold water coral reefs (UNEP, 2003) | 1 |
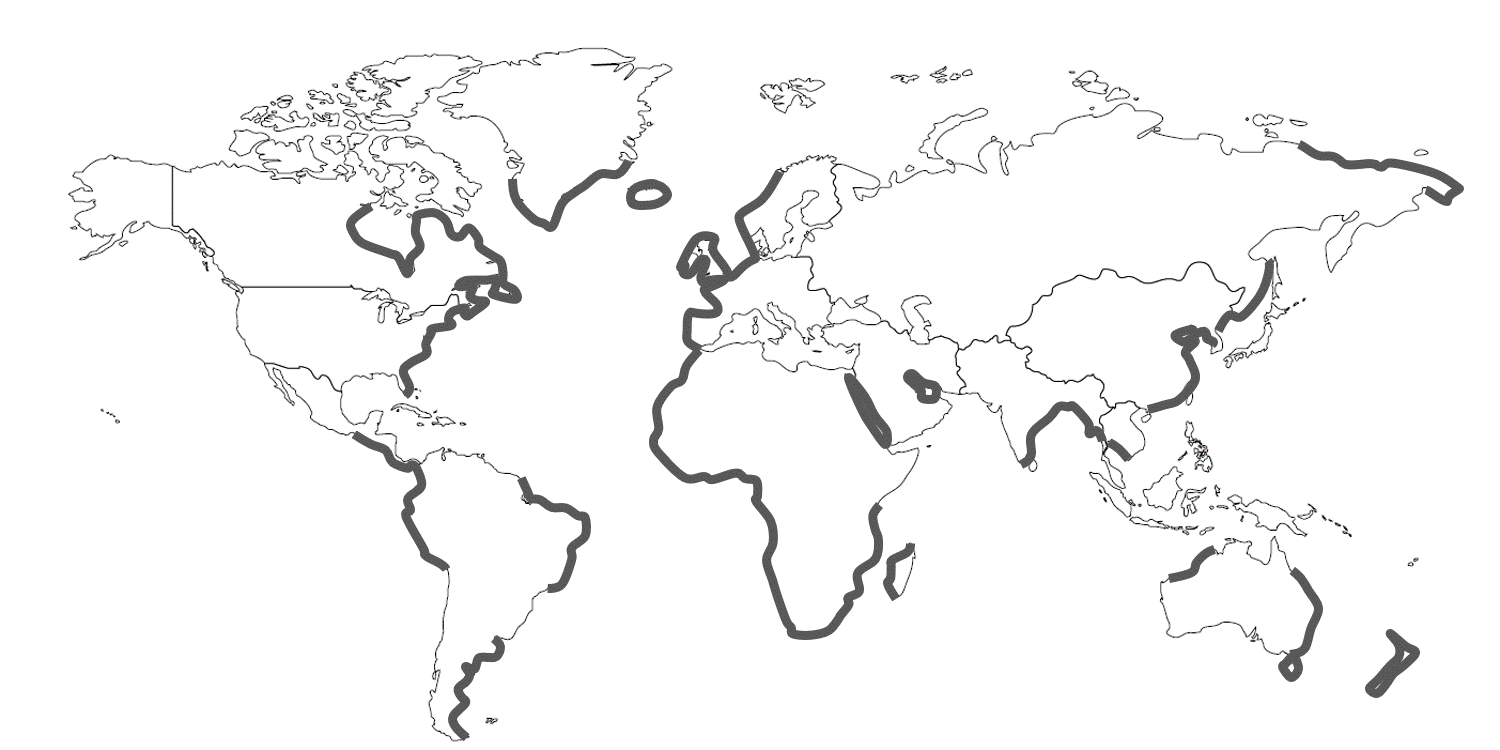
| 17:03, 6 July 2016 | WorldMacroTidalZones.jpg (file) |  |
71 KB | World map of macrotidal coastal zones | 1 |
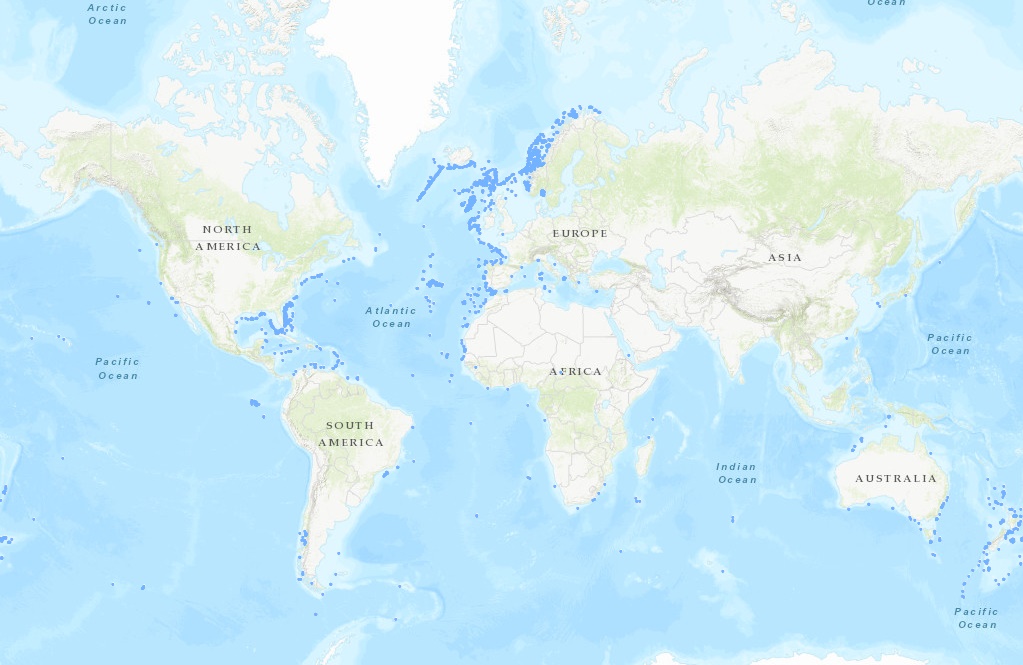
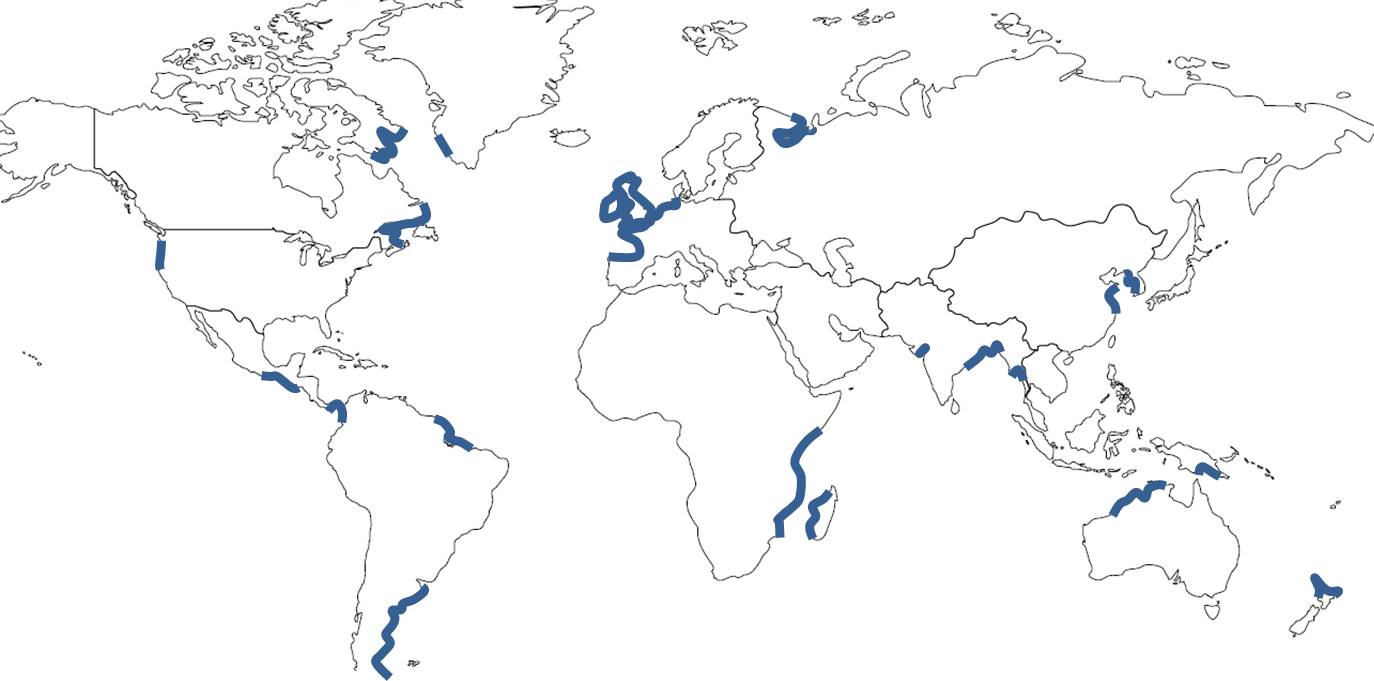
| 15:05, 30 August 2021 | WorldDuneMap.jpg (file) |  |
169 KB | World map of coastal zones where well-developed coastal dune belts occur. Adapted from Martinez and Psuty (2008) | 1 |
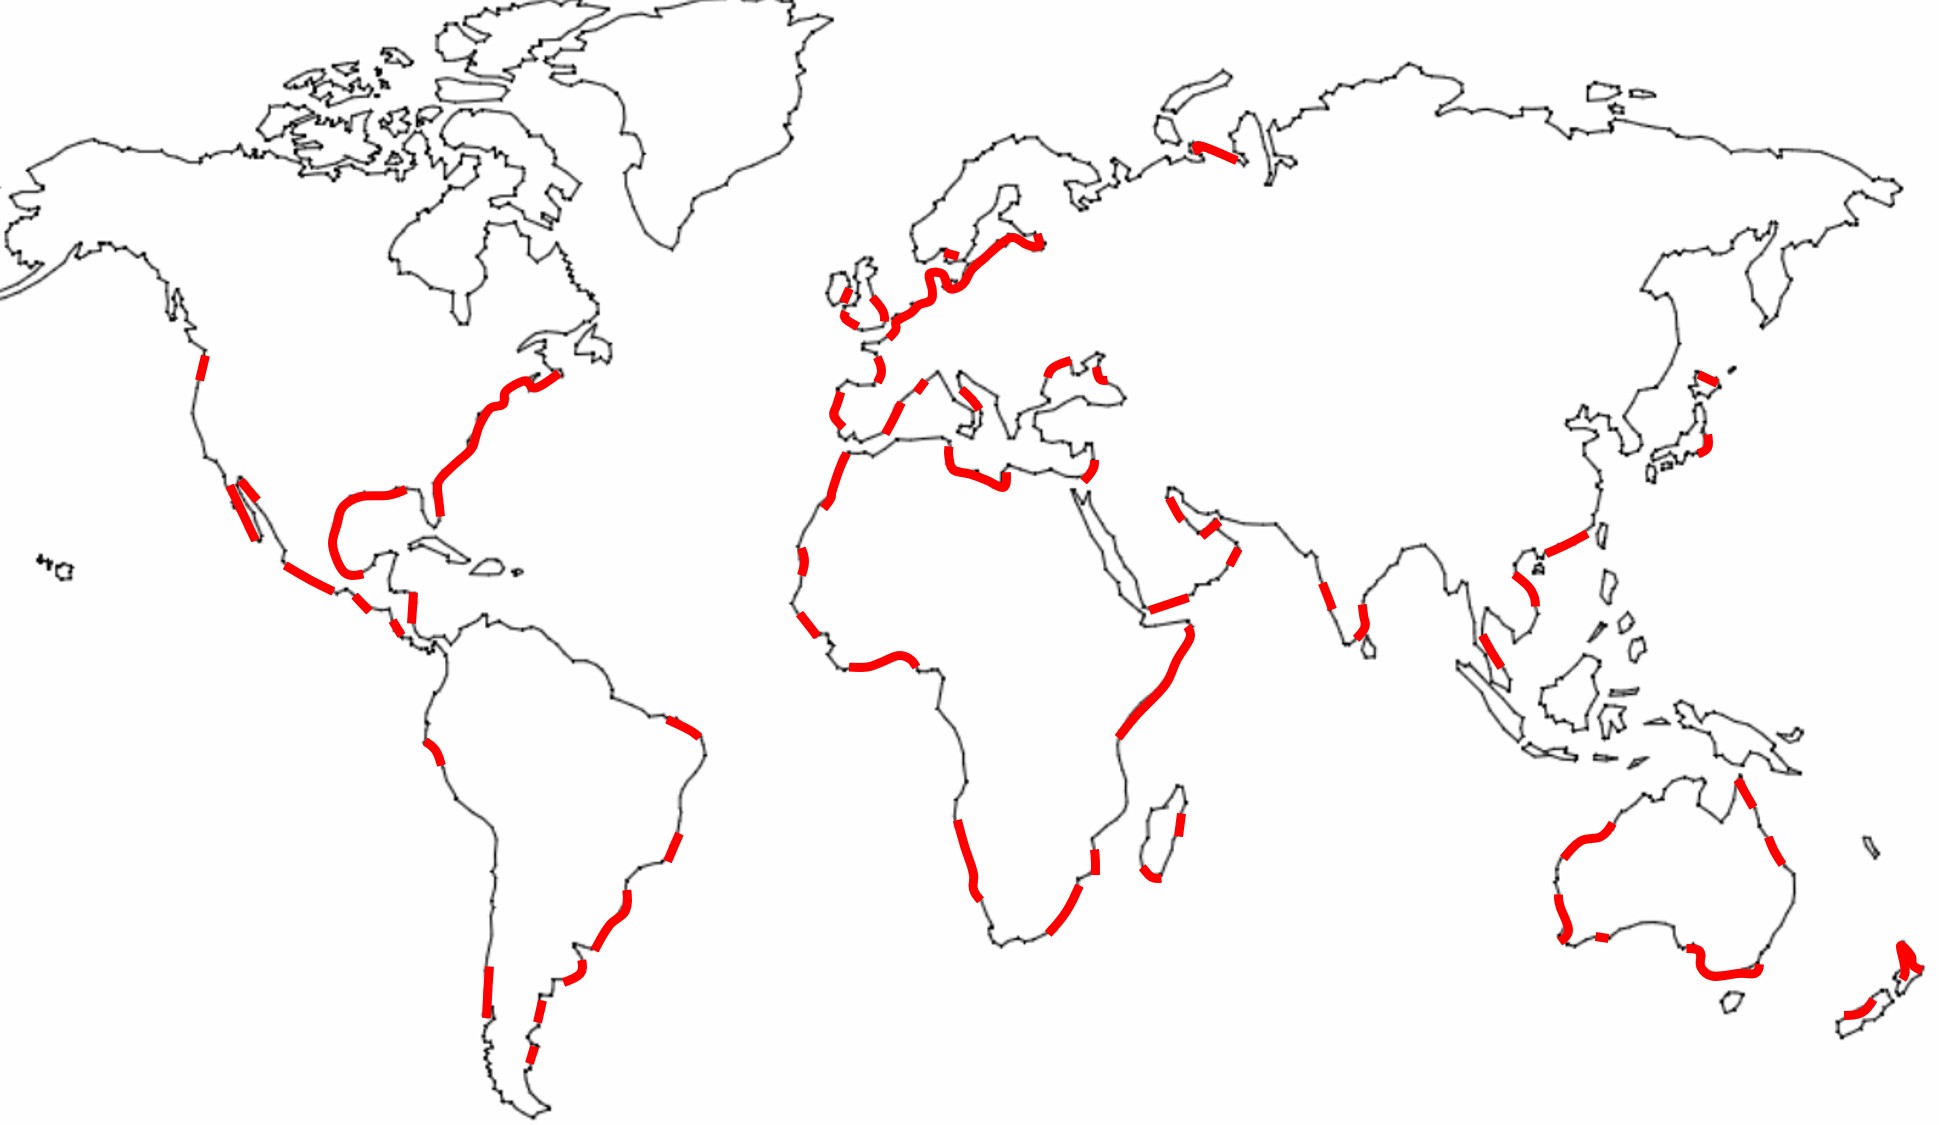
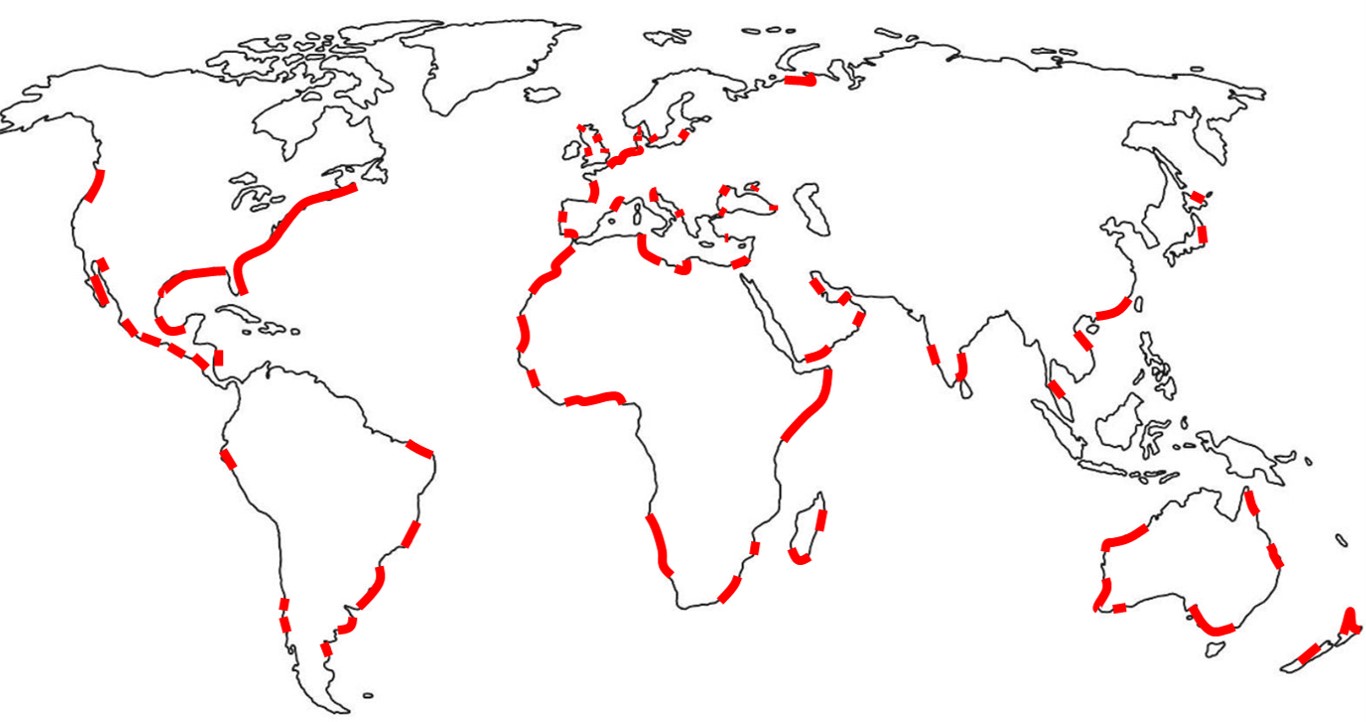
| 23:00, 26 April 2020 | WorldDuneDistribution.jpg (file) |  |
112 KB | World distribution of coastal dunes. Adapted from Martinez et al. (2003) | 2 |
| 16:54, 26 September 2018 | WorldDomM2.png (file) |  |
76 KB | Coastal zones with dominant semi-diurnal tide. | 1 |
| 17:02, 6 July 2016 | WorldCoastalPlains.jpeg (file) |  |
73 KB | World map of coastal plains | 1 |
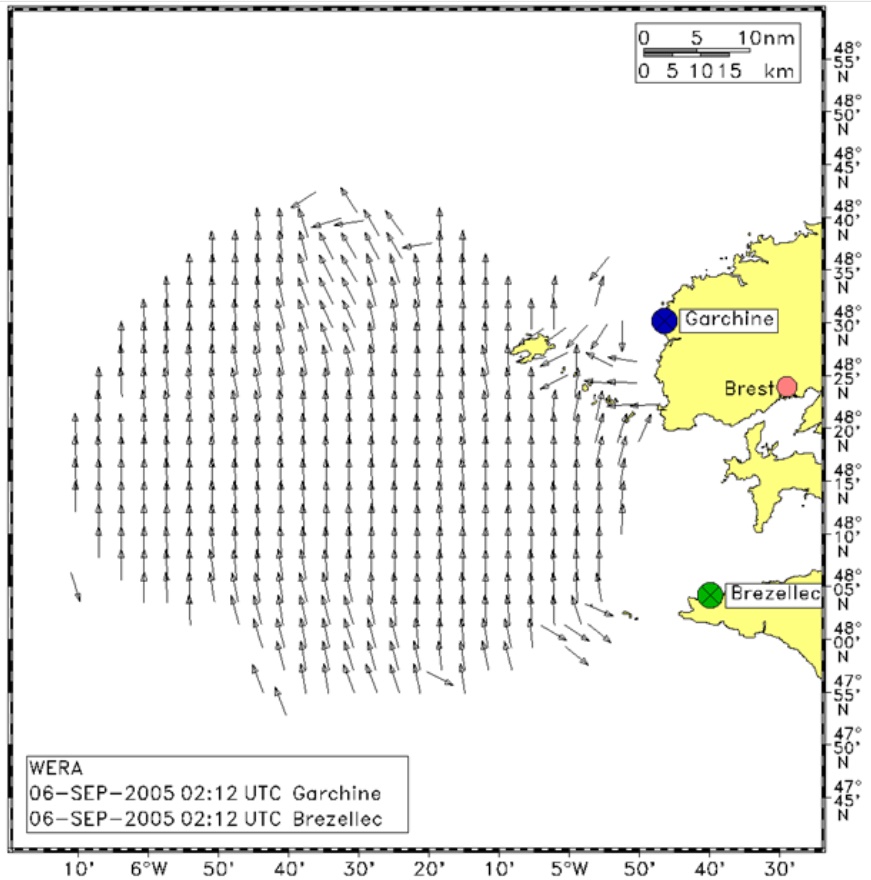
| 21:06, 24 October 2020 | WindFieldOffBrest.jpg (file) |  |
178 KB | Example of measured wind direction measured by HF radar of the coast of Brest (France). | 1 |
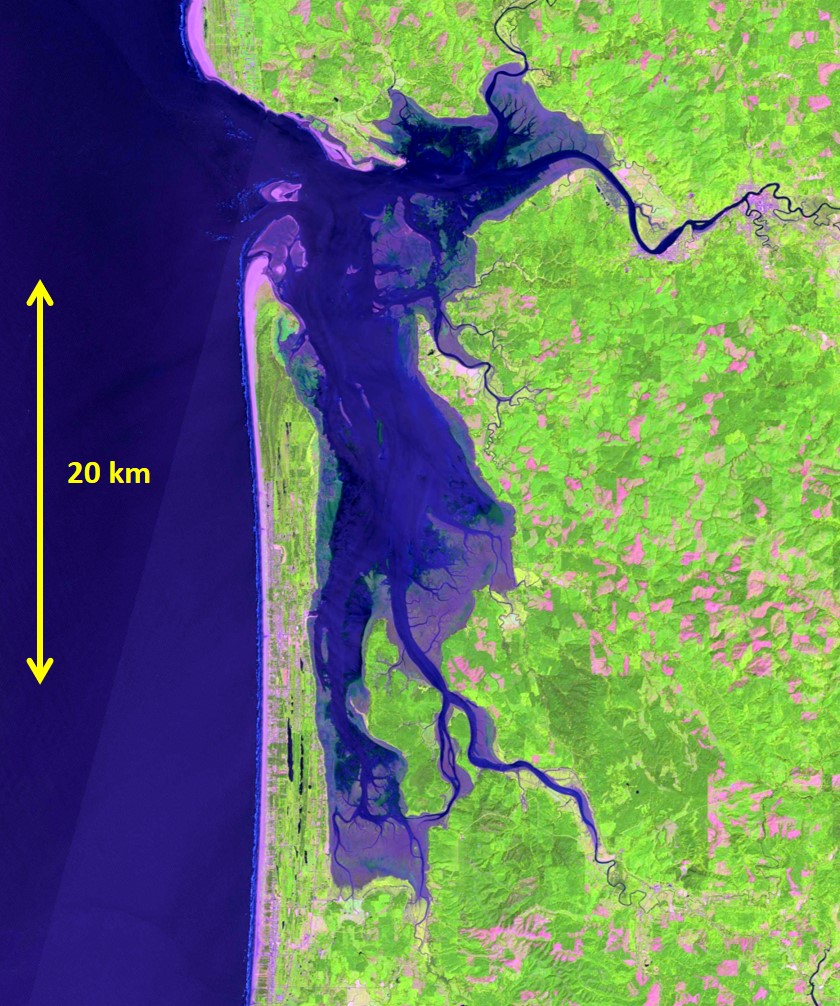
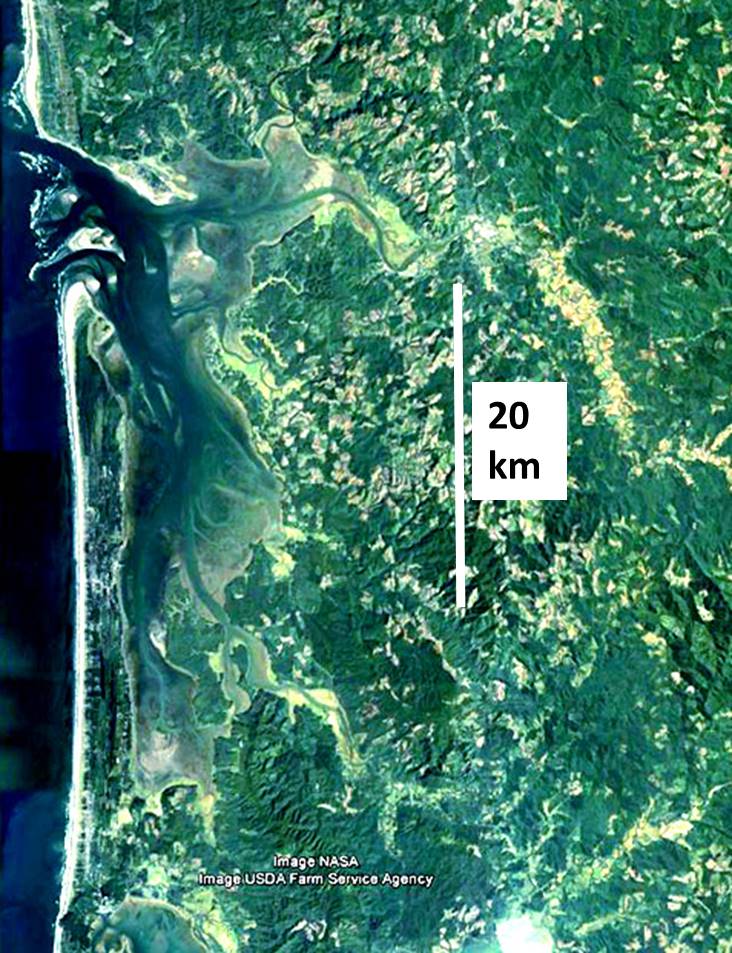
| 21:44, 25 November 2018 | WillapaBaySentinelJuly2018.jpg (file) |  |
261 KB | Willapa Bay on the US Pacific coast (Sentinel image). | 1 |
| 17:16, 6 July 2016 | Willapa.jpg (file) |  |
151 KB | Willapa Bay | 1 |
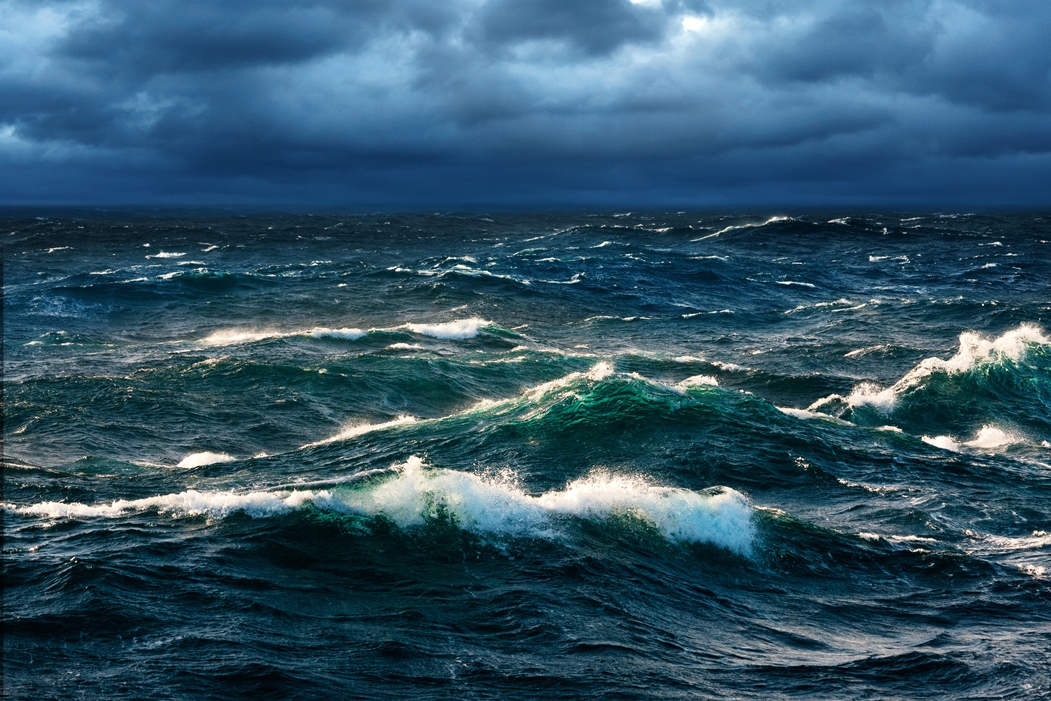
| 15:55, 1 September 2020 | WhiteCappedWaves.jpg (file) |  |
483 KB | White-capped waves. Credit recon.sccf.org | 1 |
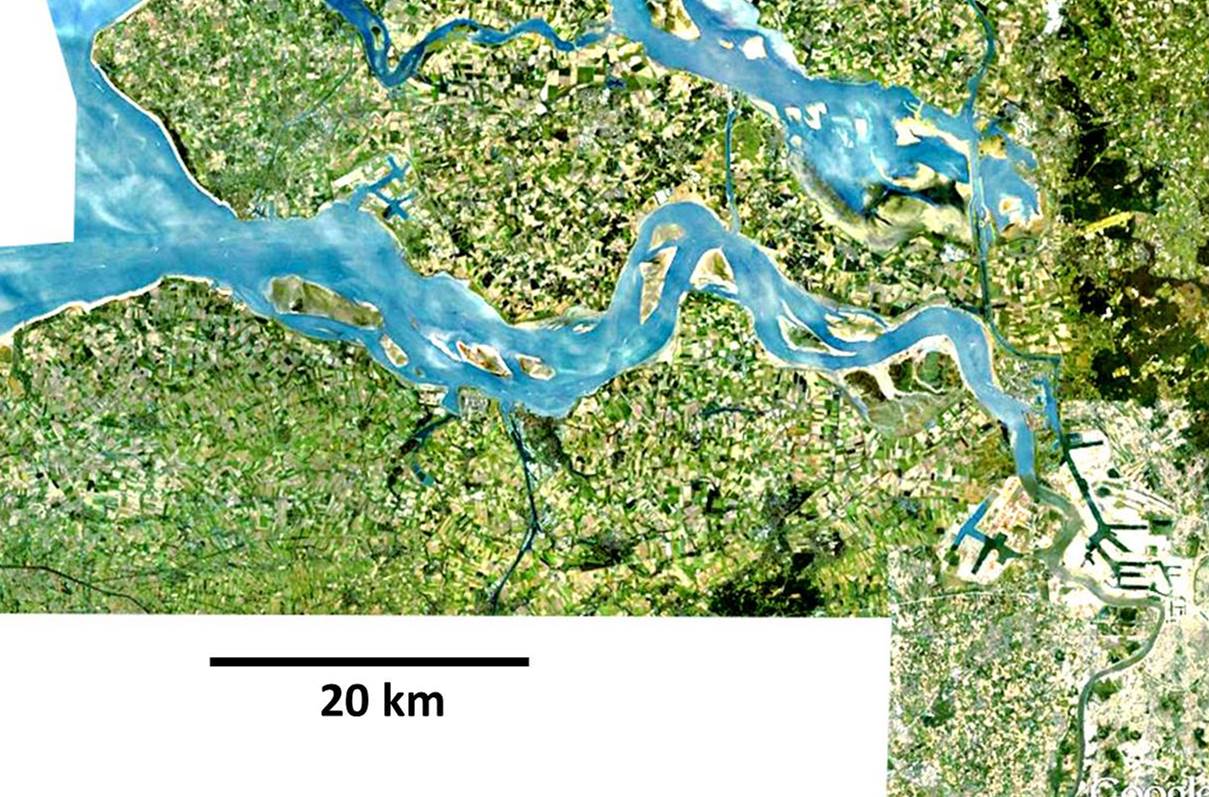
| 22:49, 26 November 2018 | WesterscheldeSentinelMarch2016.jpg (file) |  |
474 KB | Western Scheldt and Scheldt estuary, Netherlands, Belgium (Sentinel image). | 1 |
| 08:57, 7 July 2016 | WesternScheldt.jpg (file) |  |
214 KB | Western Scheldt and Scheldt estuary | 2 |
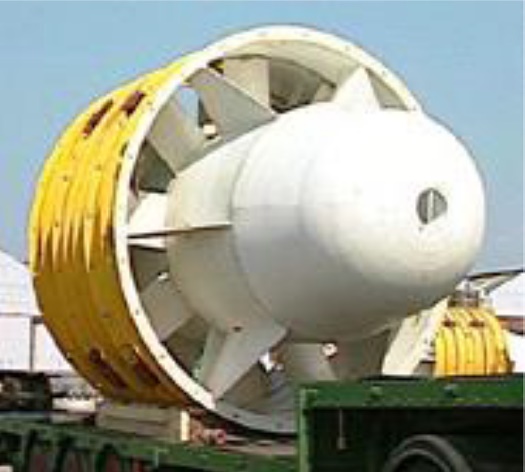
| 22:01, 8 January 2021 | WellsTurbine.jpg (file) |  |
60 KB | Prototype of a Wells turbine. | 1 |
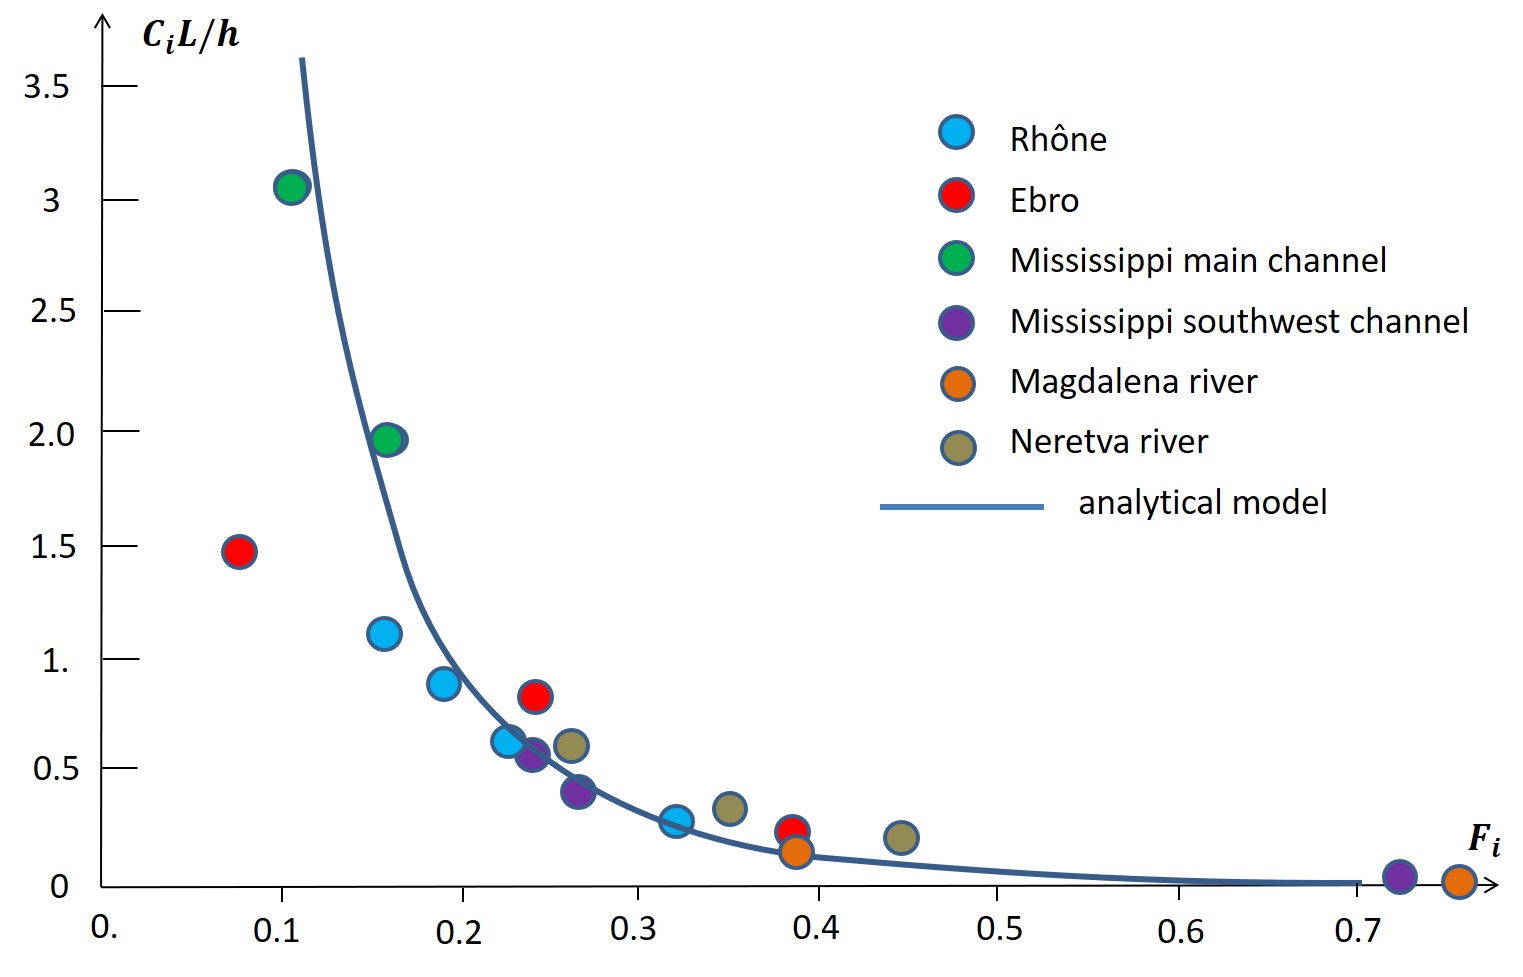
| 17:33, 7 December 2022 | WedgeLengthObsMod6.jpg (file) |  |
109 KB | Dimensionless salt wedge length for a prismatic estuary according to the analytic model and observed salt wedge lengths in the Rhône, Ebro, the Mississippi, Magdalena and Neretva estuaries at different discharges (corresponding to different internal r... | 1 |
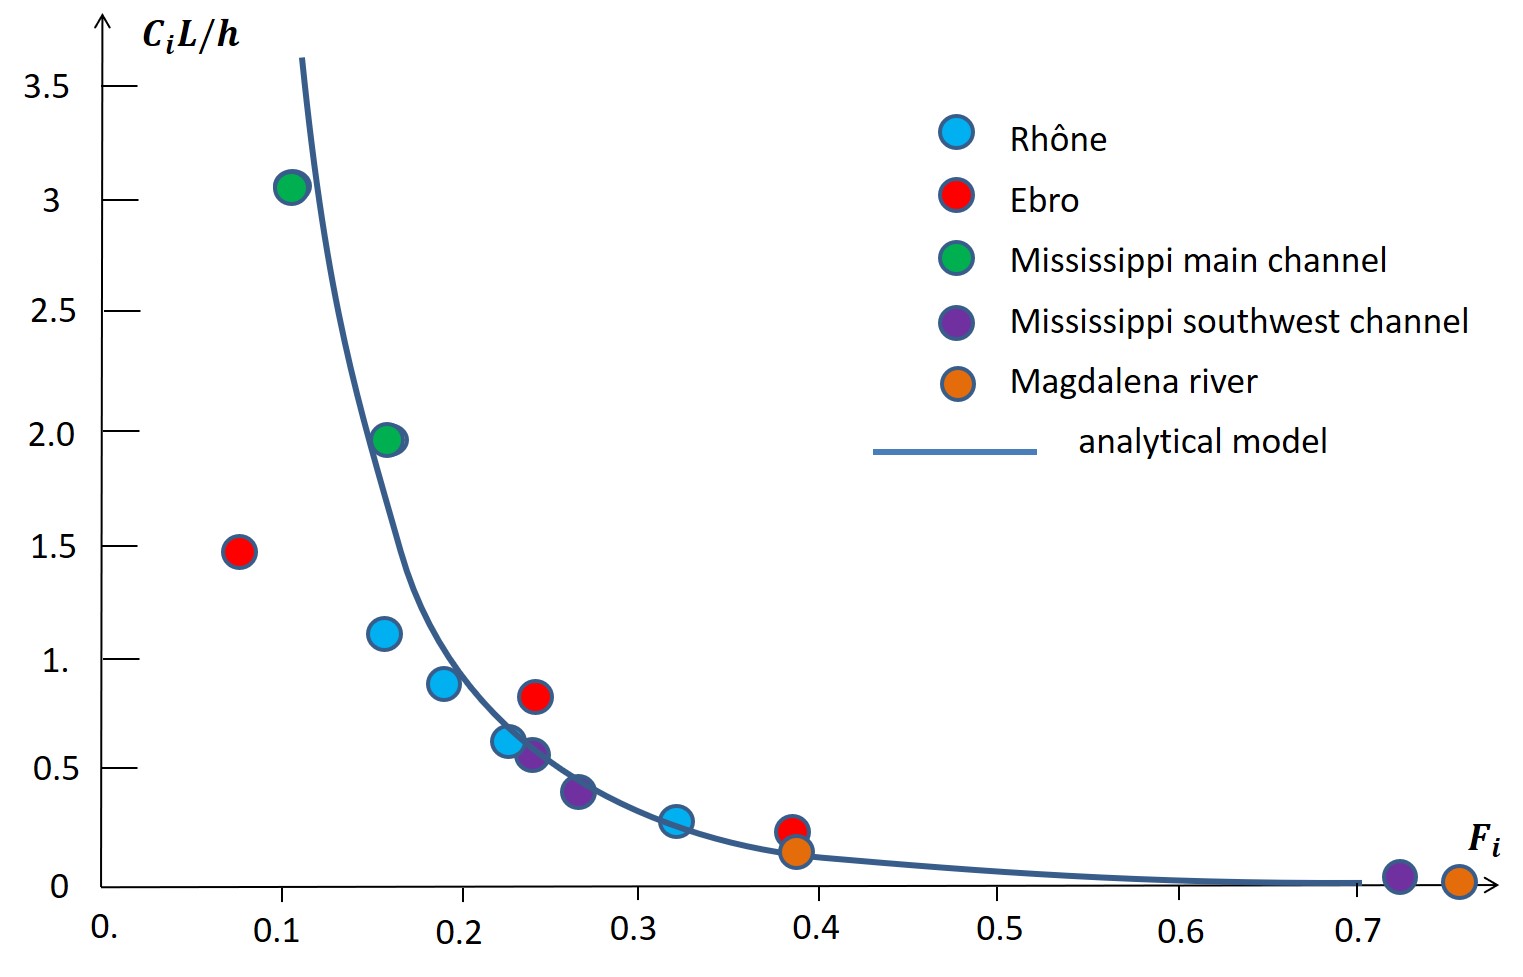
| 17:35, 14 November 2022 | WedgeLengthObsMod.jpg (file) |  |
102 KB | Dimensionless salt wedge length for a prismatic estuary and observed salt wedge lengths in the Rhône, Ebro, Mississippi and Magdalena estuaries at different discharges. | 2 |
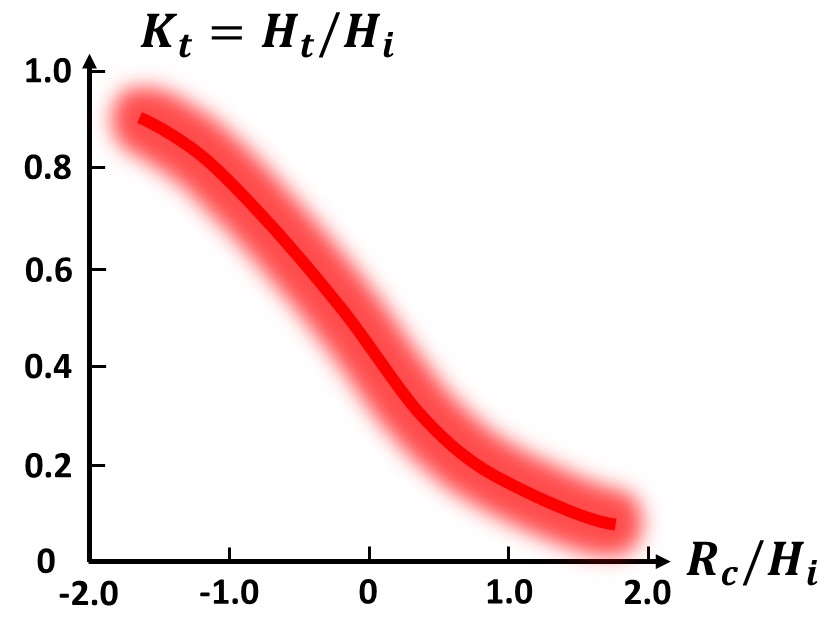
| 15:19, 4 July 2023 | WaveTransmissionGraph.jpg (file) | 44 KB | Graphical estimate of the wave transmission coefficient as a function of the relative freeboard, based on laboratory data. The red glow of the curve indicates the level of accuracy. | 1 | |
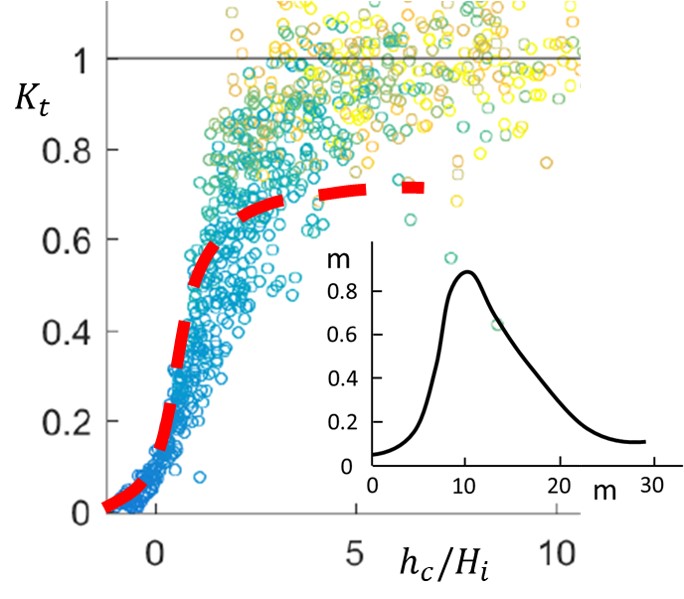
| 16:12, 31 March 2024 | WaveTransmissionEasternScheldtOysterReef.jpg (file) | 68 KB | Comparison of Eq. (1) (red dashed line) with the wave transmission coefficient measured (blue/green/yellow dots)on an oyster reef in the Eastern Scheldt (Netherlands). Insert: Shape of the oyster reef. | 1 | |
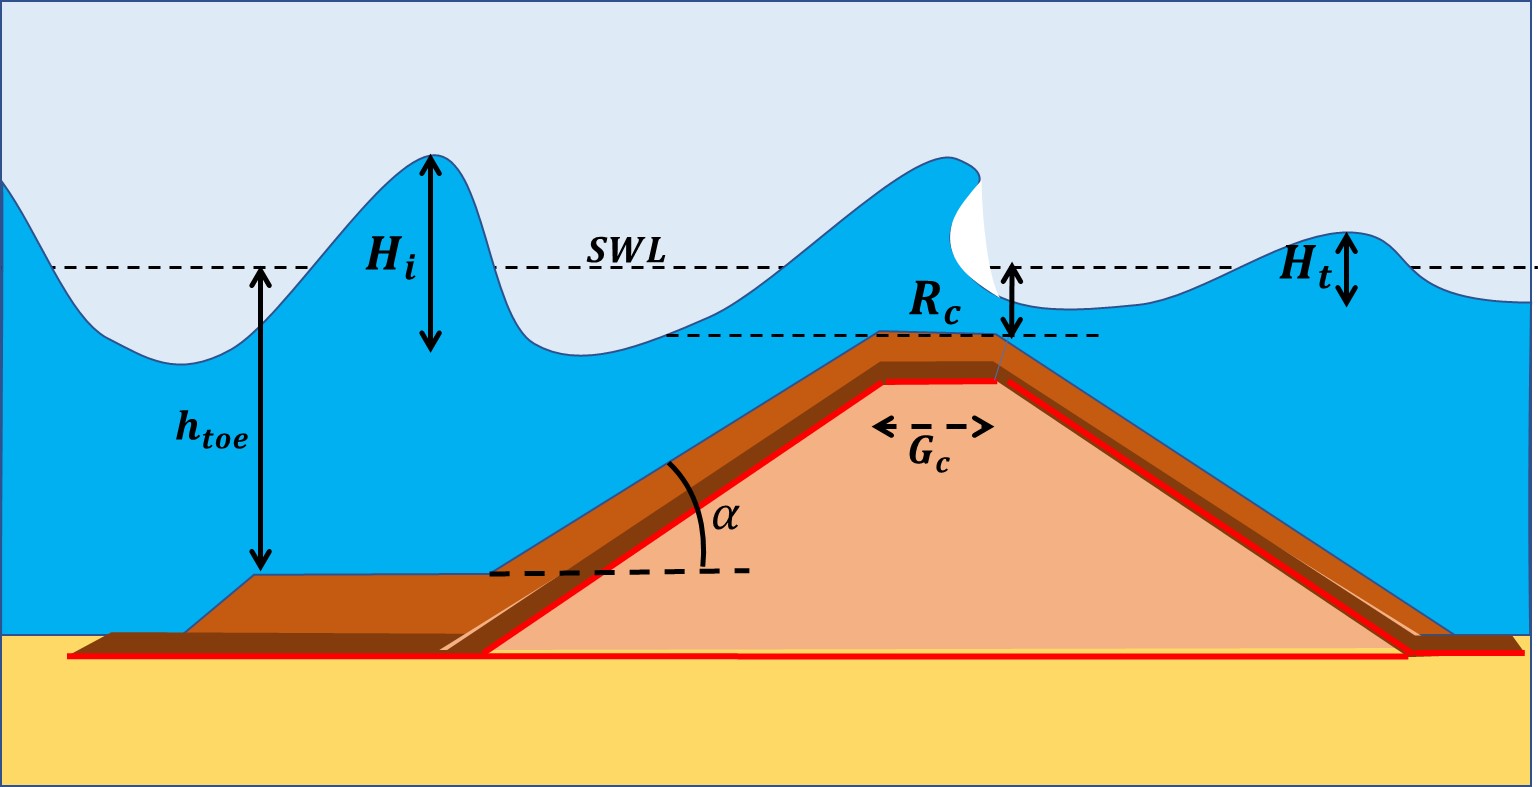
| 23:03, 15 May 2023 | WaveTransmission.jpg (file) | 99 KB | Wave transmission over a low-crested breakwater and mathematical symbols. | 1 | |
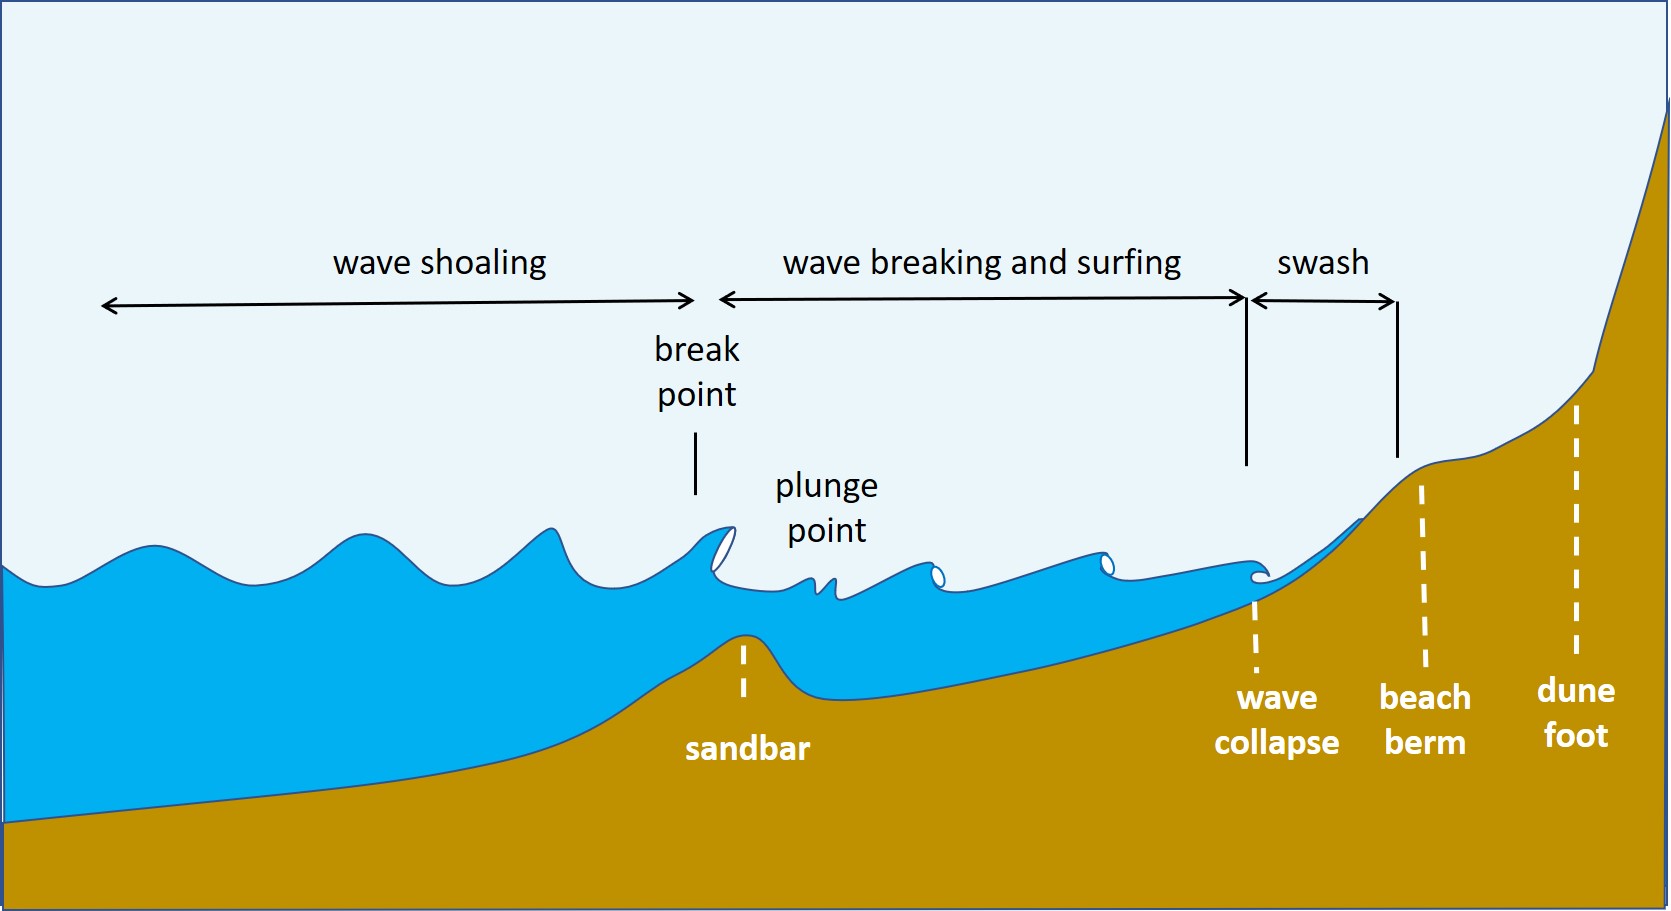
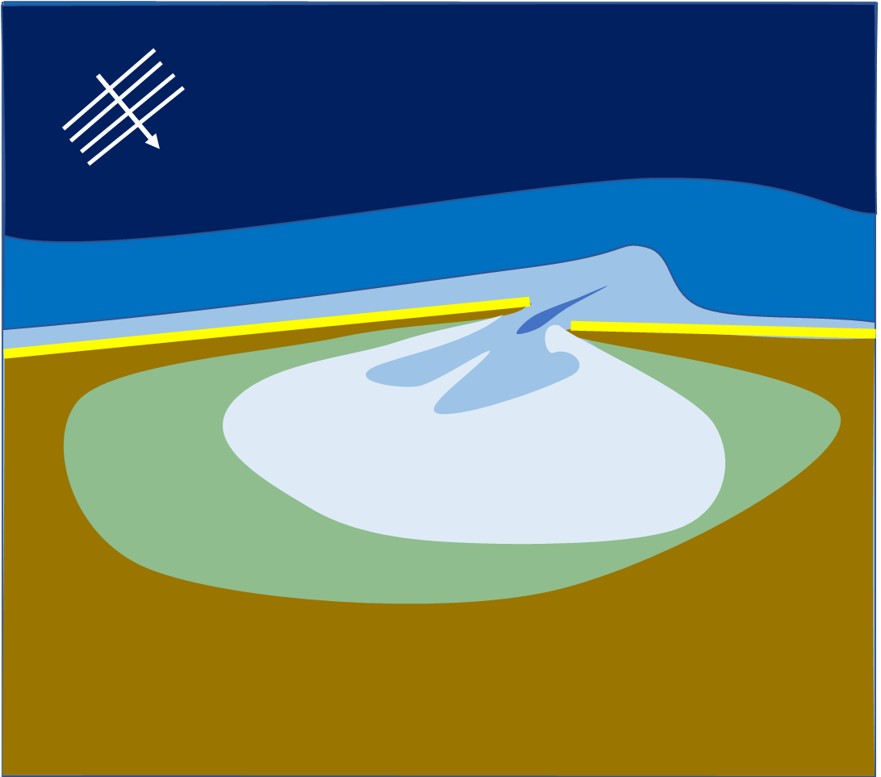
| 15:12, 31 March 2021 | WaveTransformation.jpg (file) | 106 KB | Wave transformation in the nearshore zone. | 1 | |
| 17:03, 15 January 2024 | WaveTideSpitEstuary.jpg (file) |  |
57 KB | Schematic plan view of a wave- and tide-dominated estuary (highly oblique wave incidence). | 1 |
| 19:30, 18 February 2023 | WaveTideEstuary.jpg (file) |  |
62 KB | Schematic plan view of a wave- and tide-dominated estuary. | 1 |
| 17:04, 15 January 2024 | WaveTideBarrierIslandsEstuary.jpg (file) |  |
62 KB | Schematic plan view of a wave- and tide-dominated estuary with barrier islands (close-to-normal wave incidence). | 1 |
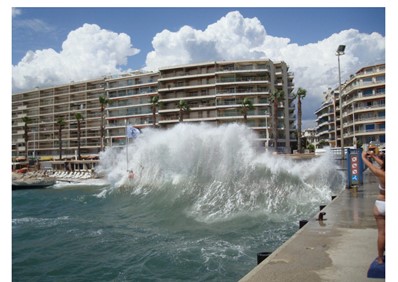
| 18:39, 29 December 2022 | WaveSplash.jpg (file) |  |
37 KB | Wave splashing on a vertical wall. Photo Niels Mejlhede Jensen. | 1 |
| 17:06, 15 January 2024 | WaveSpitLagoon.jpg (file) |  |
51 KB | Schematic plan view of a wave-dominated estuary/lagoon semi-closed by a sand spit (highly oblique wave incidence). | 1 |
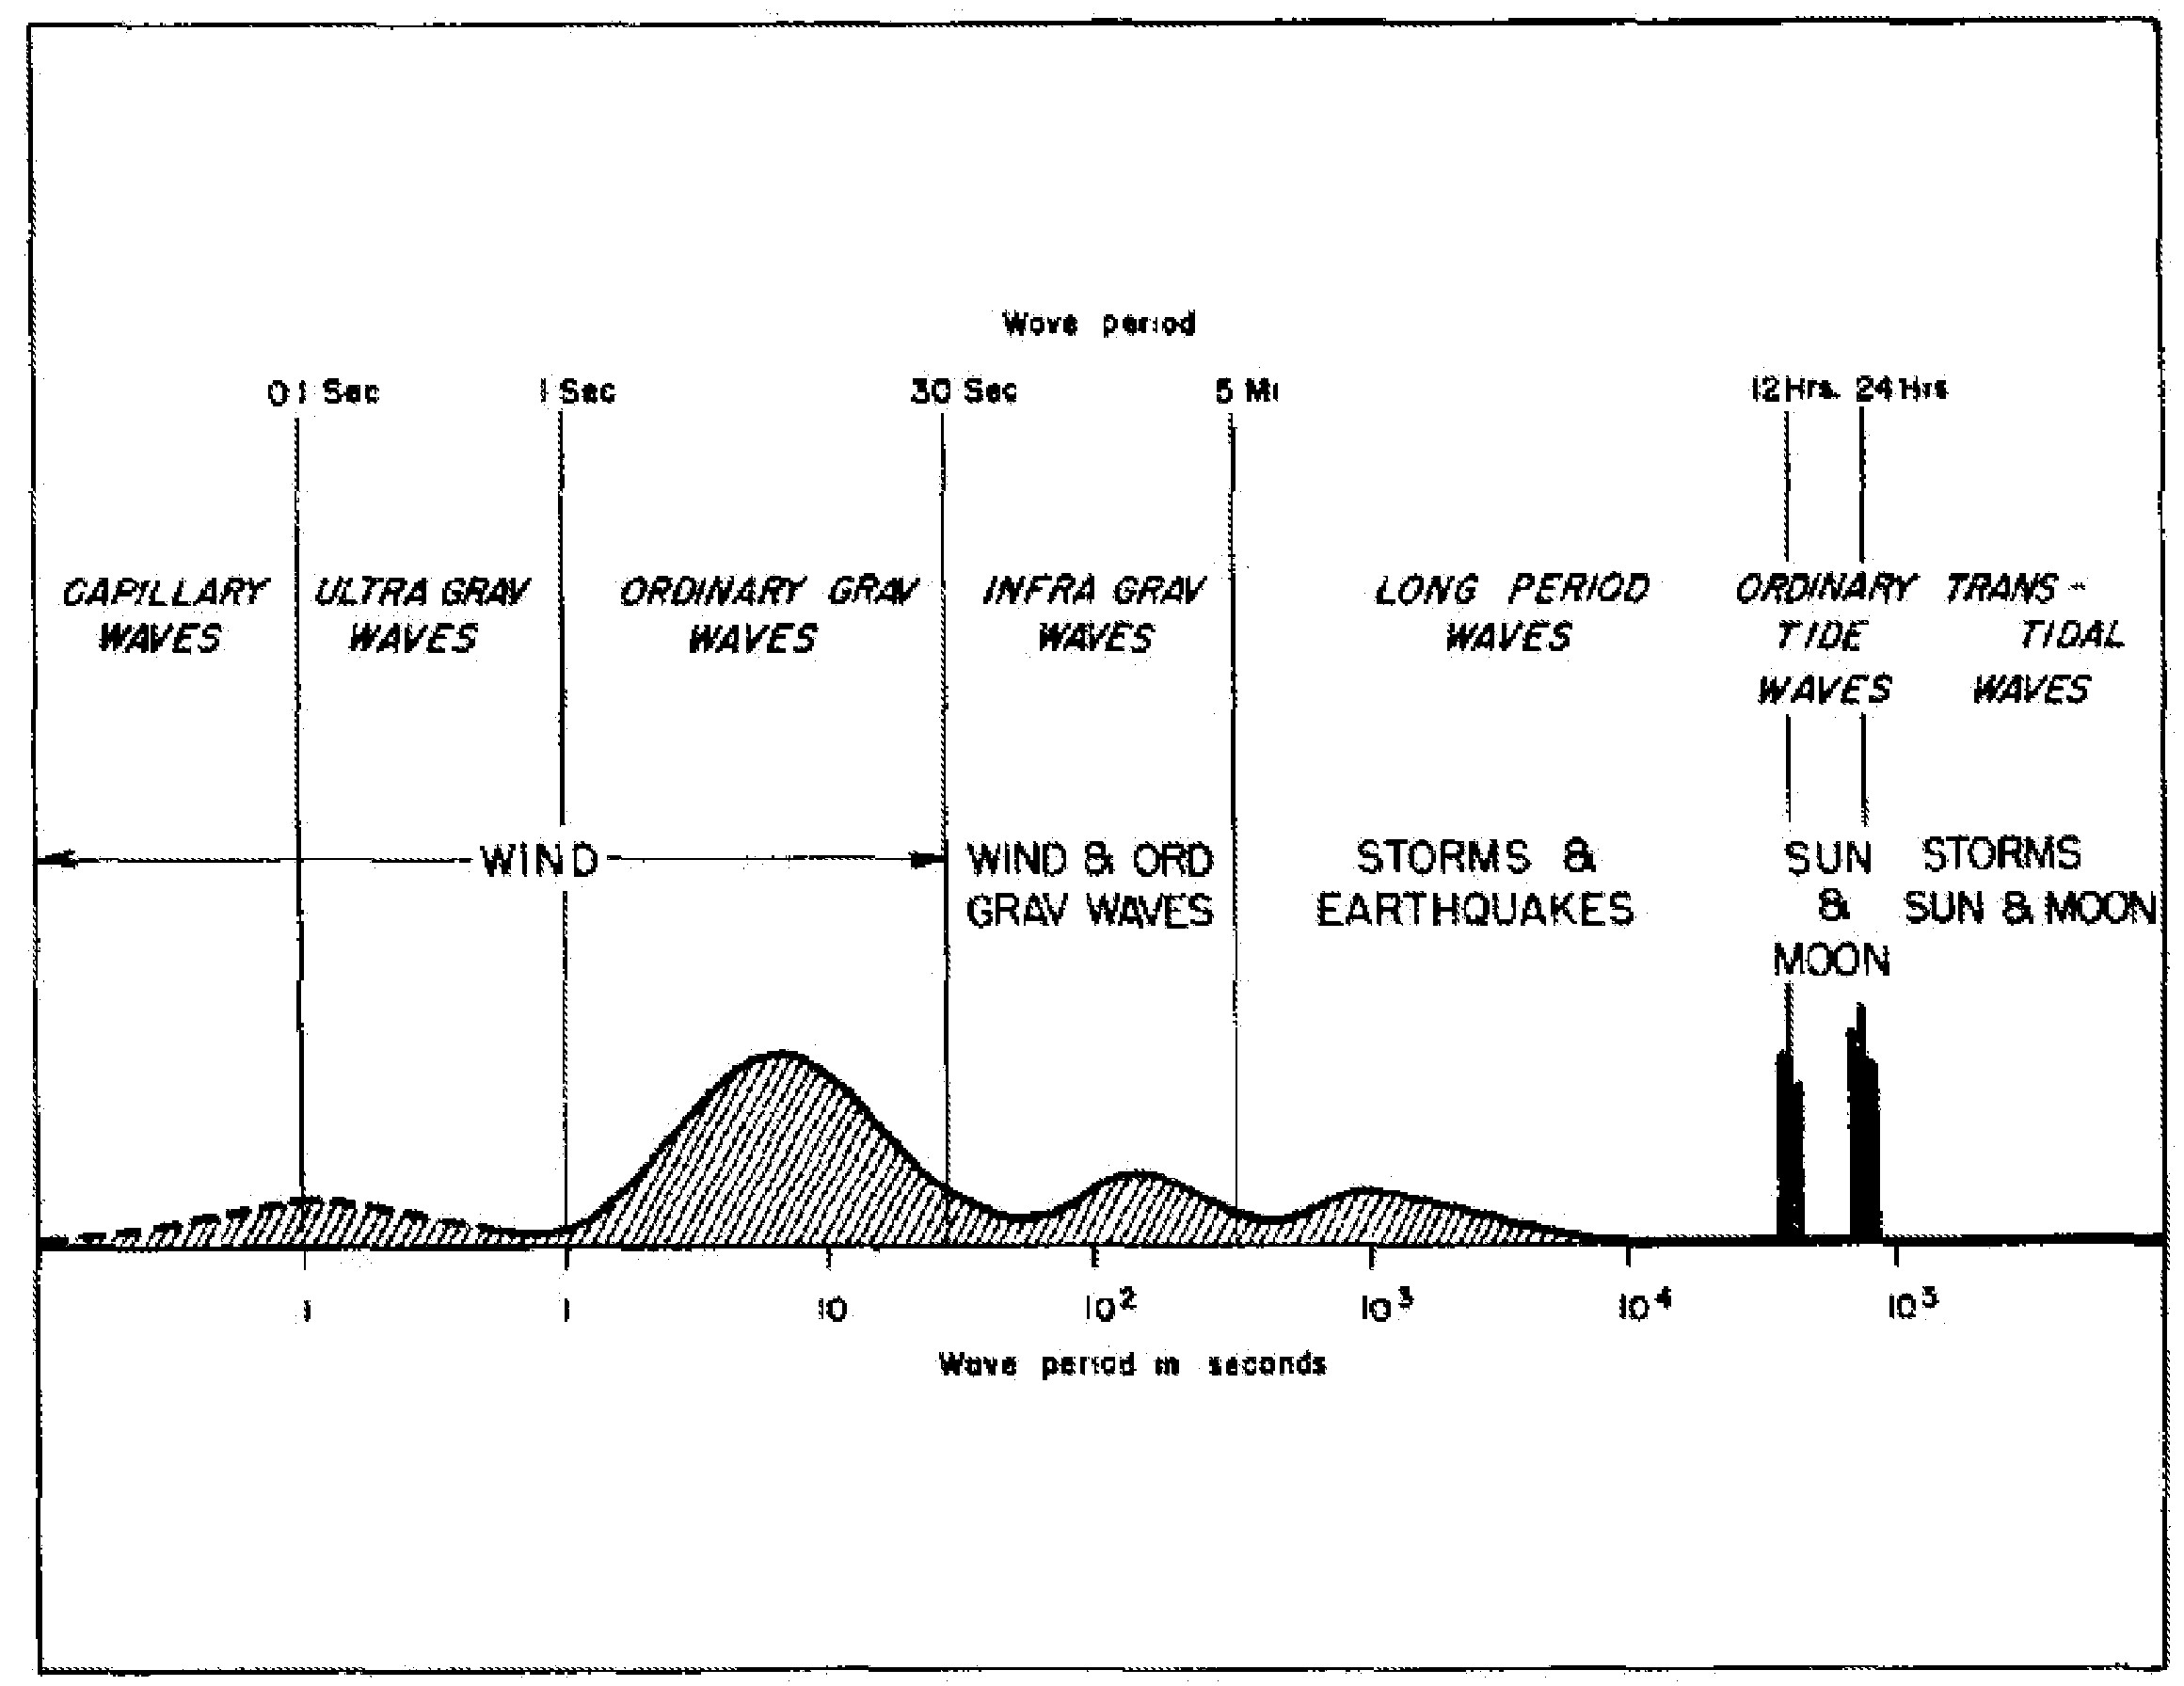
| 21:11, 20 January 2017 | WaveSpectrum.jpg (file) |  |
344 KB | Classification of ocean waves according to wave period. | 1 |
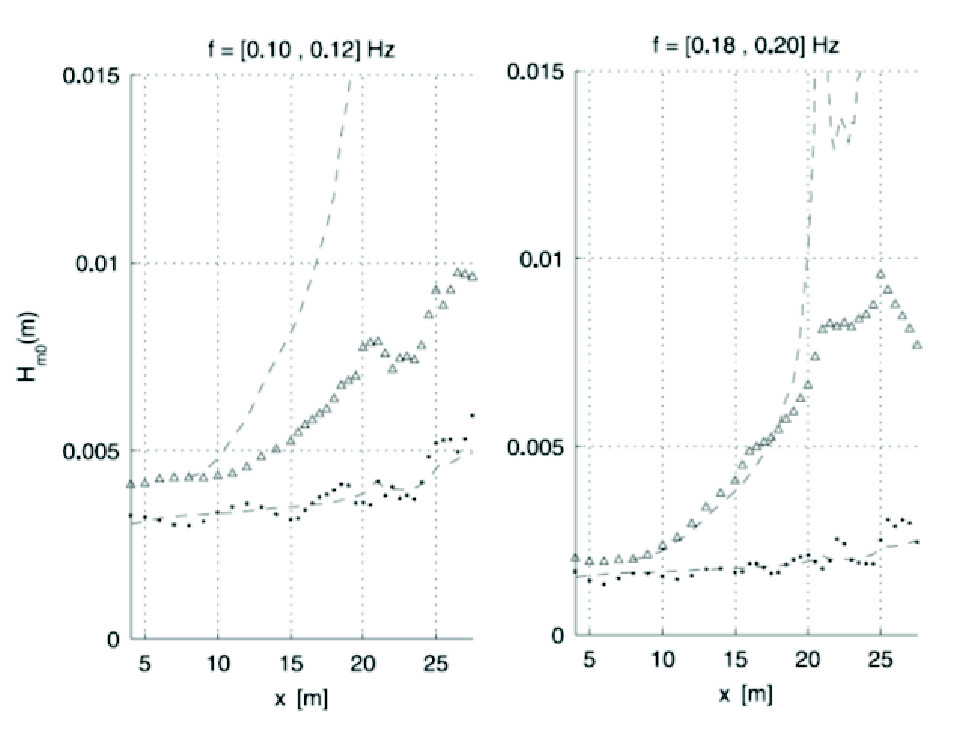
| 00:10, 23 January 2017 | WaveShoaling.jpg (file) |  |
79 KB | Significant wave height values of incoming and outgoing infragravity waves on a sloping 1:70 laboratory bed for different wave frequencies. | 1 |
| 00:11, 13 January 2021 | WaveRollerWEC.jpg (file) |  |
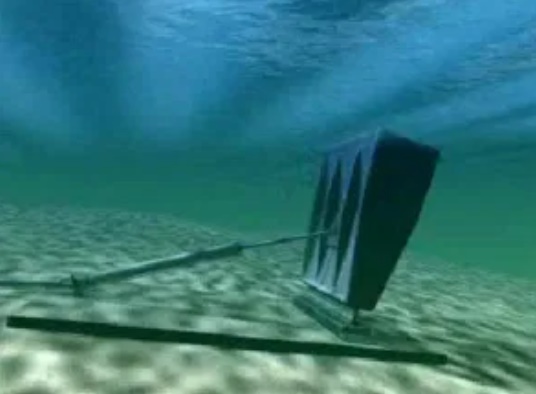
42 KB | Bottom-hinged wave energy converter WaveRoller. | 1 |
| 11:20, 3 July 2017 | WaveRippleFormationFig9.jpg (file) |  |
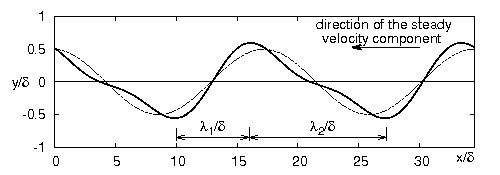
18 KB | Equilibrium profile of the ripples predicted by the stability analysis of Blondeaux et al. (2015). | 1 |
| 11:17, 3 July 2017 | WaveRippleFormationFig7.jpg (file) |  |
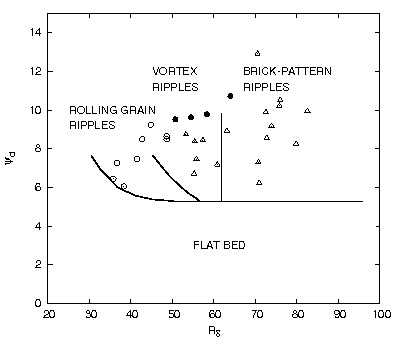
19 KB | Limiting curves dividing the <math>(R_\delta, \psi_d)</math>-plane in regions where a flat bed, rolling grain ripples, two-dimensional vortex ripples, brick-pattern ripples are expected to form. | 1 |
| 11:16, 3 July 2017 | WaveRippleFormationFig6a.jpg (file) |  |
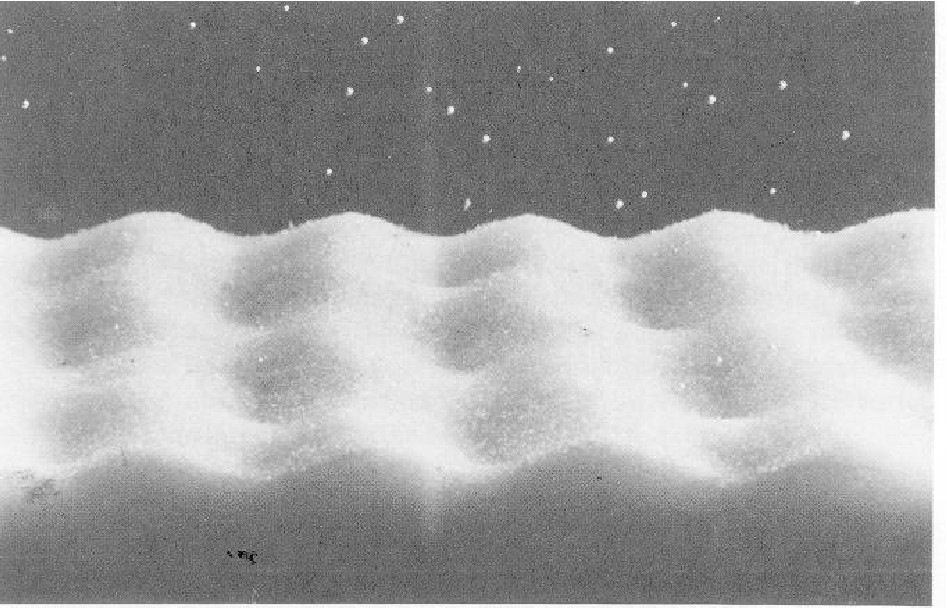
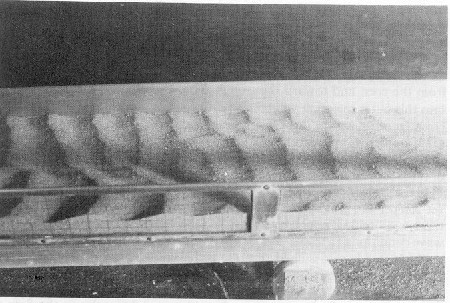
157 KB | Brick-pattern ripples (courtesy of John F.A. Sleath). | 1 |
| 11:15, 3 July 2017 | WaveRippleFormationFig5ab.jpg (file) |  |
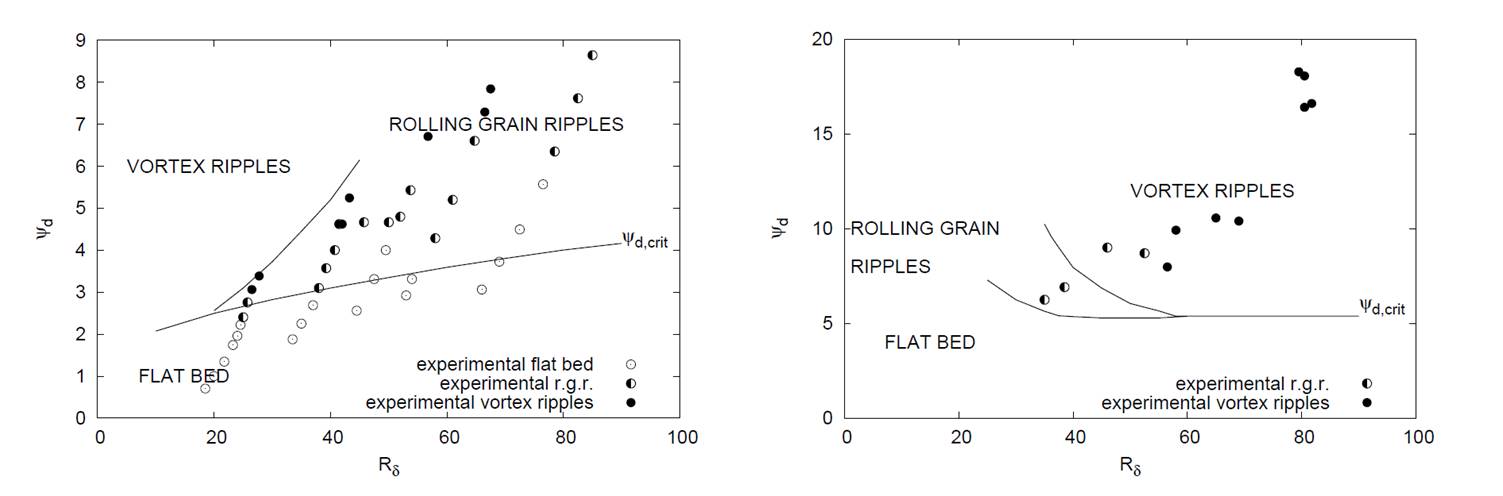
53 KB | Regions in the <math>(R_\delta,\psi_d)</math>-plane where a flat bed, rolling-grain ripples, and vortex ripples are expected to appear. Comparison between the theoretical predictions and the laboratory observations. | 1 |
| 10:49, 3 July 2017 | WaveRippleFormationFig4b.jpg (file) |  |
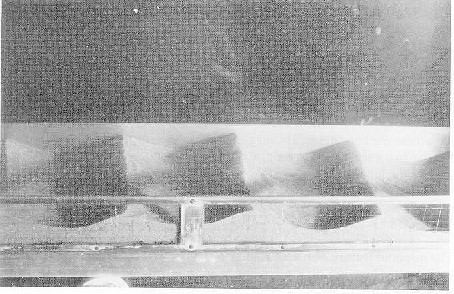
56 KB | Vortex ripples (courtesy of John F.A. Sleath). | 1 |
| 10:48, 3 July 2017 | WaveRippleFormationFig4a.jpg (file) |  |
48 KB | Rolling-grain ripples (courtesy of John F.A. Sleath). | 1 |