File list
This special page shows all uploaded files.
| Date | Name | Thumbnail | Size | Description | Versions |
|---|---|---|---|---|---|
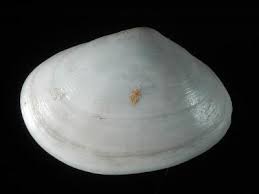
| 17:25, 7 August 2023 | AbraAlba.jpg (file) |  |
3 KB | ''Abra alba'' | 1 |
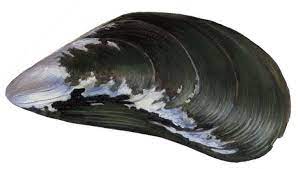
| 17:28, 7 August 2023 | Mytilus Edulis.jpg (file) |  |
6 KB | ''Mytilus edulis'' | 1 |
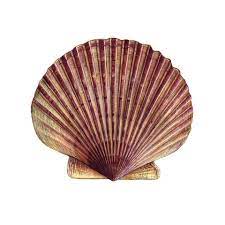
| 17:25, 7 August 2023 | ArgopectenPurpuratus.jpg (file) |  |
7 KB | ''Argopecten purpuratus'' | 1 |
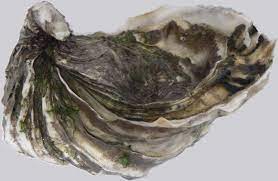
| 17:26, 7 August 2023 | MagallanaGigas.jpg (file) |  |
8 KB | ''Magallana gigas'' | 1 |
| 10:42, 5 November 2016 | PrinosFig6.jpg (file) |  |
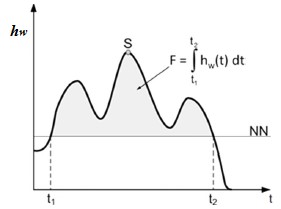
9 KB | Storm surge with maximum value, S, and associated fullness, F, of the entire storm surge curve. | 1 |
| 10:40, 5 November 2016 | PrinosFig4.jpg (file) |  |
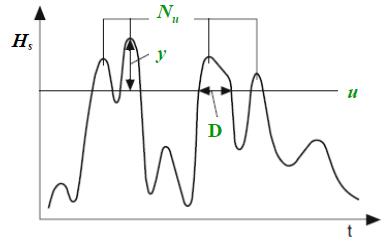
9 KB | Wave storm events and variables used in the POT method. | 1 |
| 14:12, 23 April 2017 | HanFig4.jpg (file) |  |
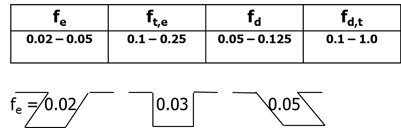
10 KB | Empirical coefficients for harbor siltation. | 1 |
| 13:32, 12 November 2016 | CTW.jpg (file) |  |
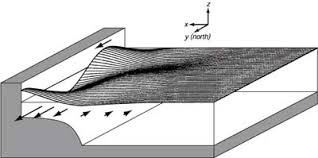
10 KB | Sketch of form of elevation for mode 1 coastal-trapped wave. | 1 |
| 09:52, 6 June 2017 | ChadwickFig3.jpg (file) |  |
11 KB | Definition sketch for a sinusoidal wave. | 1 |
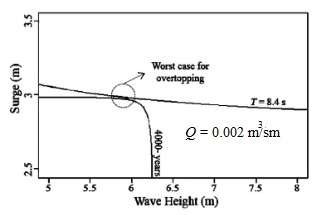
| 10:44, 5 November 2016 | PrinosFig8.jpg (file) |  |
12 KB | Estimation of the worst case combination of Hs and storm surge with a joint return period of 4000 years for a design overtopping discharge Q=0.002 m3/sm of a seawall at the Dutch coast. | 1 |
| 13:33, 12 November 2016 | CTWnodes.jpg (file) |  |
13 KB | Sketch of cross-slope structure of mode 3 coastal-trapped wave. | 1 |
| 12:53, 23 March 2016 | TidalEllipse.jpg (file) |  |
16 KB | Reverted to version as of 10:48, 23 March 2016 | 4 |
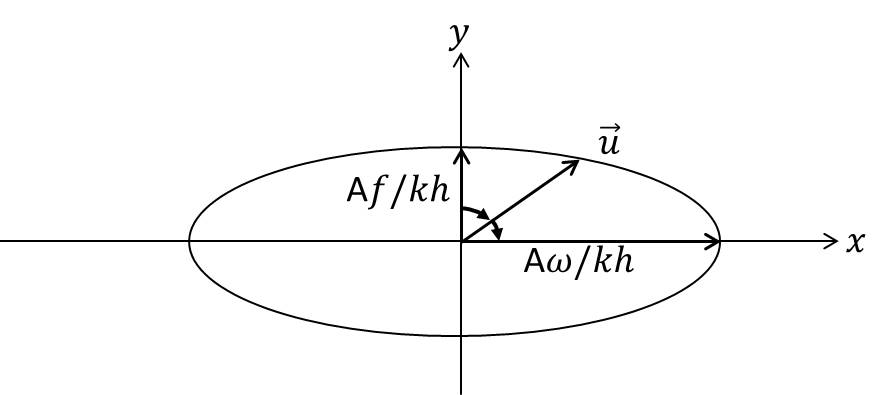
| 13:00, 23 March 2016 | TidalEllipse1.jpg (file) |  |
16 KB | At some distance from the coastal boundaries the tidal current vector describes an ellipse during the tidal cycle. The current vector runs the ellipse in clockwise direction on the northern hemisphere. | 1 |
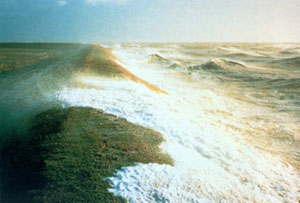
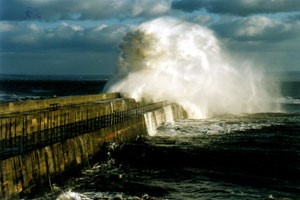
| 13:27, 23 January 2017 | EmbankmentOvertoppingGermany.jpg (file) |  |
16 KB | Wave overtopping of a coastal embankment in Germany caused by a wave storm event. | 1 |
| 23:37, 5 August 2016 | PrandleFig7.jpg (file) |  |
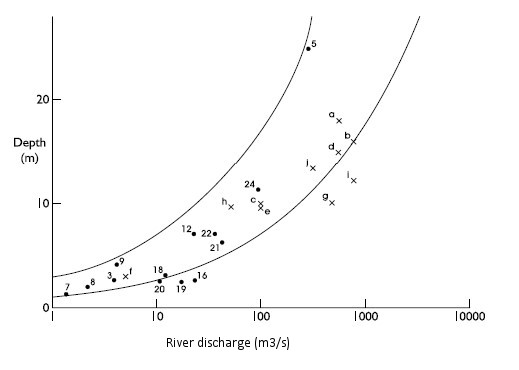
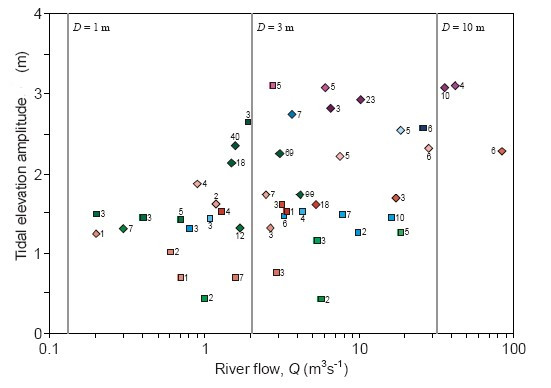
16 KB | Figure 7. Theoretical envelope : Depth at the mouth as a function of river flow. | 1 |
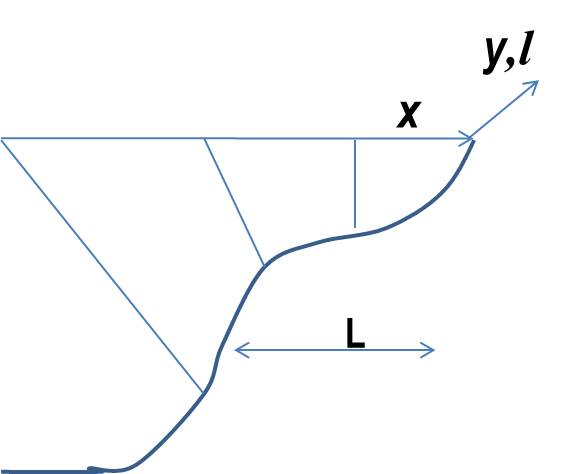
| 23:36, 5 August 2016 | PrandleFig6.jpg (file) |  |
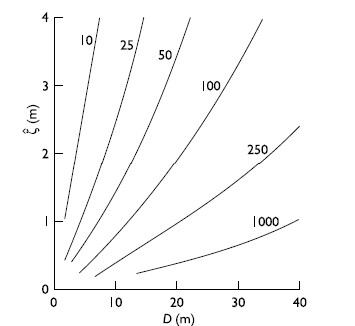
17 KB | Estuarine length, L (km), as a function of (D, Z) , with f=0.0025. | 1 |
| 10:35, 5 November 2016 | PrinosFig1.3.jpg (file) |  |
17 KB | Wave overtopping of a coastal embankment caused by a wave storm event. | 1 |
| 11:20, 3 July 2017 | WaveRippleFormationFig9.jpg (file) |  |
18 KB | Equilibrium profile of the ripples predicted by the stability analysis of Blondeaux et al. (2015). | 1 |
| 11:17, 3 July 2017 | WaveRippleFormationFig7.jpg (file) |  |
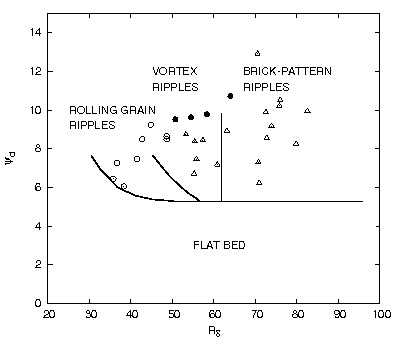
19 KB | Limiting curves dividing the <math>(R_\delta, \psi_d)</math>-plane in regions where a flat bed, rolling grain ripples, two-dimensional vortex ripples, brick-pattern ripples are expected to form. | 1 |
| 12:32, 13 June 2021 | GPS shoreline.jpg (file) |  |
19 KB | GPS shoreline monitoring. | 1 |
| 15:34, 6 June 2017 | ChadwickFig20NEW.jpg (file) |  |
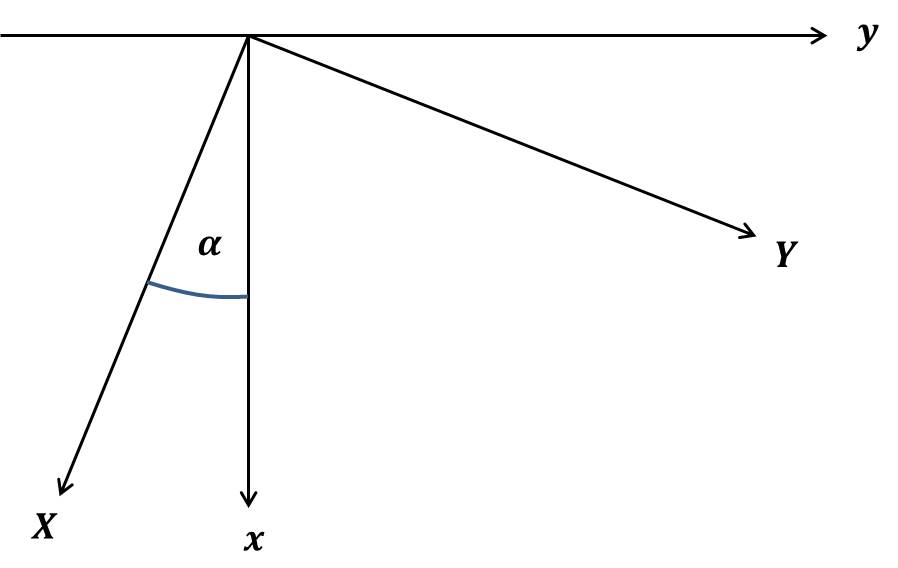
19 KB | Relationships between principal axes and shoreline axes. | 1 |
| 12:17, 27 April 2018 | BadhotelSchiermonnikoog 1924.jpg (file) |  |
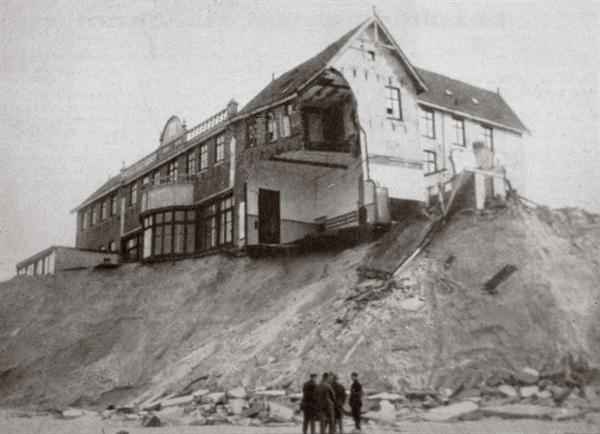
19 KB | Badhotel at Schiermonnikoog after the 1924 storm. | 1 |
| 15:06, 23 June 2023 | AngleOfRepose.jpg (file) |  |
19 KB | Angle of repose: Equilibrium slope angle of a pile of sediment grains in water. | 1 |
| 10:43, 5 November 2016 | PrinosFig7.jpg (file) |  |
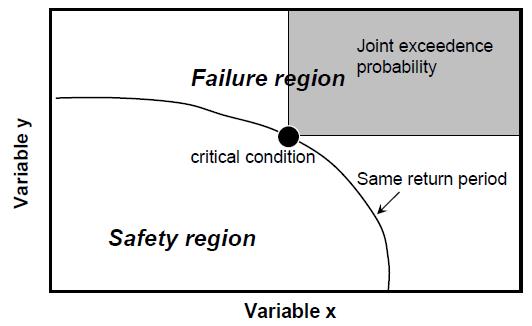
20 KB | Failure region and joint exceedance probability of a bivariate pair of variables x, y. | 1 |
| 21:03, 16 December 2020 | StellersSeaCow.jpg (file) |  |
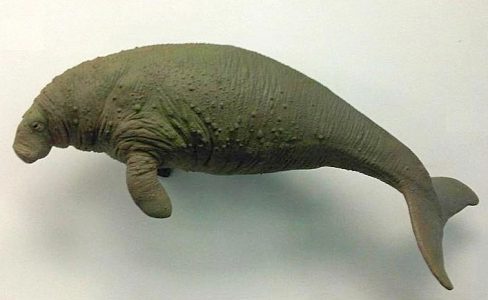
20 KB | Steller's sea cow. Photo credit Emoke Denes. | 1 |
| 11:21, 3 July 2017 | WaveRippleFormationFig10.jpg (file) |  |
20 KB | Theoretical and experimental values of the dimensioless migration speed of ripples plotted versus <math>R_\delta</math>. | 1 |
| 11:23, 3 July 2017 | WaveRippleFormationFig12.jpg (file) |  |
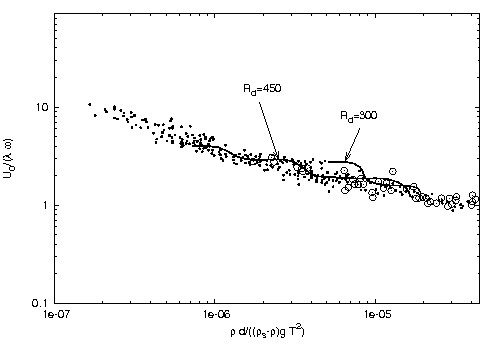
20 KB | Ratio between the amplitude <math>U_0/\omega</math> of the fluid displacement oscillations and the wavelength <math>\lambda</math> of the ripples plotted versus the parameter <math>\rho d/(\rho_s-\rho) g T^2</math>. | 1 |
| 14:26, 5 June 2017 | BlondeauxFig6.jpg (file) |  |
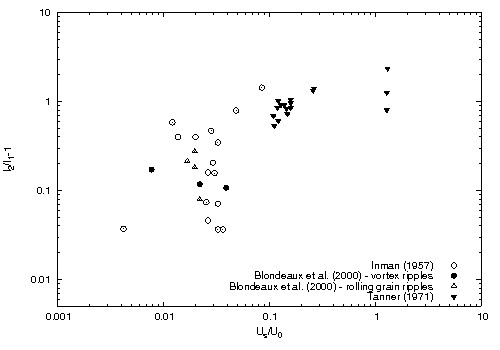
20 KB | Ripple symmetry index plotted versus the ratio between the mass-transport velocity and the maximum near-bed orbital velocity. | 1 |
| 16:35, 14 September 2016 | CocoFig4.jpg (file) |  |
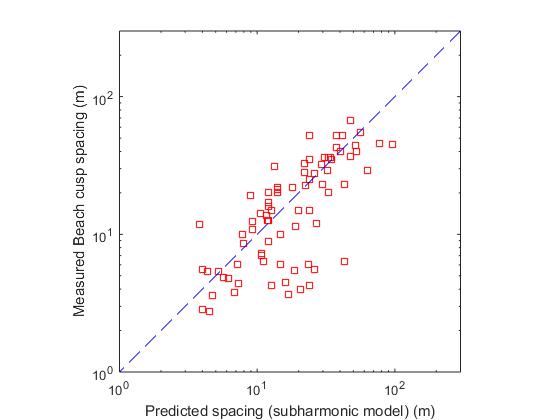
20 KB | Figure 4: Measured beach cusp spacing versus the spacing predicted assuming the presence of subharmonic standing edge waves. | 1 |
| 23:24, 13 March 2017 | FlowPerturbationObliqueRidge.jpg (file) |  |
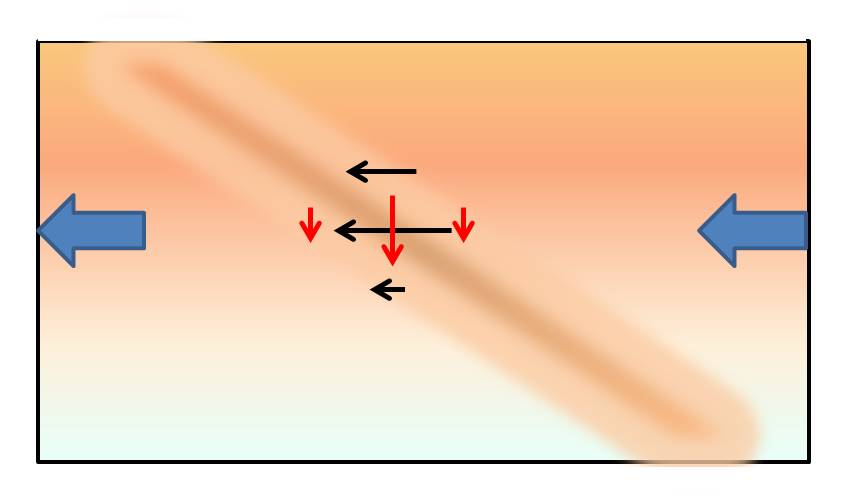
21 KB | Perturbation of frictionless flow over a shoreface-connected ridge. | 1 |
| 10:44, 3 July 2017 | WaveRippleFormationFig2.jpg (file) |  |
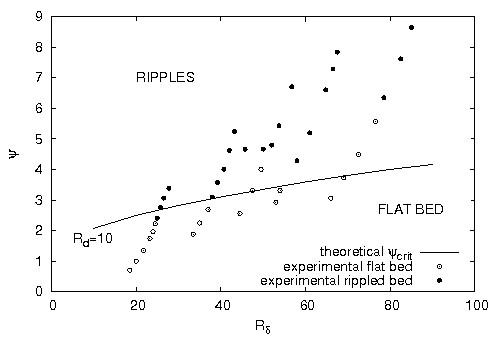
21 KB | Region of existence of ripples and flat beds (adapted from Blondeaux 1990). | 1 |
| 10:38, 5 November 2016 | PrinosFig1.5.jpg (file) |  |
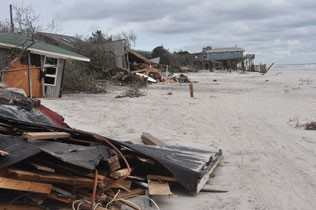
21 KB | Damages to ocean front homes during Hurricane Sandy on Fire Island, NY. | 1 |
| 15:03, 23 April 2017 | HanFig8.jpg (file) |  |
21 KB | Cartoon of extra water to be attracted. | 1 |
| 09:59, 6 June 2017 | ChadwickFig12a.jpg (file) |  |
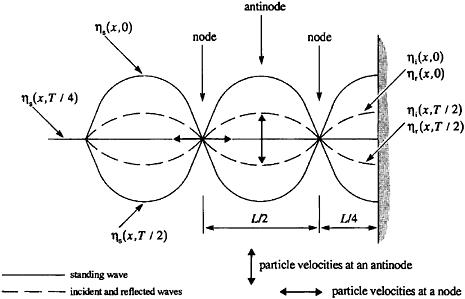
22 KB | Standing Waves, idealised. | 1 |
| 14:12, 23 April 2017 | HanFig5.jpg (file) |  |
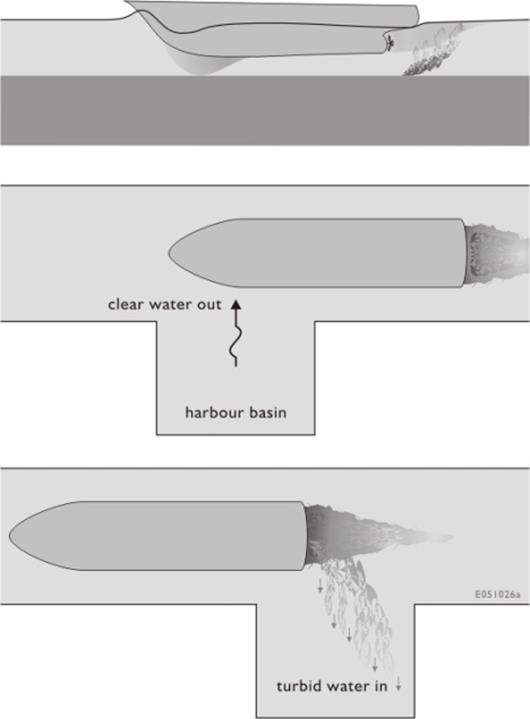
22 KB | Cartoon of shipping-induced siltation. | 1 |
| 22:26, 14 March 2017 | ShoreObliqueFlowPath1.jpg (file) |  |
22 KB | Flow path over a shoreface-connected ridge. | 1 |
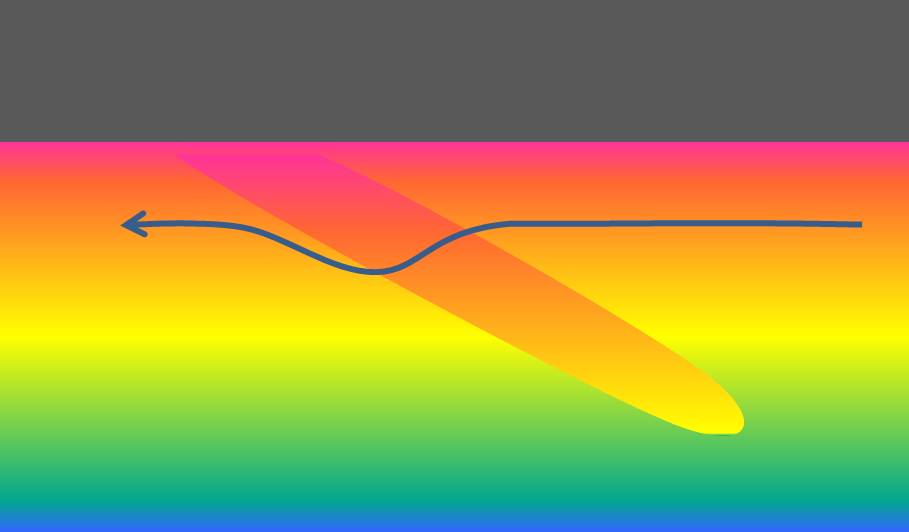
| 22:05, 13 October 2019 | CrestRotationNEW.jpg (file) |  |
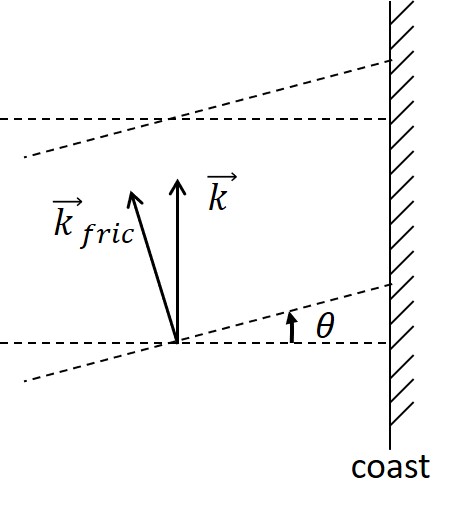
23 KB | Rotation of the propagation direction of a Kelvin wave away from the coast due to friction. | 1 |
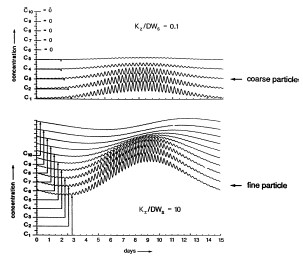
| 23:35, 5 August 2016 | PrandleFig4.jpg (file) |  |
23 KB | Figure 4. Model simulations of SPM over a spring-neap tidal cycle. | 1 |
| 22:27, 14 March 2017 | FlowPerturbationObliqueRidge1.jpg (file) |  |
23 KB | Perturbation of frictionless flow over a shoreface-connected ridge. | 1 |
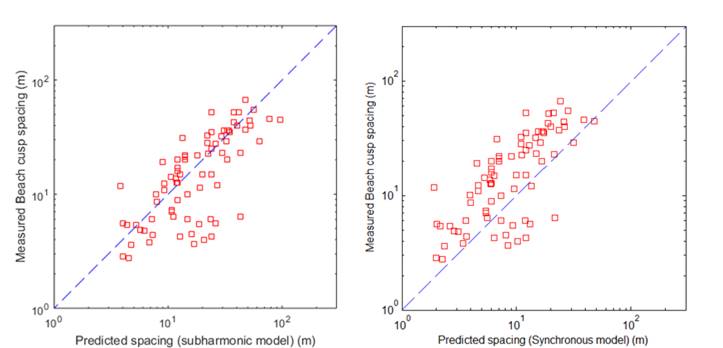
| 10:37, 15 September 2016 | GiovanniFig4.jpg (file) |  |
23 KB | Figure 4. Measured beach cusp spacing versus the spacing predicted assuming the presence of subharmonic (left panel) or synchronous (right panel) standing edge waves. | 1 |
| 11:59, 21 April 2018 | AMOC.jpg (file) |  |
23 KB | Schematic representation of the Atlantic Meridional Overturning Current. | 1 |
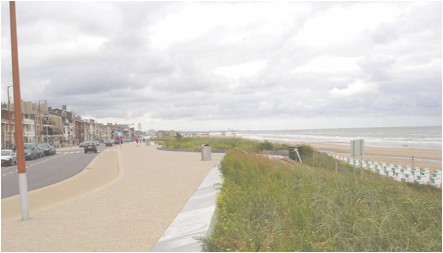
| 17:31, 5 February 2020 | KatwijkCoastalProtection.jpg (file) |  |
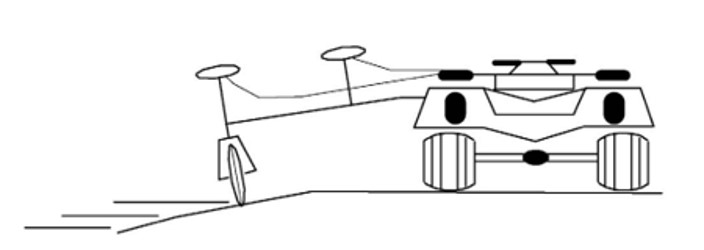
24 KB | The coastal village Katwijk (Netherlands) has been protected by an artificial dune built in front of the seashore boulevard with sand extracted far offshore. | 1 |
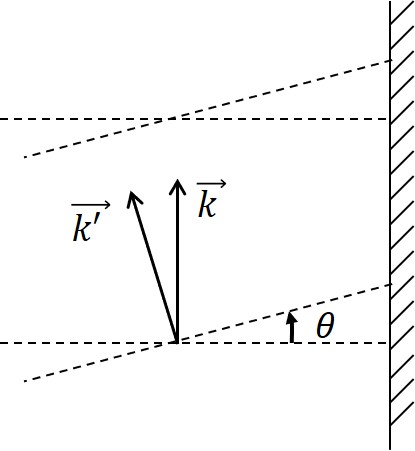
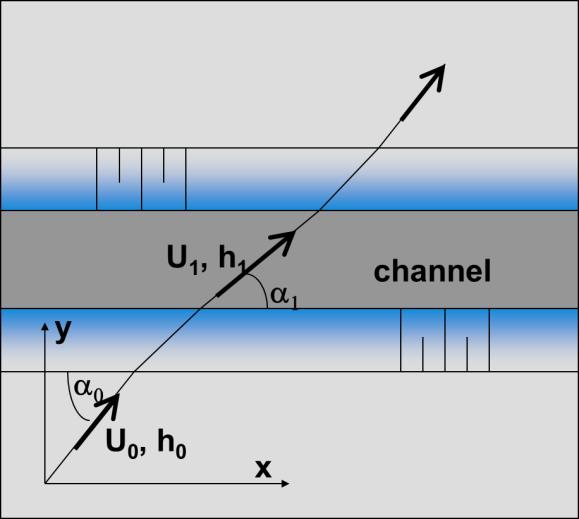
| 14:13, 23 April 2017 | HanFig6.jpg (file) |  |
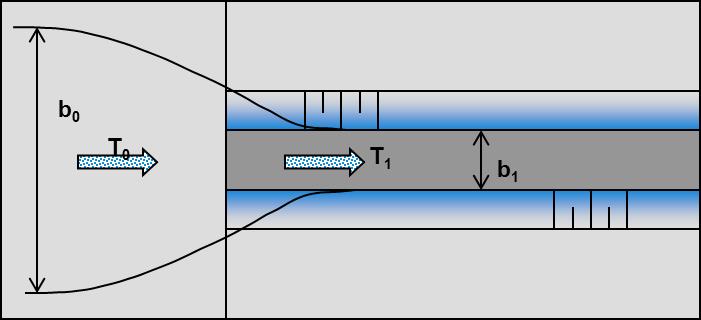
25 KB | Refraction of current oblique to navigation channel. | 1 |
| 11:22, 30 March 2021 | BeachRunnel.jpg (file) |  |
25 KB | Beach runnel running behind an intertidal bar. | 1 |
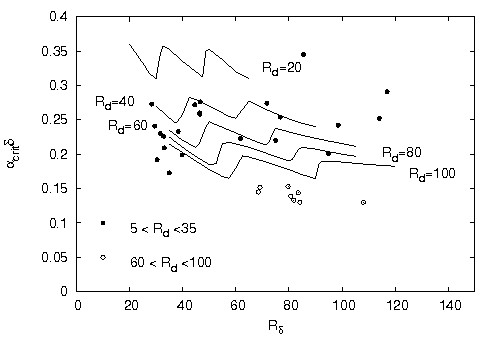
| 10:46, 3 July 2017 | WaveRippleFormationFig3.jpg (file) |  |
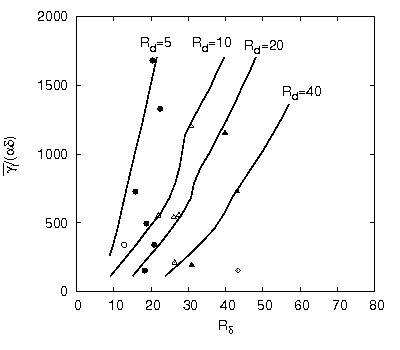
25 KB | Critical value <math>\alpha_{crit}</math> of <math>\alpha</math> plotted versus the flow Reynolds number <math>R_\delta</math> for <math>s=2.65, \mu=0.15, n=0.4</math> and different values of <math>R_d=R_p\sqrt{\psi_d}</math>. | 1 |
| 23:38, 5 August 2016 | PrandleFig8.jpg (file) |  |
25 KB | Figure 8. Observed vs. theoretical estuarine depths at the mouth, D (m), as function of (Q, Z). | 1 |
| 23:32, 5 August 2016 | PrandleFig1.jpg (file) |  |
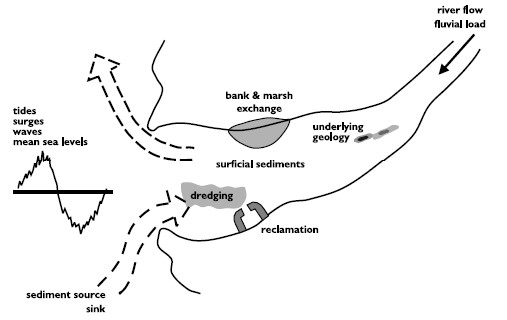
26 KB | Figure 1: Schematic of major factors influencing estuarine bathymetry. | 1 |
| 11:58, 13 April 2020 | AmmophilaArenaria.jpg (file) |  |
26 KB | Ammophila arenaria (Marram grass) | 1 |
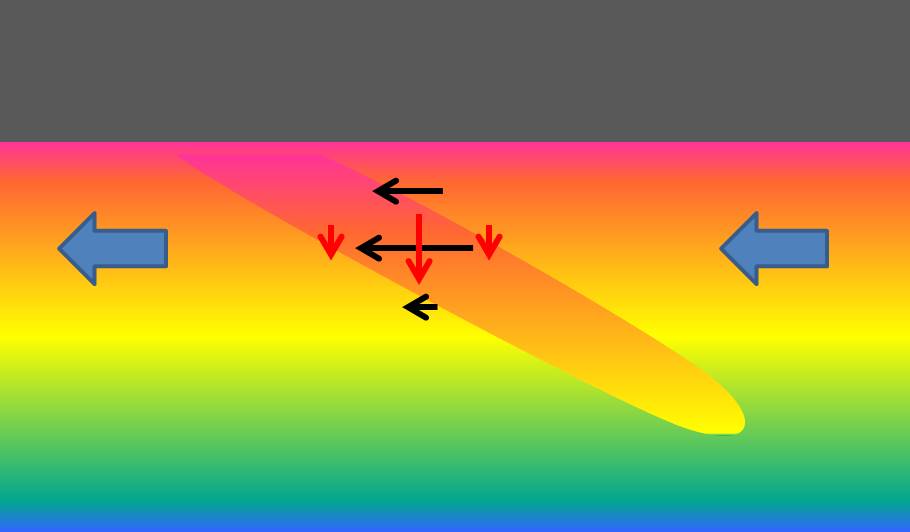
| 22:24, 13 October 2019 | CrestRotation.jpg (file) |  |
26 KB | Rotation of the propagation direction of a Kelvin wave away from the coast due to bottom friction. | 2 |
| 23:23, 13 March 2017 | ShoreObliqueFlowPath.jpg (file) |  |
26 KB | Flow path over a shoreface-connected ridge. | 1 |