File list
This special page shows all uploaded files.
| Date | Name | Thumbnail | Size | Description | Versions |
|---|---|---|---|---|---|
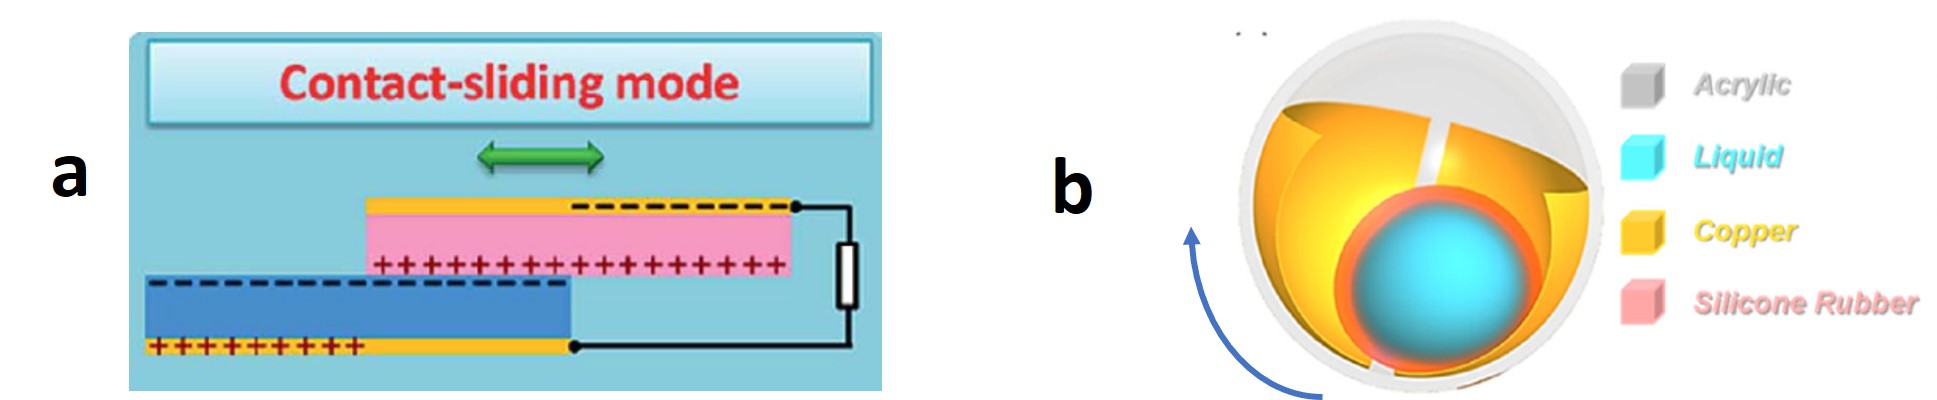
| 17:35, 9 January 2021 | TENG.jpg (file) | 76 KB | Principle of tribo-electric nanogenerators. (a) Laterally sliding dielectric films (b) Soft contact rolling-mode spherical TENG (SS-TENG). From Huang et al. (2020), Creative Commons licence. | 1 | |
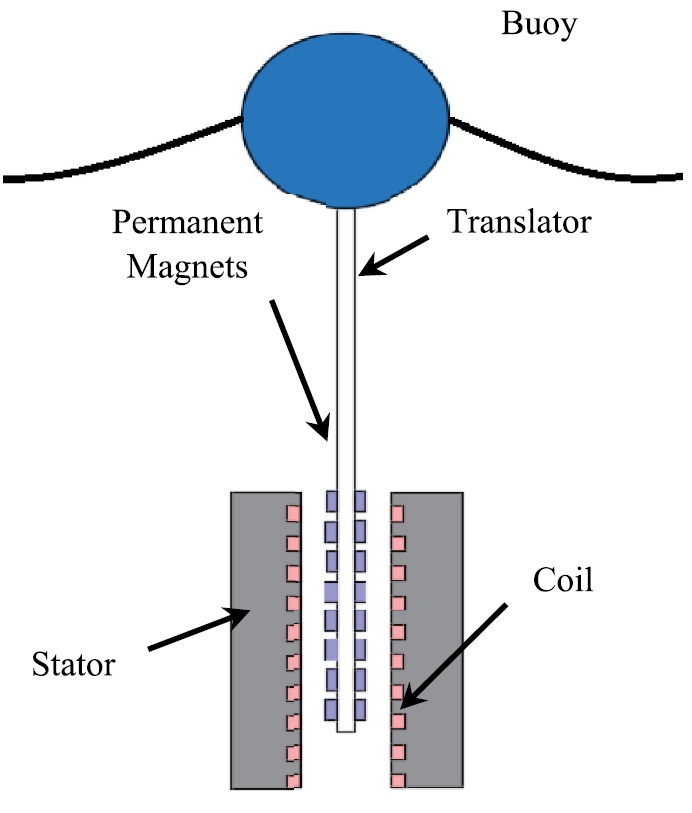
| 13:17, 9 January 2021 | DirectElectricalDrive.jpg (file) |  |
63 KB | Schematic of a linear electrical generator based on a permanent magnet generator. From Ahamed et al. (2020). | 1 |
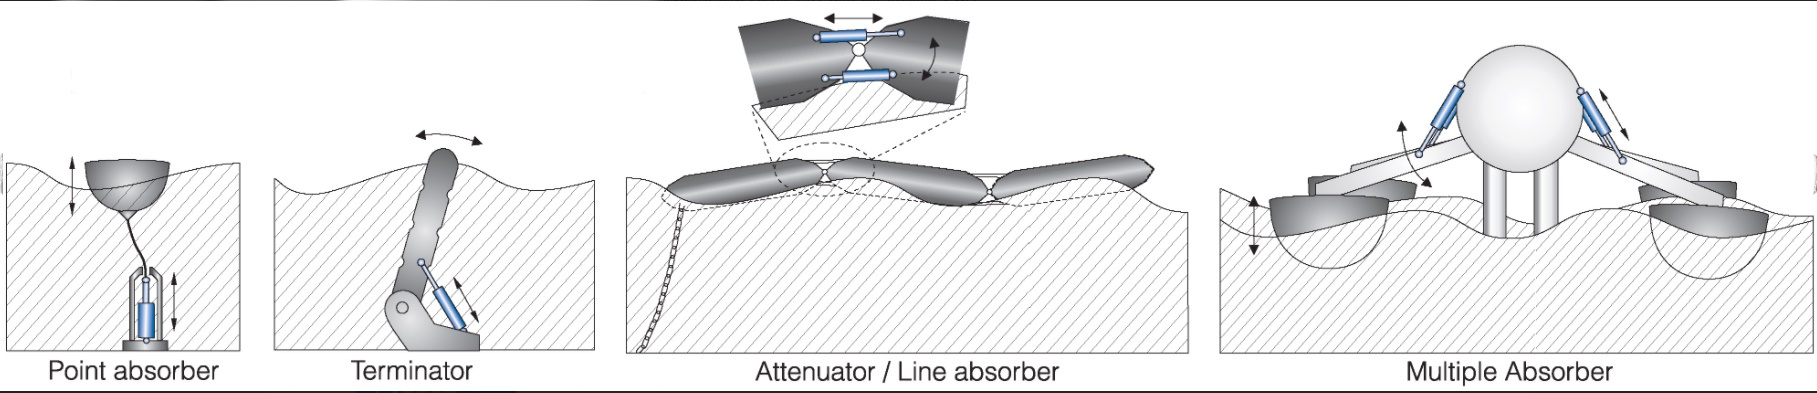
| 10:00, 9 January 2021 | WaveAbsorbers.jpg (file) | 208 KB | Different energy conversion principles based on absorption of wave energy. | 1 | |
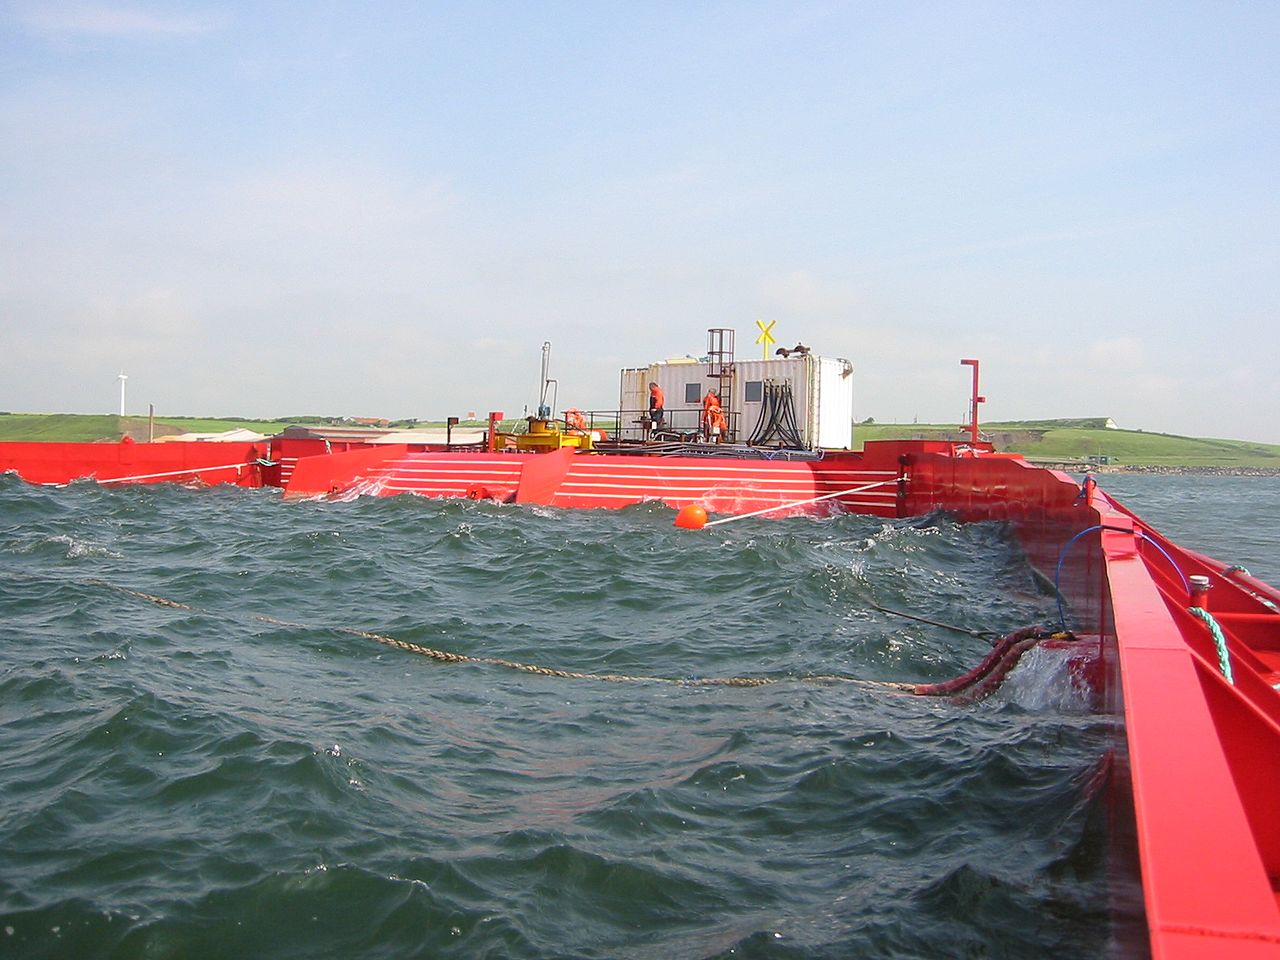
| 21:05, 8 January 2021 | WaveDragon.jpg (file) |  |
170 KB | Wave Dragon overtopping wave energy converter. | 1 |
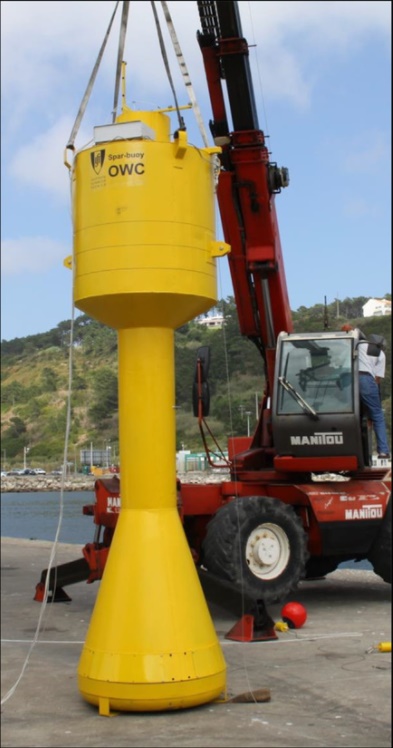
| 21:04, 8 January 2021 | SparBuoy.jpg (file) |  |
88 KB | Spar buoy wave energy converter. | 1 |
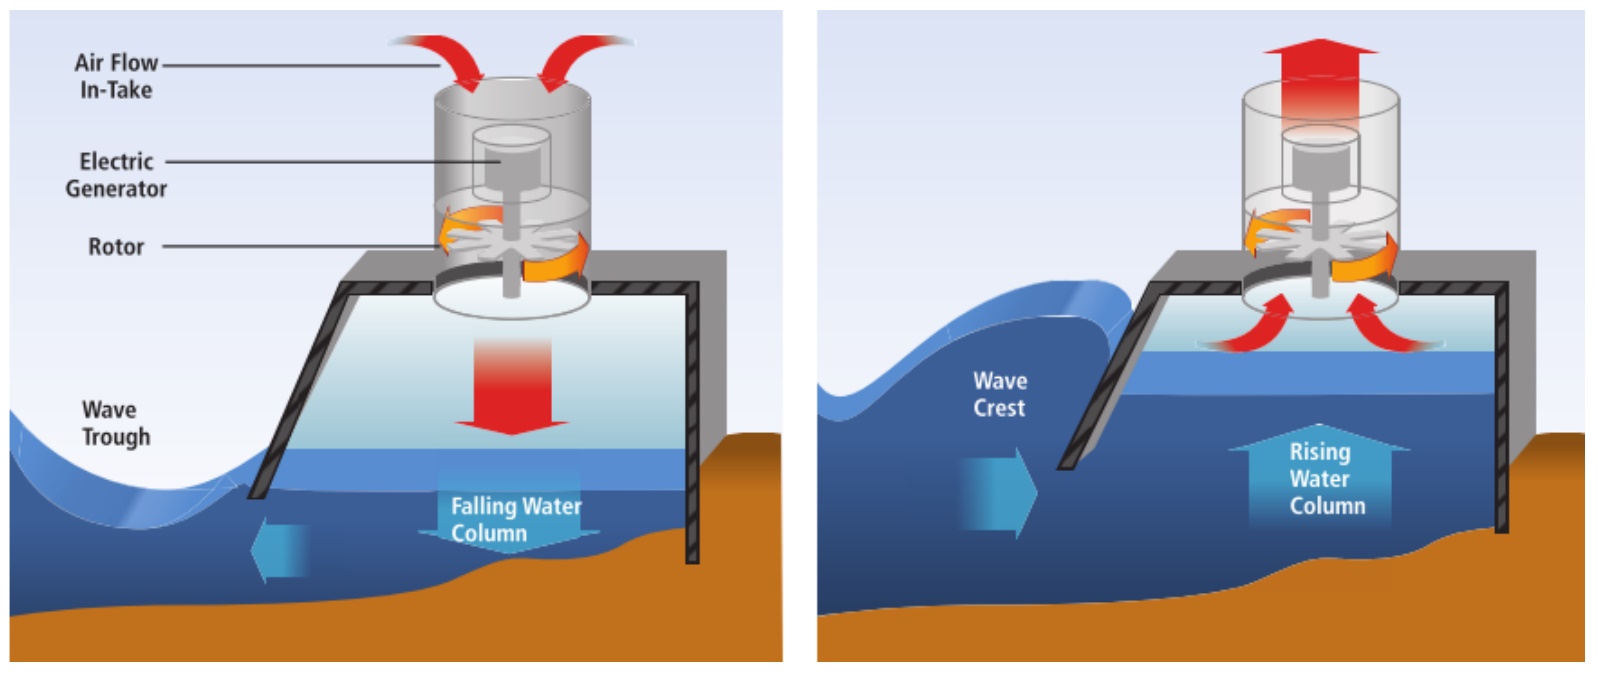
| 21:02, 8 January 2021 | OWCbuoy.jpg (file) |  |
76 KB | Wave energy buoy based on the oscillating water column principle. | 1 |
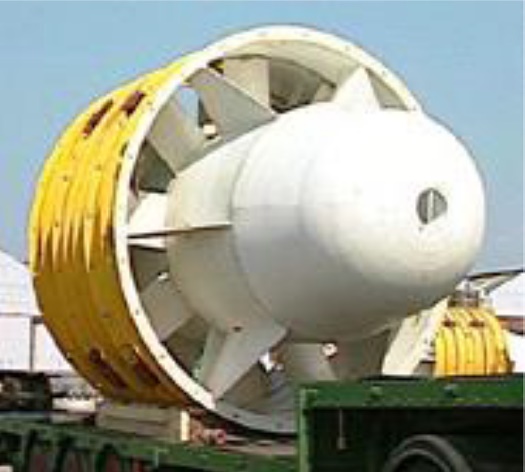
| 21:01, 8 January 2021 | WellsTurbine.jpg (file) |  |
60 KB | Prototype of a Wells turbine. | 1 |
| 20:59, 8 January 2021 | REWEC.jpg (file) |  |
134 KB | Wave energy conversion using the principle of the oscillating water column. | 1 |
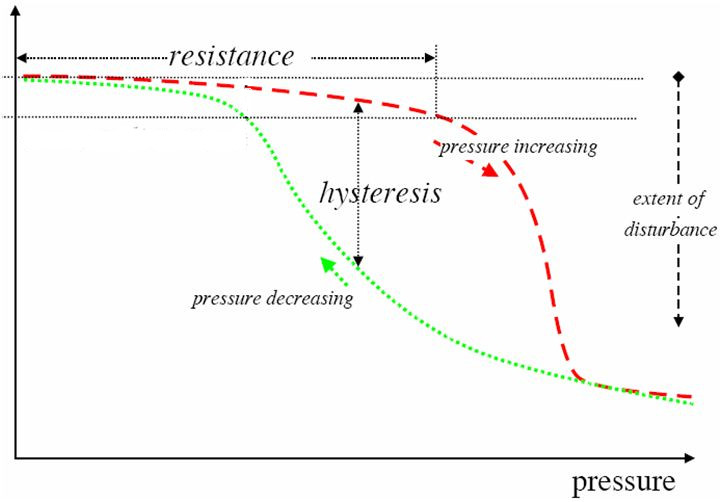
| 20:44, 4 January 2021 | EcosystemHysteresis.jpg (file) |  |
41 KB | Hysteresis in ecosystem response to temporary disturbance. | 1 |
| 12:45, 31 December 2020 | ExplodedReef.jpg (file) |  |
158 KB | Coral reef destroyed by blast fishery. Source: Reefs at risk in southeast Asia. World Resources Institute, 2002. | 1 |
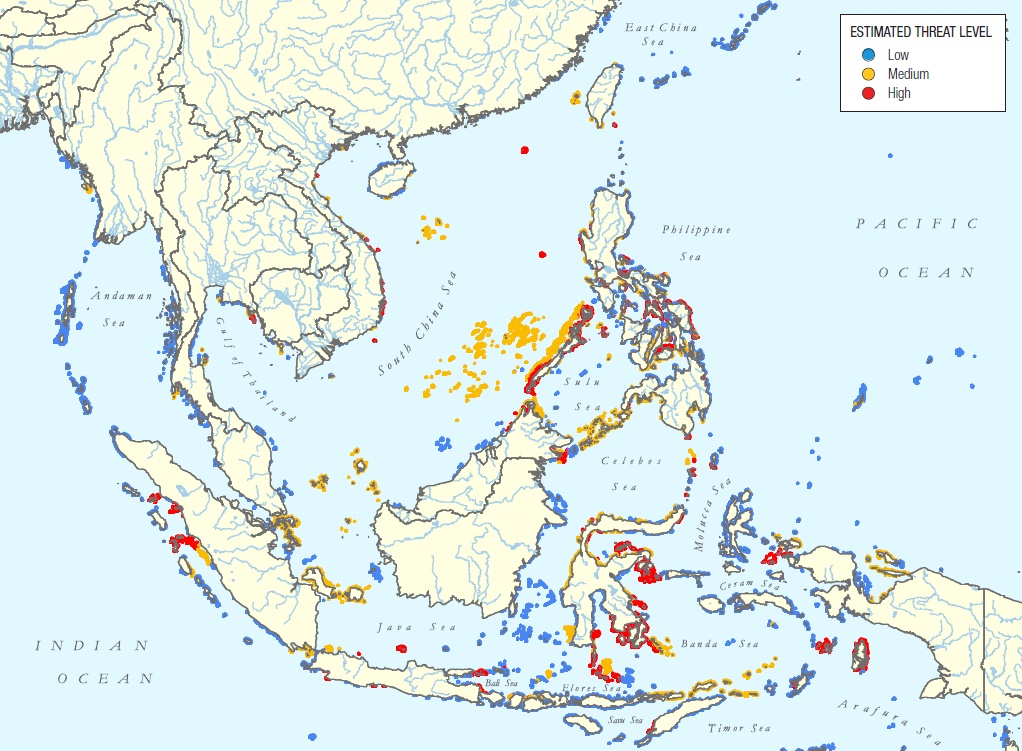
| 12:44, 31 December 2020 | ReefsDestructiveFishing.jpg (file) |  |
285 KB | Reefs threatened by destructive fishing. Source: Reefs at risk in southeast Asia. World Resources Institute, 2002.) | 1 |
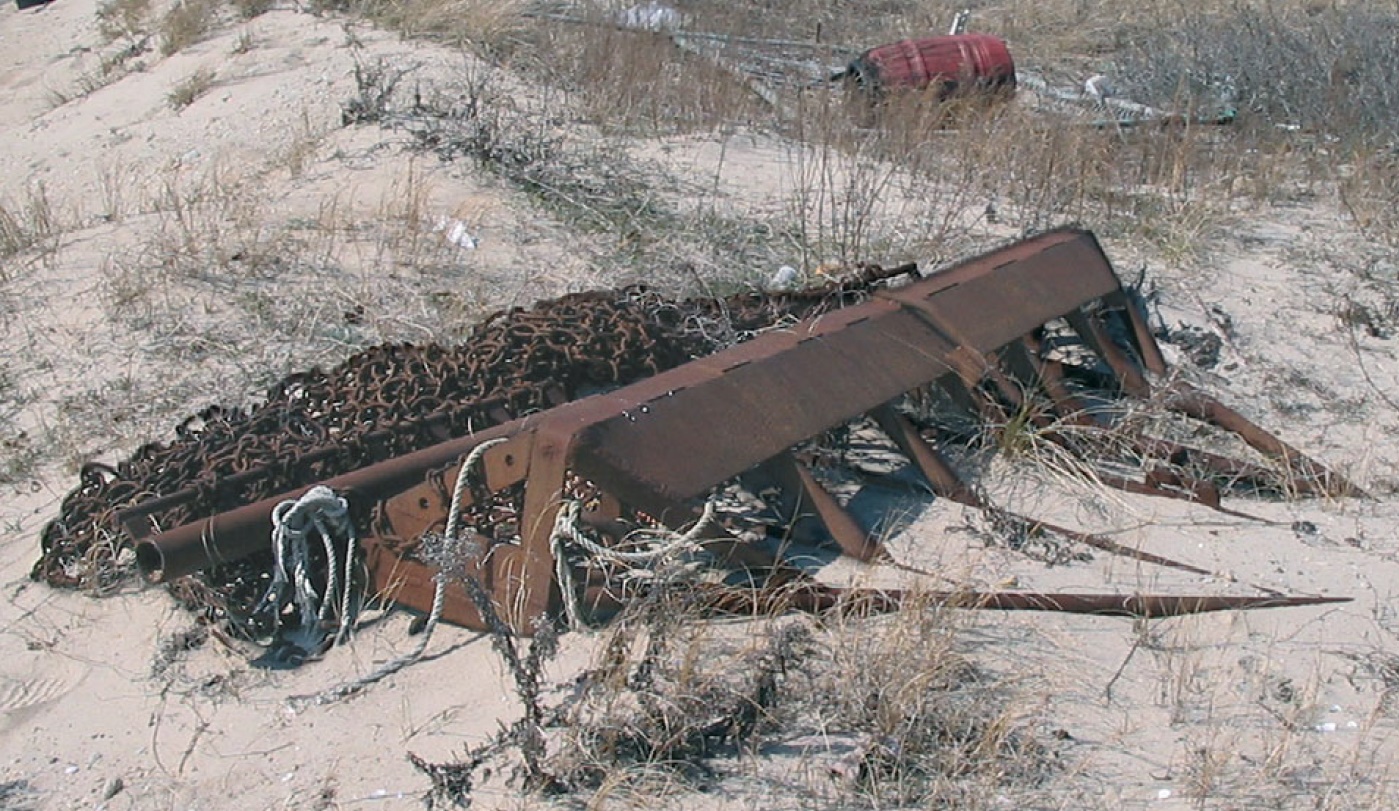
| 15:03, 30 December 2020 | ScallopFishingGear.jpg (file) |  |
516 KB | Scallop fishing gear. Photo credit: Michel Kaiser. | 1 |
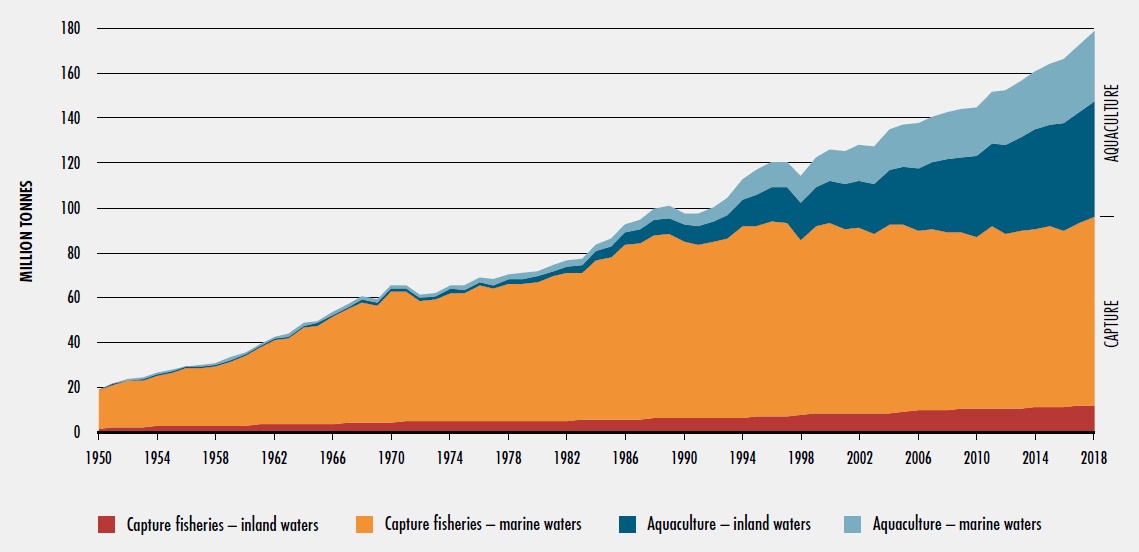
| 16:26, 27 December 2020 | WorldProdFisheryAquacultureFAO.jpg (file) |  |
88 KB | Global trends in different types of fisheries. Source: FAO (2020) | 1 |
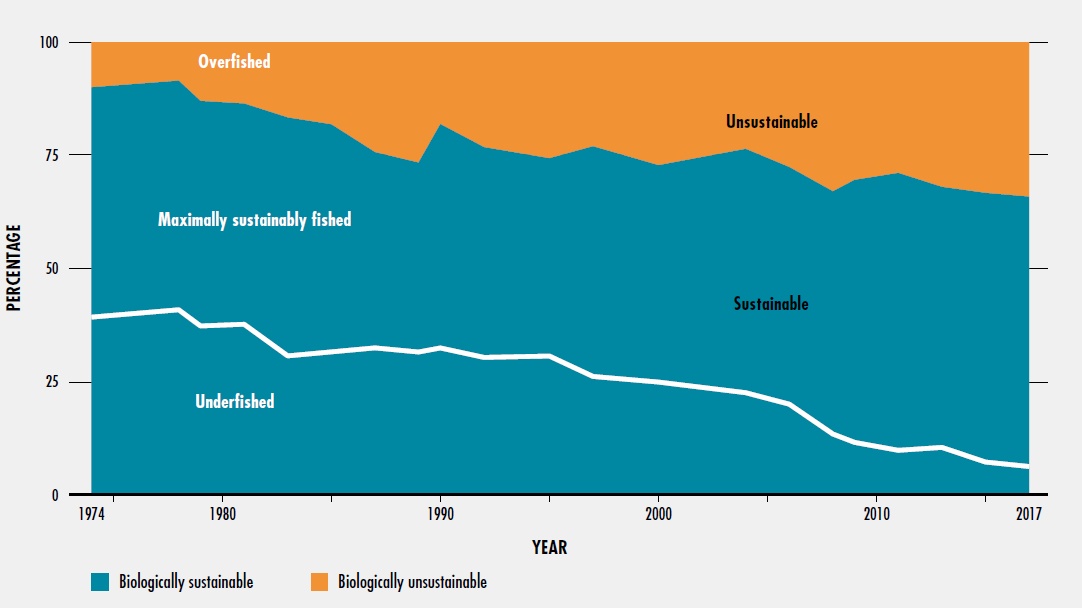
| 15:49, 27 December 2020 | TrendOverfishedFAO.jpg (file) |  |
68 KB | Global trend in overfishing. Source: FAO (2020). | 1 |
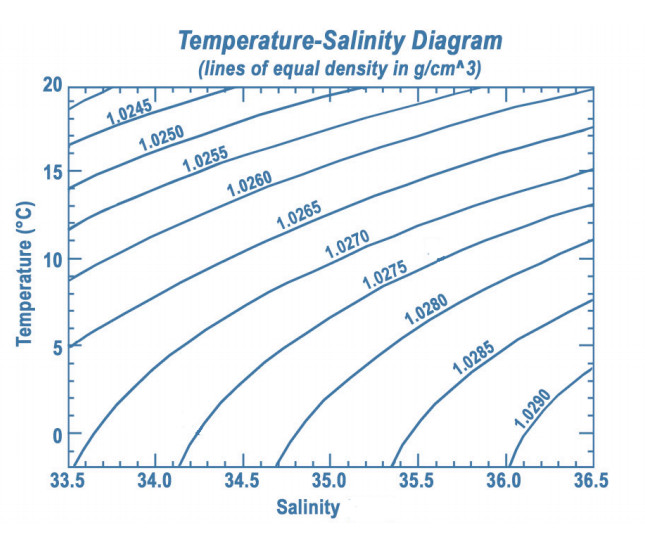
| 16:12, 22 December 2020 | DensitySalinityTemperaturePlot.jpg (file) |  |
83 KB | Density-salinity-temperature plot. Source: NASA. | 1 |
| 15:26, 22 December 2020 | SaltFingers.jpg (file) |  |
61 KB | Schematic picture of salt fingers. Blue=lower density, red=higher density. | 1 |
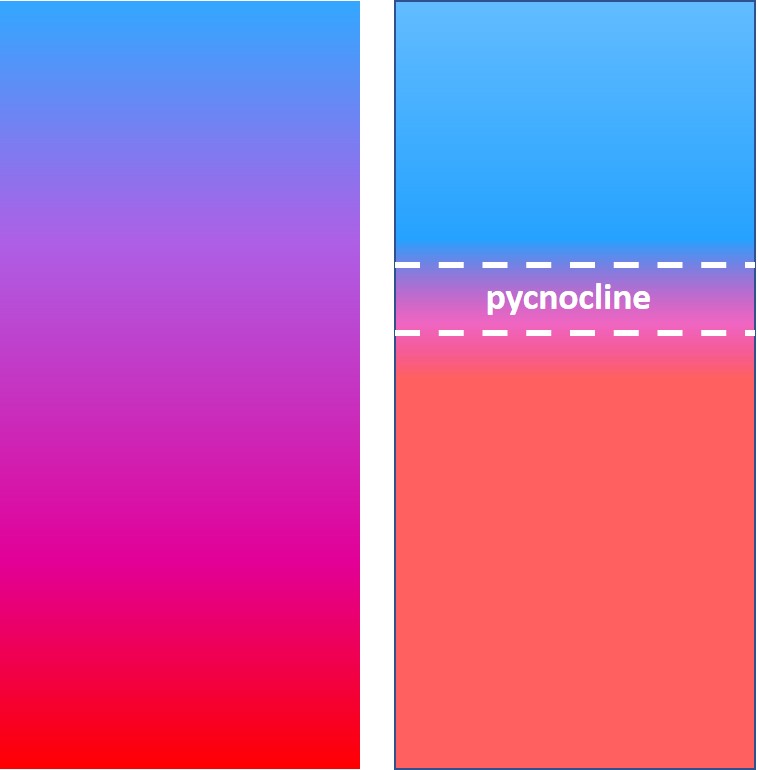
| 15:25, 22 December 2020 | Stratification.jpg (file) |  |
33 KB | Well-mixed (left) and stratified (right) water column. | 1 |
| 15:24, 22 December 2020 | EstCirc.jpg (file) | 58 KB | Schematic picture of estuarine circulation. | 1 | |
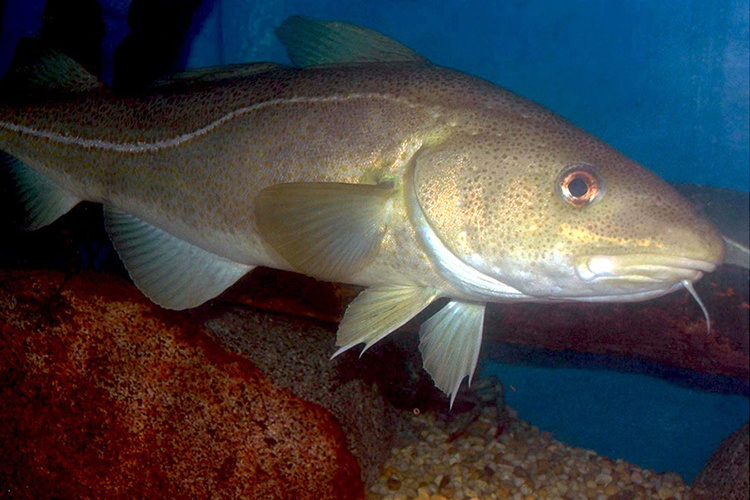
| 20:04, 16 December 2020 | AtlanticCod.jpg (file) |  |
211 KB | Atlantic cod. Photo credit NOAA. | 1 |
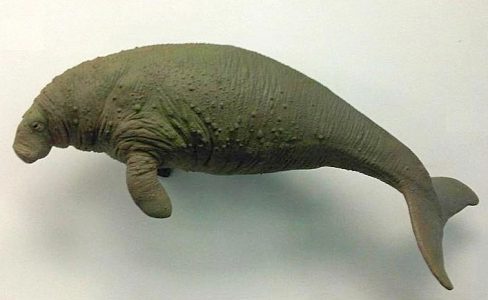
| 20:03, 16 December 2020 | StellersSeaCow.jpg (file) |  |
20 KB | Steller's sea cow. Photo credit Emoke Denes. | 1 |
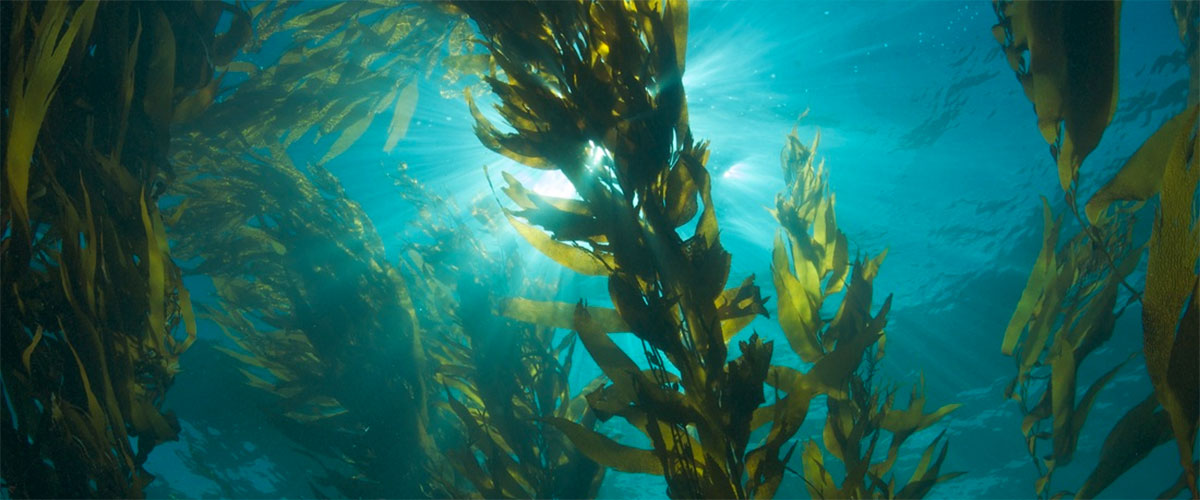
| 20:02, 16 December 2020 | KelpForest.jpg (file) |  |
121 KB | Kelp forest. Photo credit NOAA | 1 |
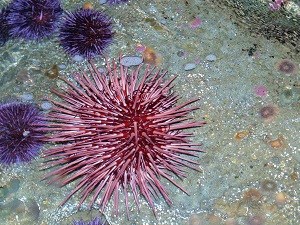
| 20:01, 16 December 2020 | SeaUrchin.jpg (file) |  |
39 KB | Sea urchin. Photo credit US National Park Service. | 1 |
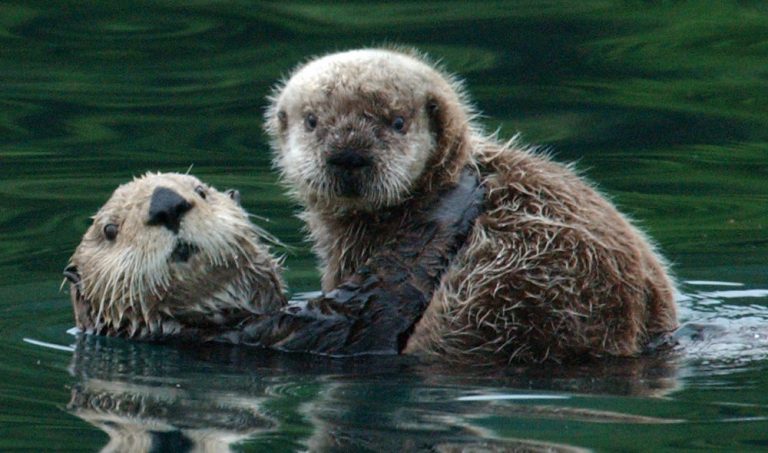
| 20:01, 16 December 2020 | SeaOtter.jpg (file) |  |
68 KB | Sea otter. Photo credit US Fish and Wildlife. | 1 |
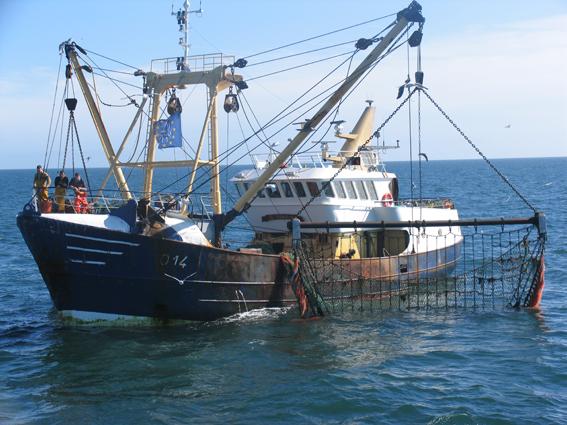
| 20:22, 7 December 2020 | BeamTrawler.jpg (file) |  |
47 KB | Beam trawler. Photo credit Flanders Government. | 1 |
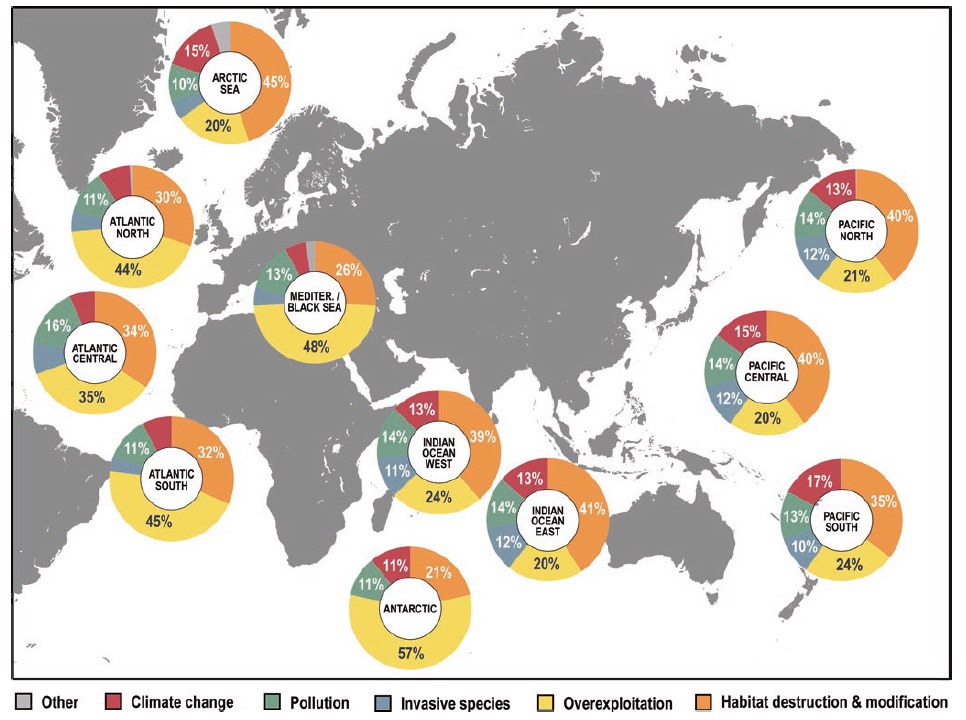
| 11:28, 7 December 2020 | CausesSpeciesLossMap.jpg (file) |  |
190 KB | Causes of species loss for different marine regions. From Luypert et al., 2020, Creative Commons licence. | 1 |
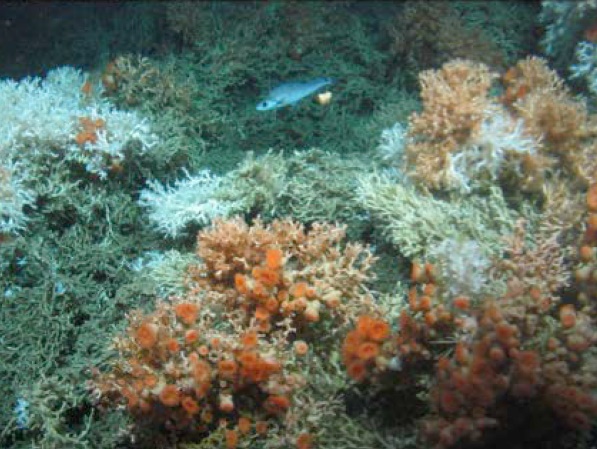
| 22:02, 4 December 2020 | LopheliaPertusa.jpg (file) |  |
123 KB | ''Lophelia Pertusa''. Photo credit J.M.Roberts. | 1 |
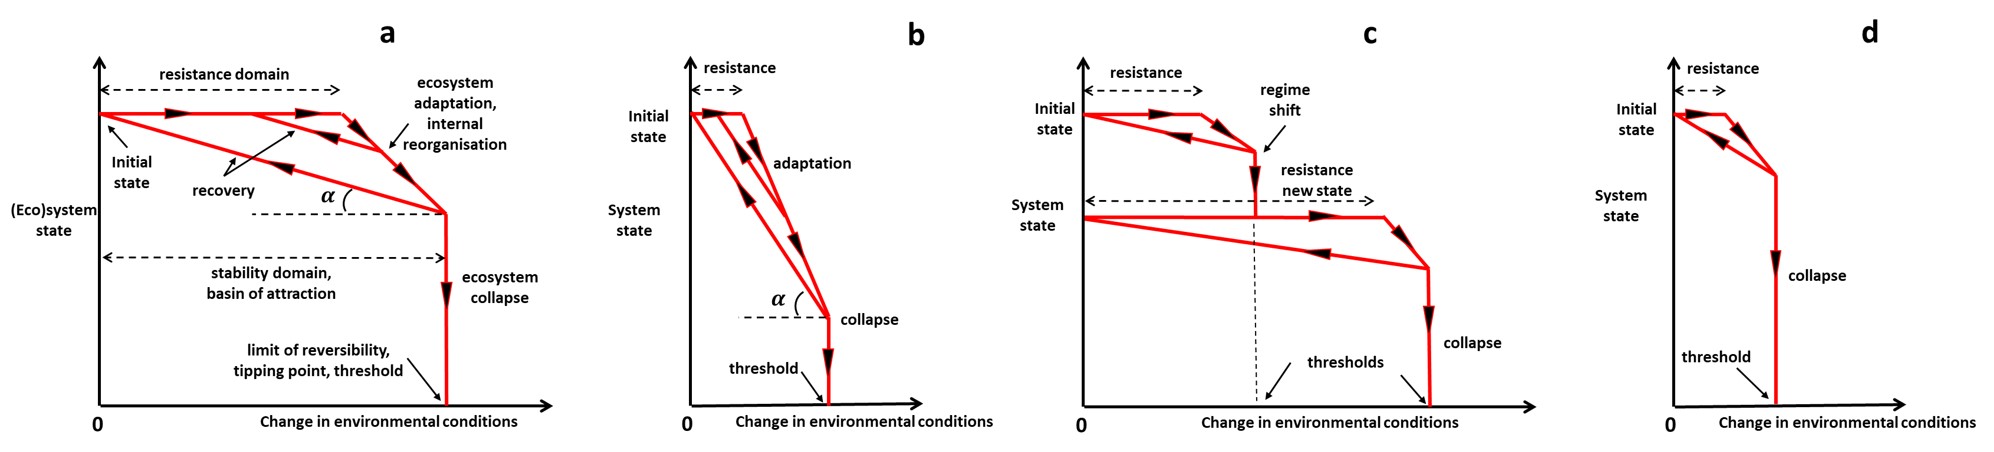
| 17:33, 28 November 2020 | ResilienceTrajectories.jpg (file) | 114 KB | Schematic representation of the trajectories of a (socio-)ecological system in a plane defined by the system state (fundamental structure, processes, and functioning - vertical axis) and the change of environmental conditions (horizontal axis), for dif... | 2 | |
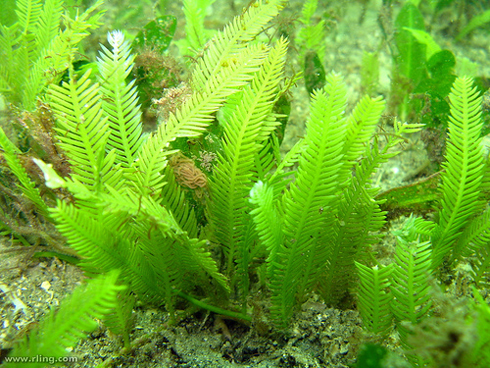
| 20:30, 26 November 2020 | CaulerpaTaxifolia.jpg (file) |  |
307 KB | The invasive green algae, Caulerpa taxifolia. Photo credit Richard Ling | 1 |
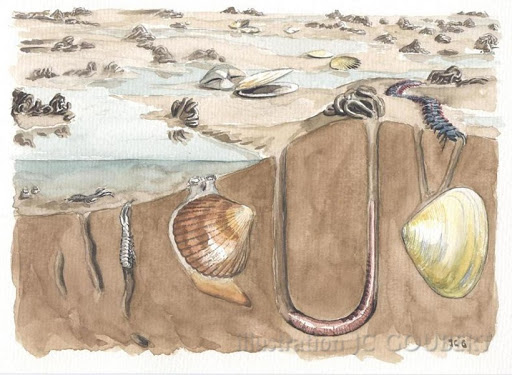
| 10:59, 24 November 2020 | FauneVasiere.jpg (file) |  |
59 KB | Tidal flats are densely populated with organisms such as worms and bivalves that support the estuarine and marine food web. Illustration J-C. Goubert. | 1 |
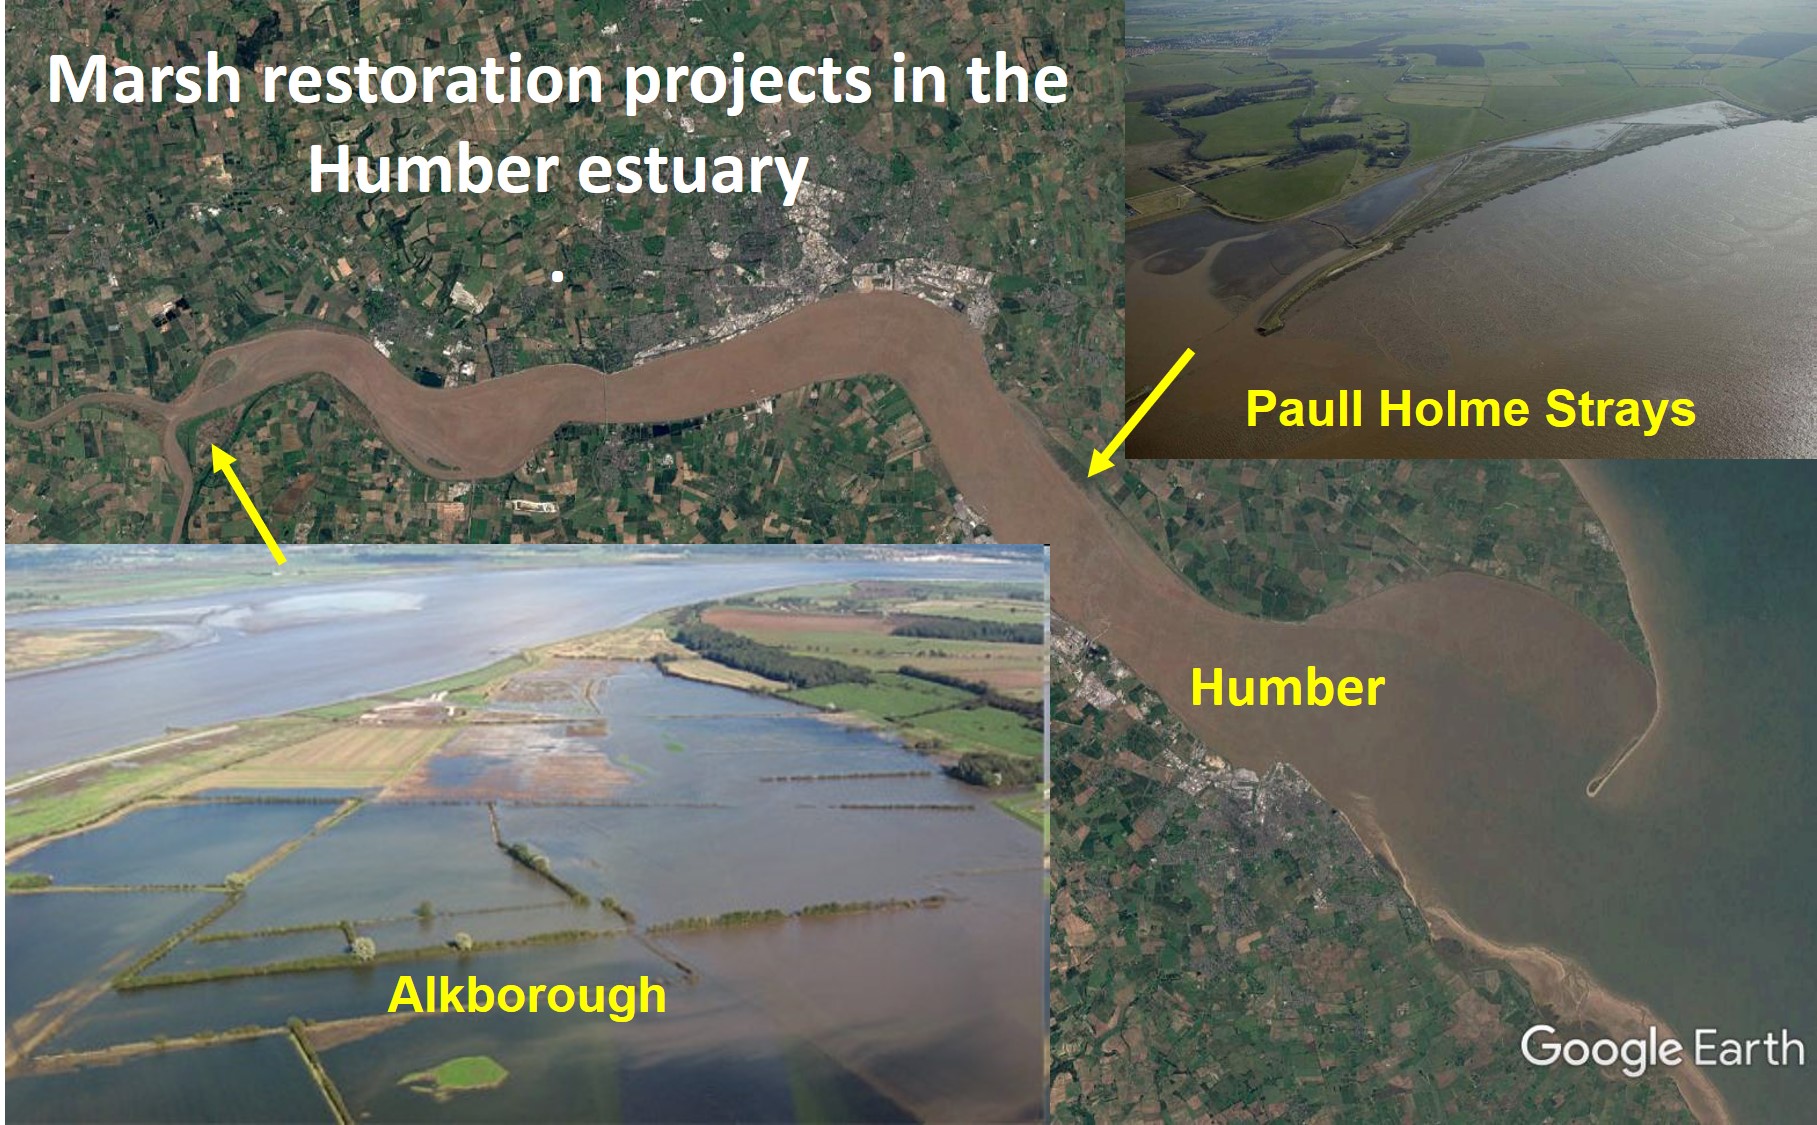
| 17:45, 23 November 2020 | MarshRestorationHumber.jpg (file) |  |
455 KB | Marsh restoration projects in the Humber estuary. | 1 |
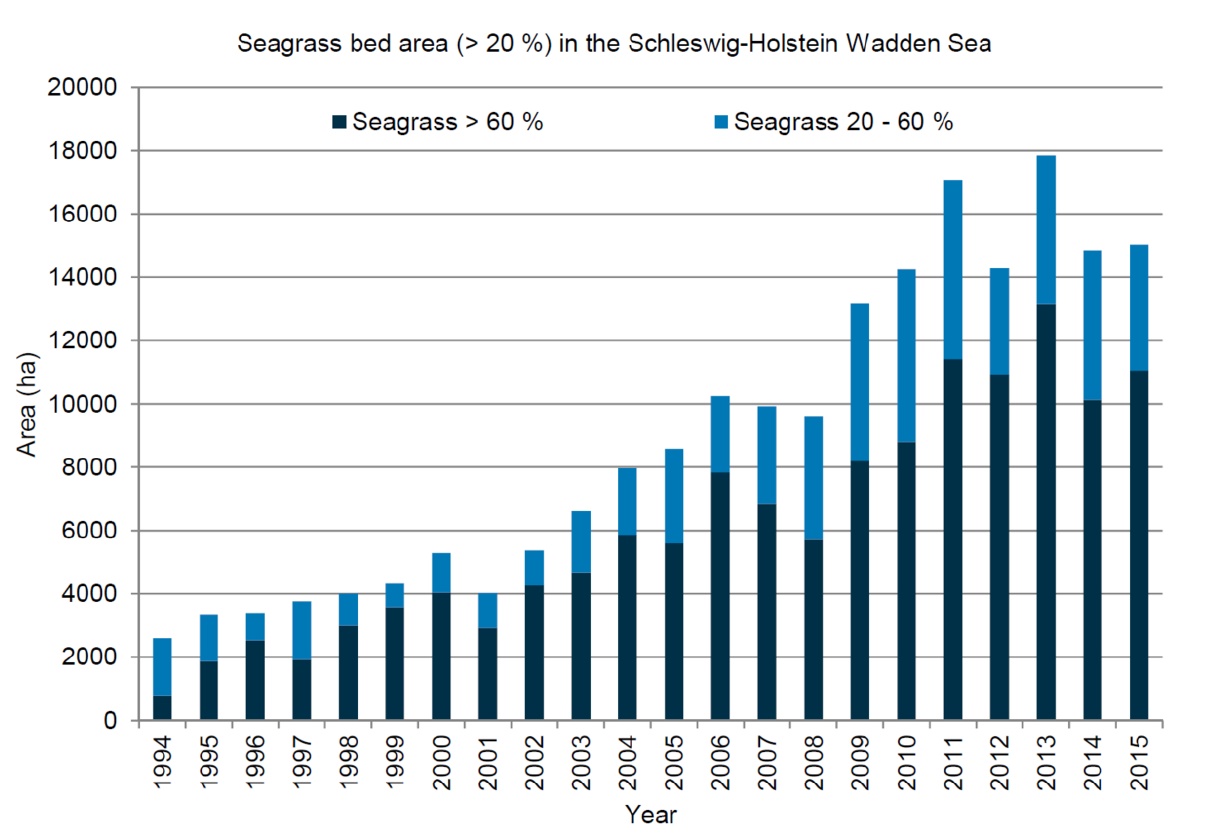
| 16:26, 20 November 2020 | SeagrassWaddenSchleswig-Holstein.jpg (file) |  |
178 KB | Areal size (ha) of seagrass beds (coverage >60% and coverage 20-60%) in the intertidal zone of the Northfrisian Wadden Sea (Schleswig-Holstein) as estimated from aerial surveys in August or September between 1994 and 2015. Source: Wadden Sea Quality St... | 1 |
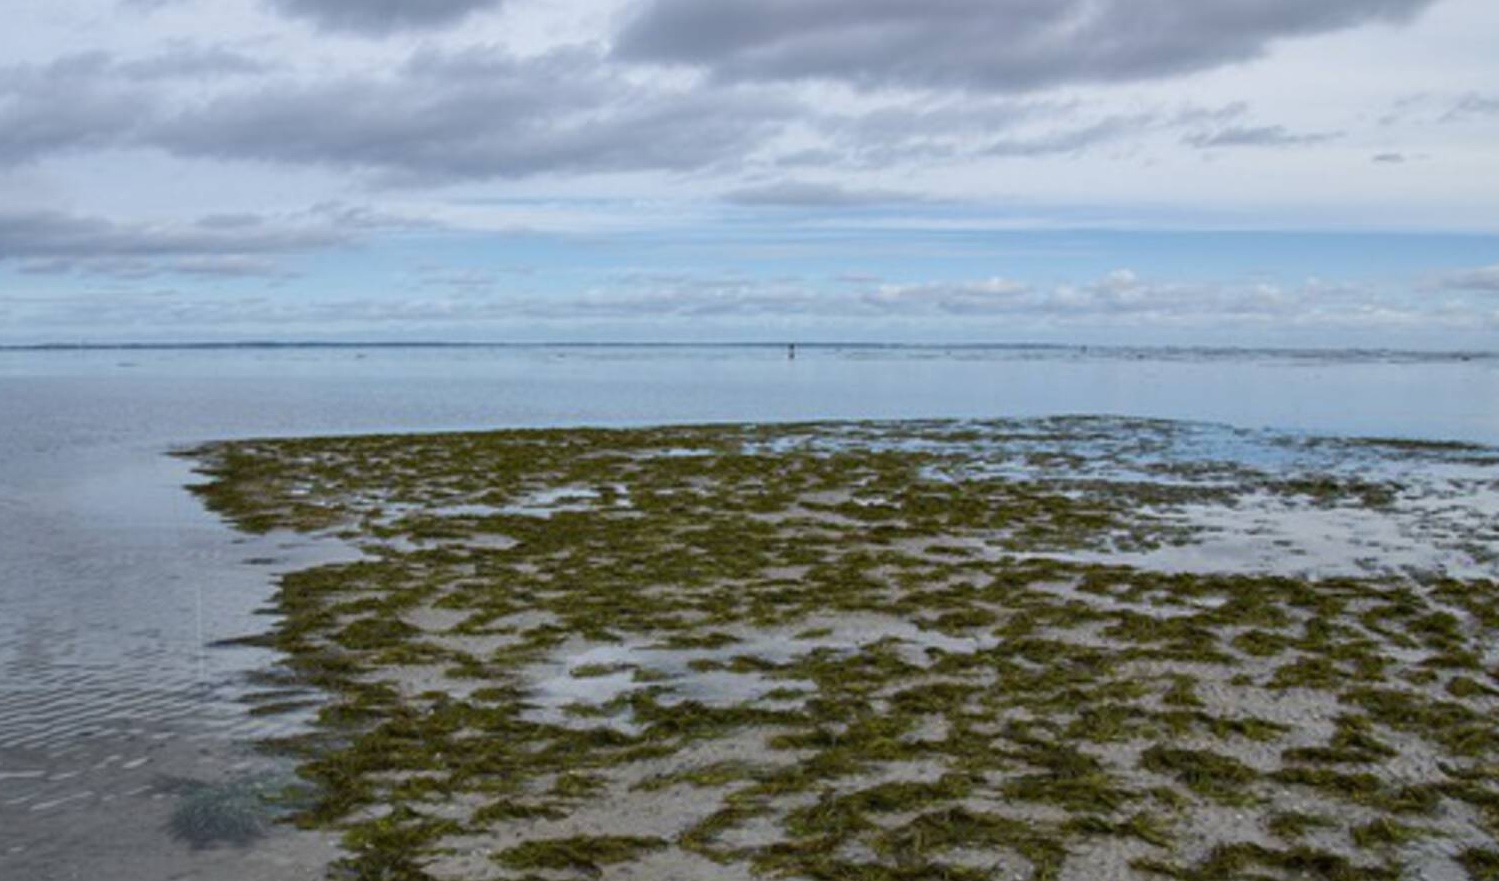
| 16:16, 20 November 2020 | SeagrassWaddenGriend.jpg (file) |  |
297 KB | Seagrass field on an intertidal flat of the Vlie basin in the western Wadden Sea, 3 years after reintroduction. Source: Omroep Fryslan. | 1 |
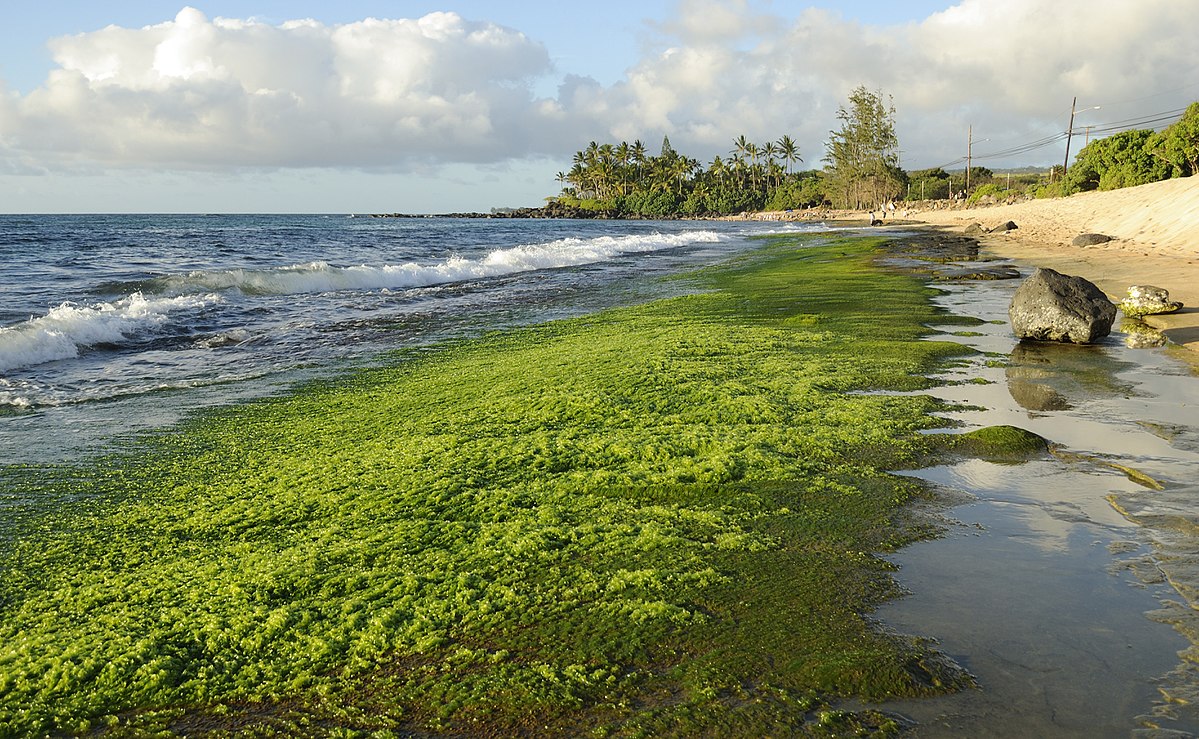
| 22:57, 14 November 2020 | GreenAlgae D Ramirez.jpg (file) |  |
342 KB | Macroalgae washed ashore. Photo credit D. Ramirez | 1 |
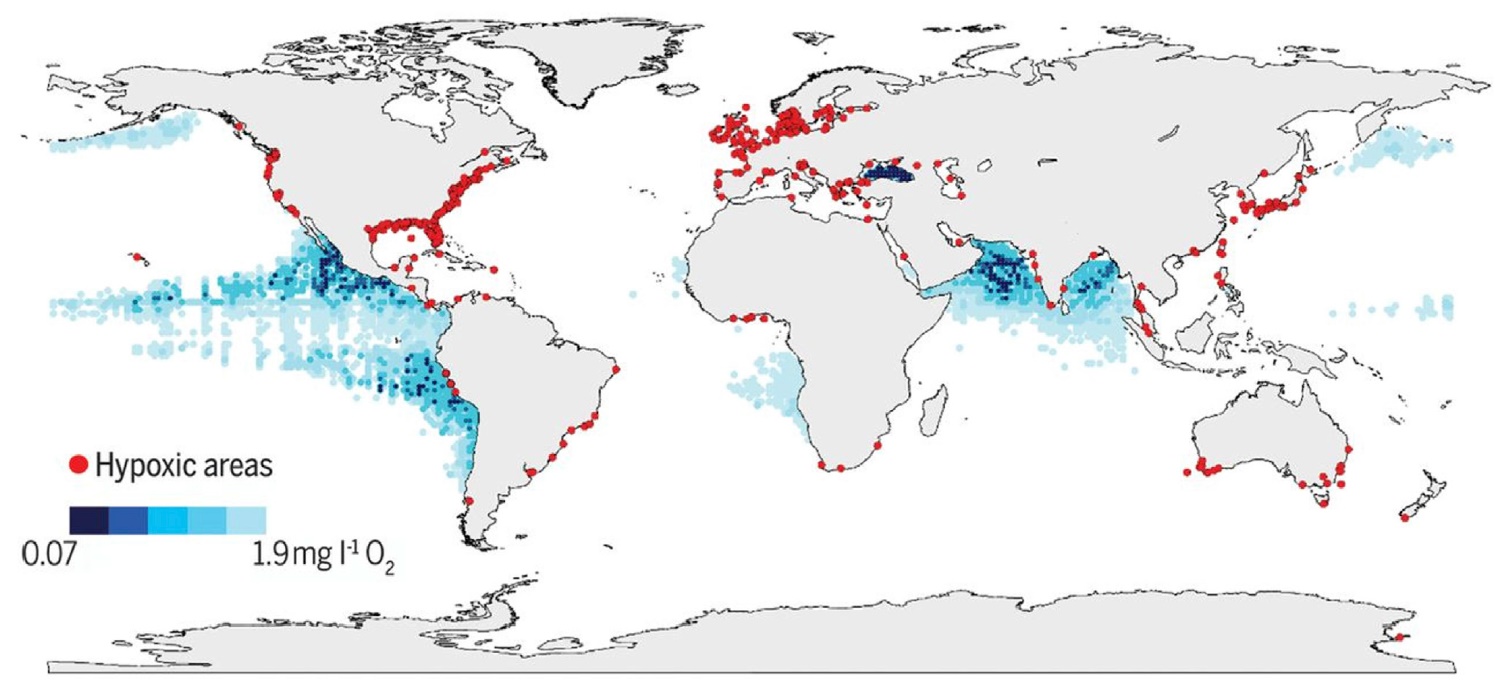
| 15:38, 14 November 2020 | OceanHypoxia.jpg (file) |  |
198 KB | Areas with hypoxia in coastal seas (red) and in the oceans (blue). From IOC-UNESCO 2018 Creative Commons Licence. | 1 |
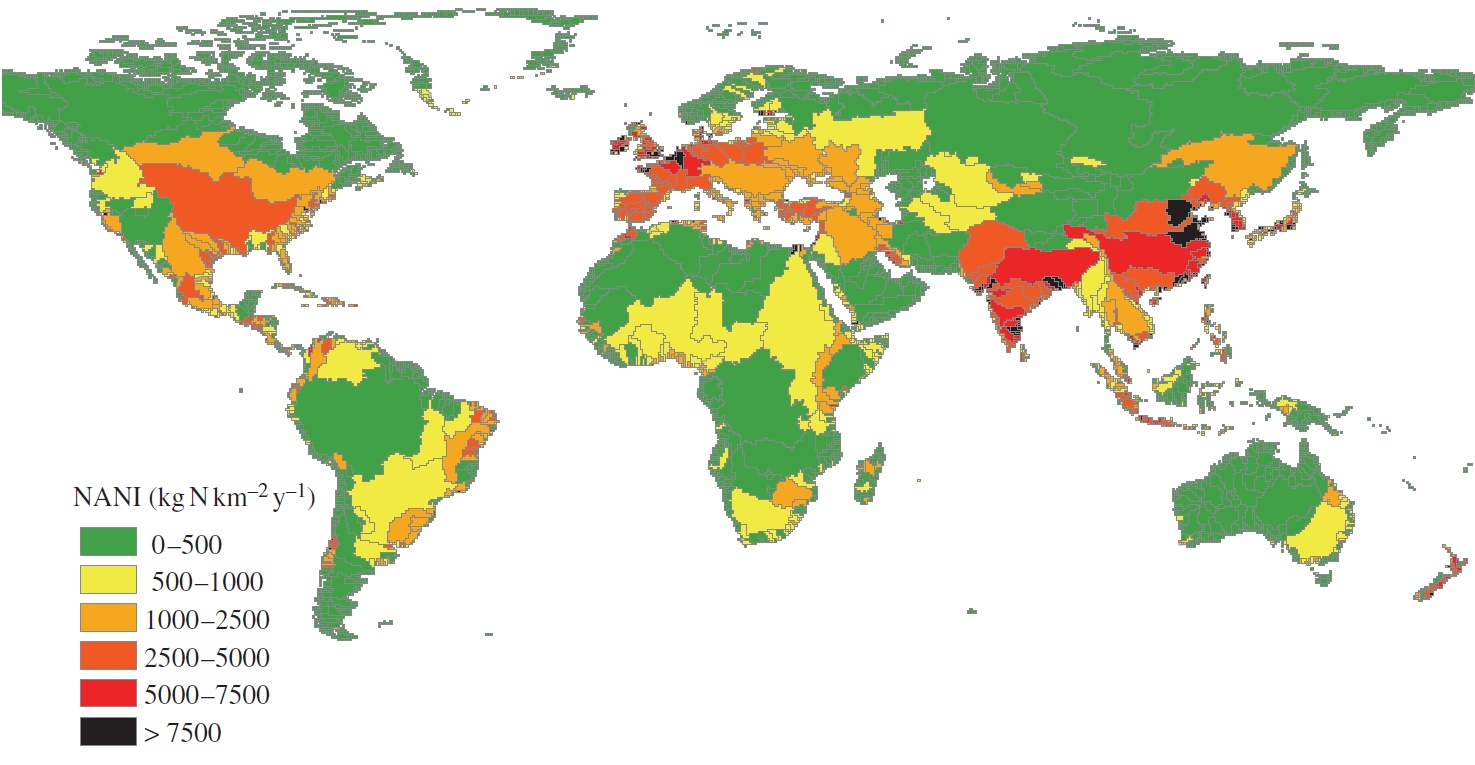
| 16:22, 13 November 2020 | GlobalInputN.jpg (file) |  |
267 KB | Estimated net anthropogenic nitrogen inputs (NANI) according to the world’s main river catchments. Source: Billen et al., 2013. | 1 |
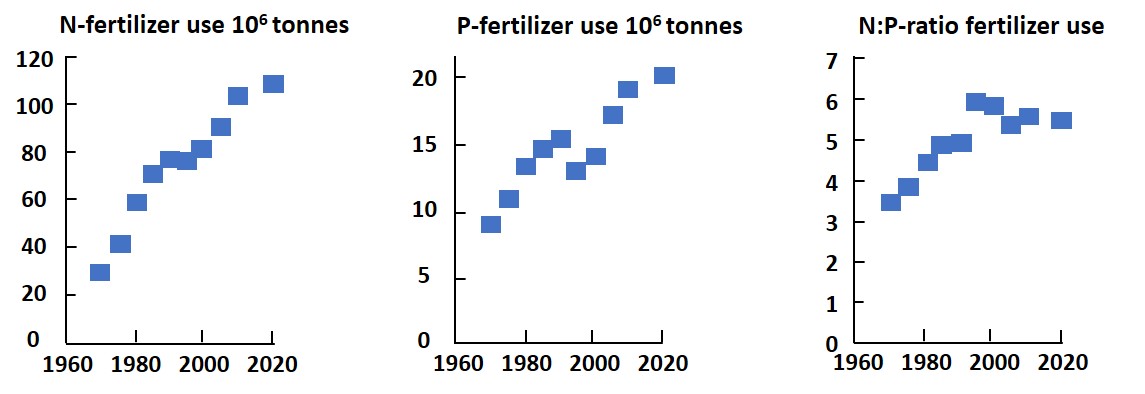
| 22:07, 12 November 2020 | FertilizerUseNP.jpg (file) |  |
58 KB | N and P content of global fertilizer use. | 1 |
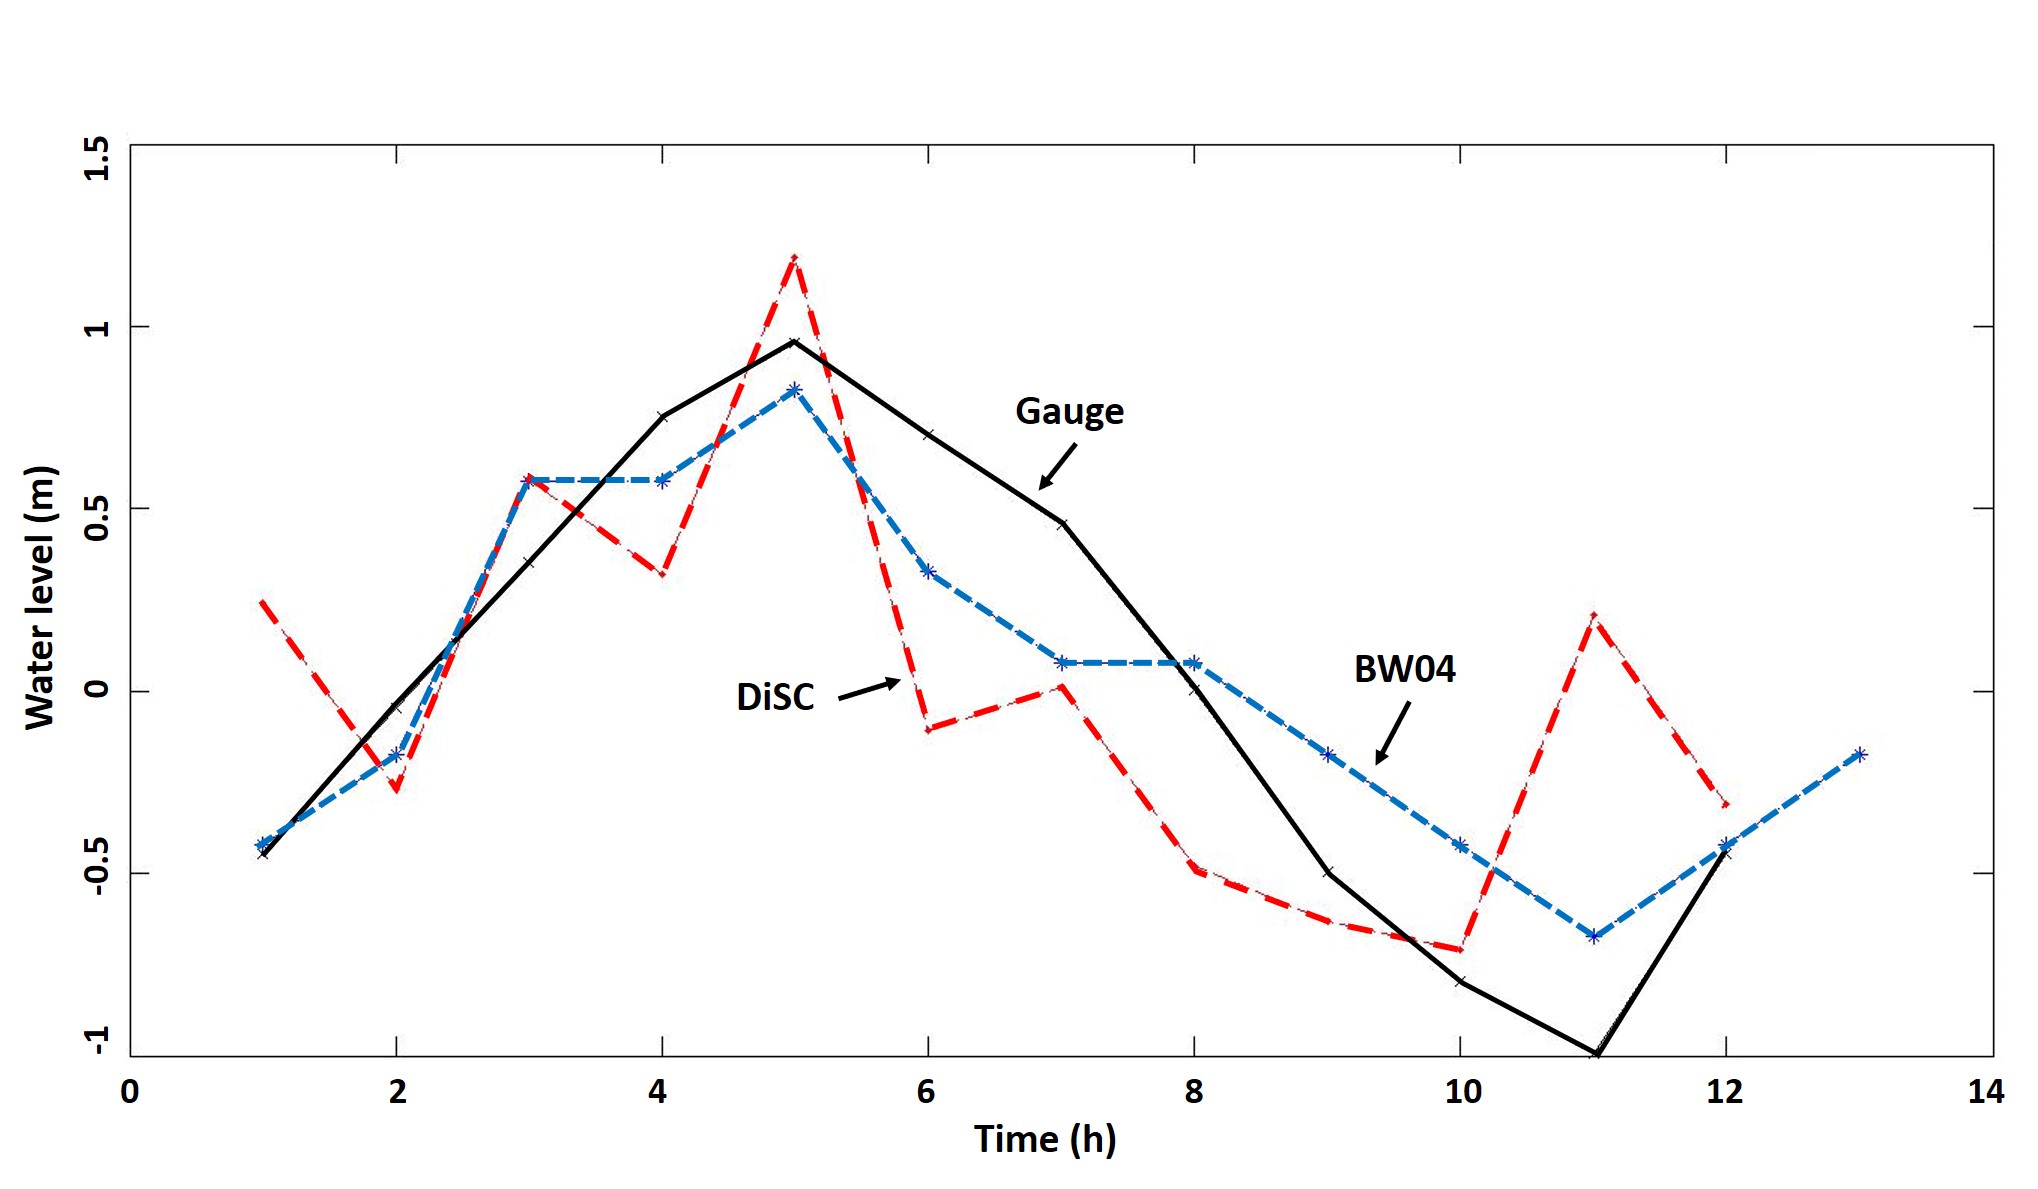
| 11:20, 26 October 2020 | WaterLevels.jpg (file) |  |
163 KB | Time series of water level calculated with BW04, DiSC in the deepest part of the tidal channel together with the measured water level. | 1 |
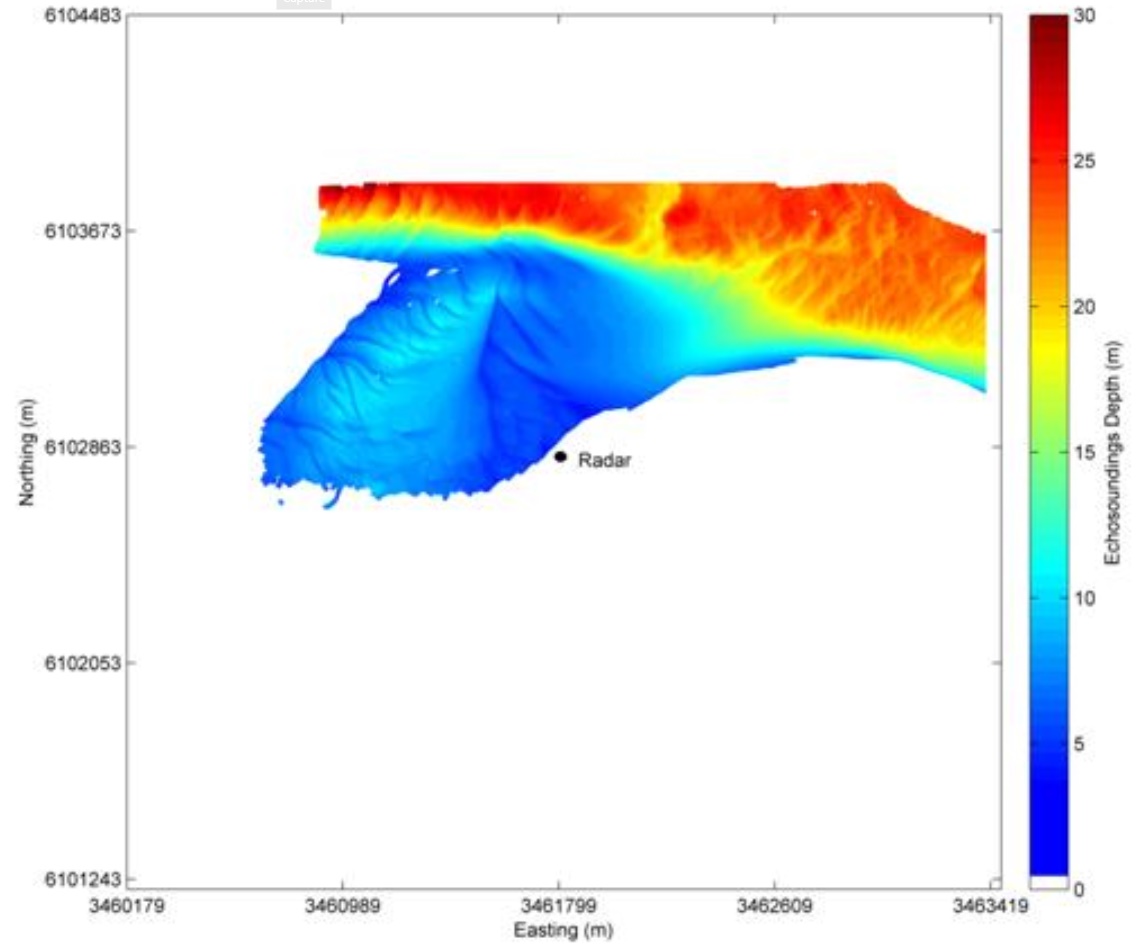
| 10:35, 26 October 2020 | BathyListWest.jpg (file) |  |
107 KB | Bathymetry of area of investigation acquired by multibeam echosounder. | 1 |
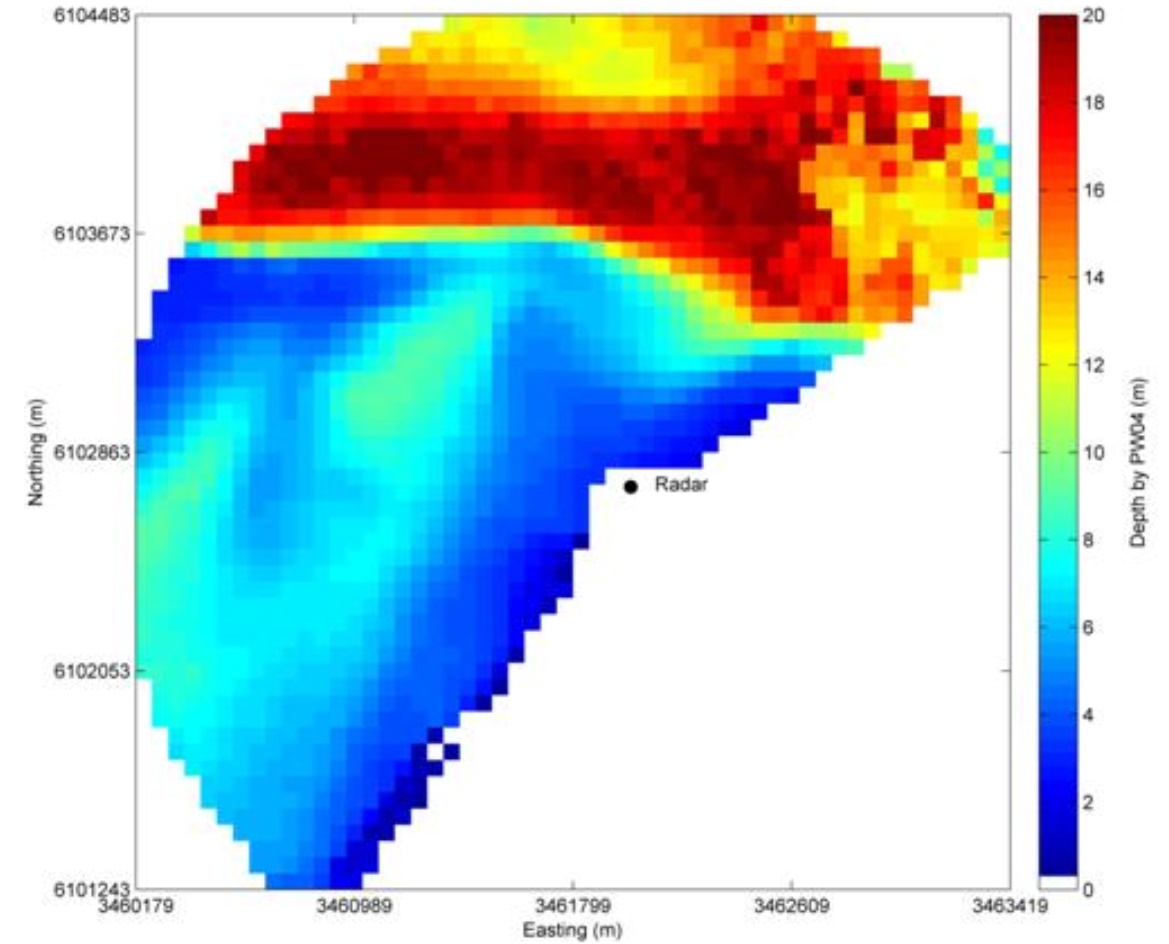
| 10:34, 26 October 2020 | BathyWB04.jpg (file) |  |
150 KB | Averaged bathymetry over 12h obtained from the BW04 method. | 1 |
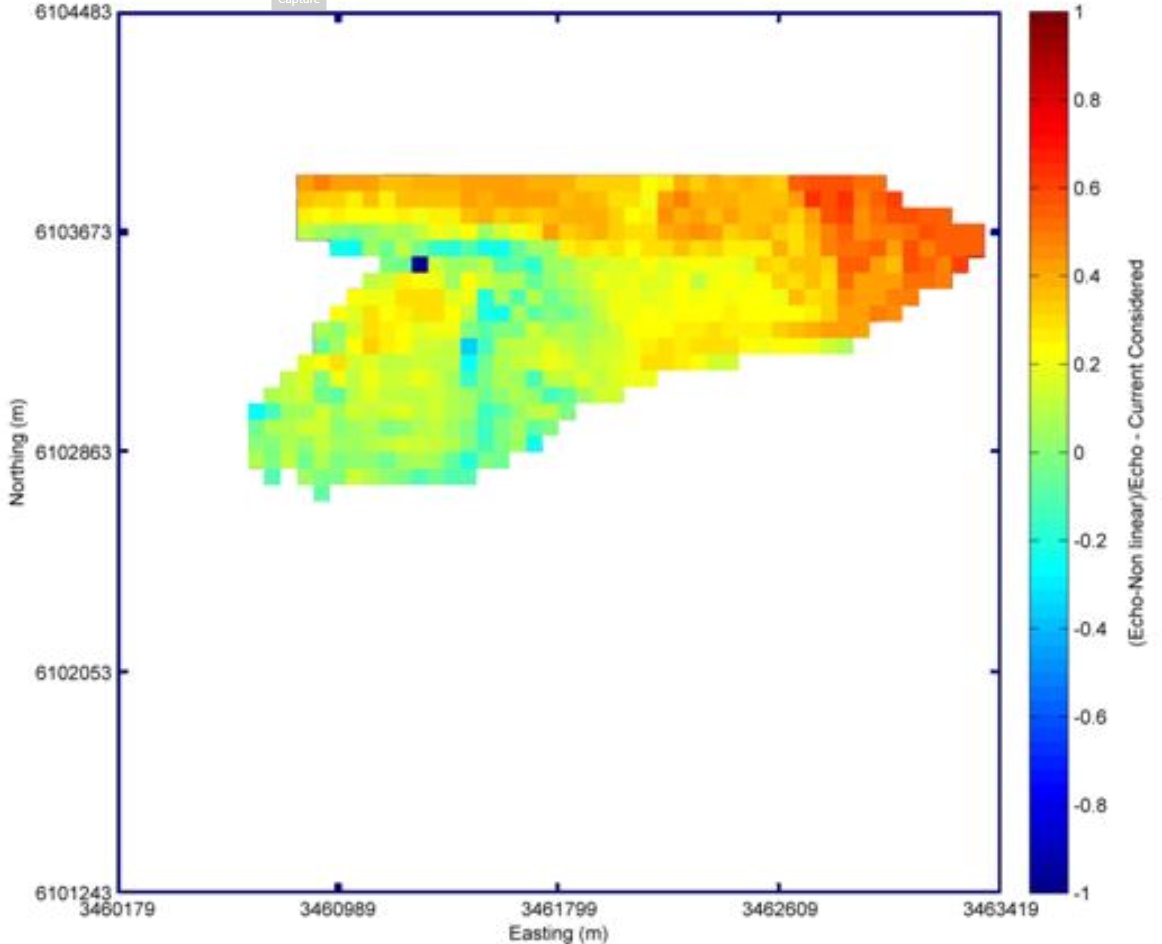
| 10:33, 26 October 2020 | ErrorWB04.jpg (file) |  |
107 KB | Map of the relative error of the BW04 method. | 1 |
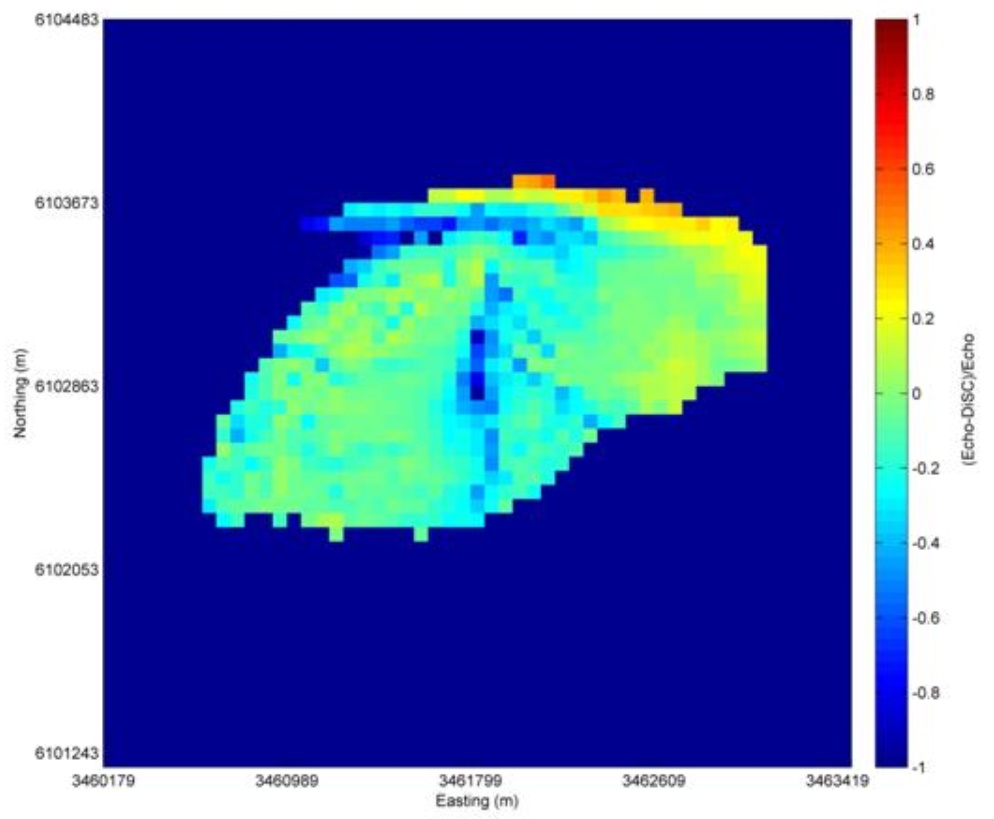
| 10:33, 26 October 2020 | ErrorDiSC.jpg (file) |  |
91 KB | Map of the relative error of the DiSC method. | 1 |
| 20:08, 24 October 2020 | WERAspectrum.jpg (file) |  |
77 KB | Typical backscatter spectrum of sea echoes, normalized to the strongest signal measured by WERA. | 1 |
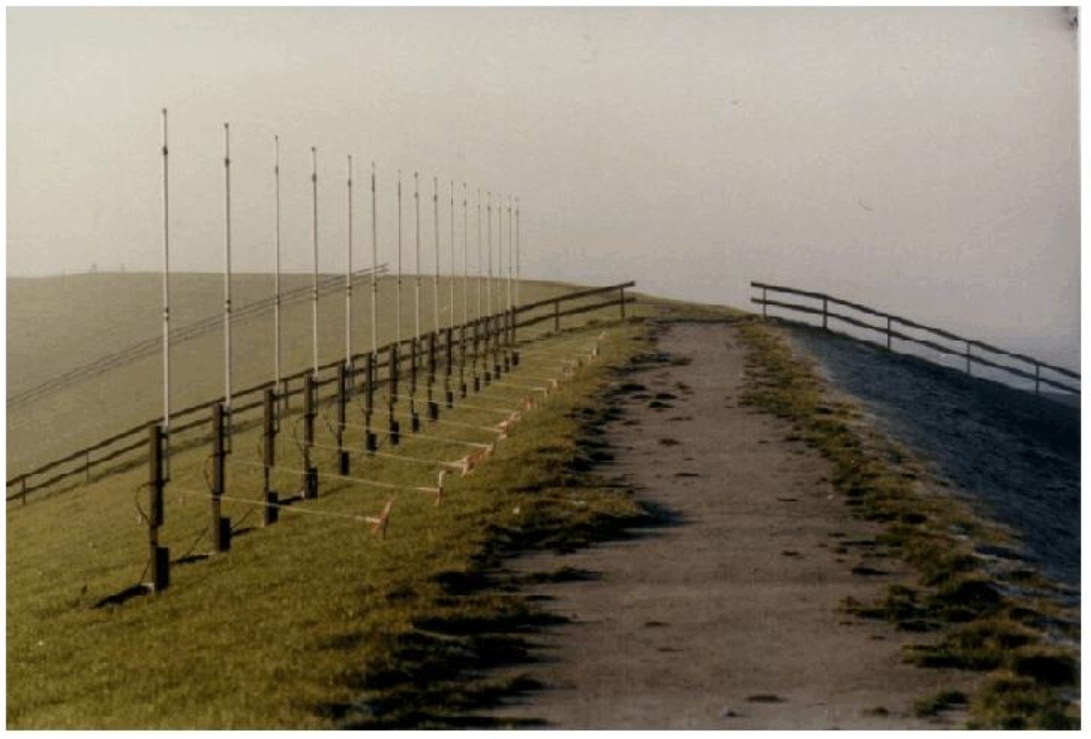
| 20:07, 24 October 2020 | WERAantenna.jpg (file) |  |
162 KB | Typical example of an antenna installation for WERA radar. | 1 |
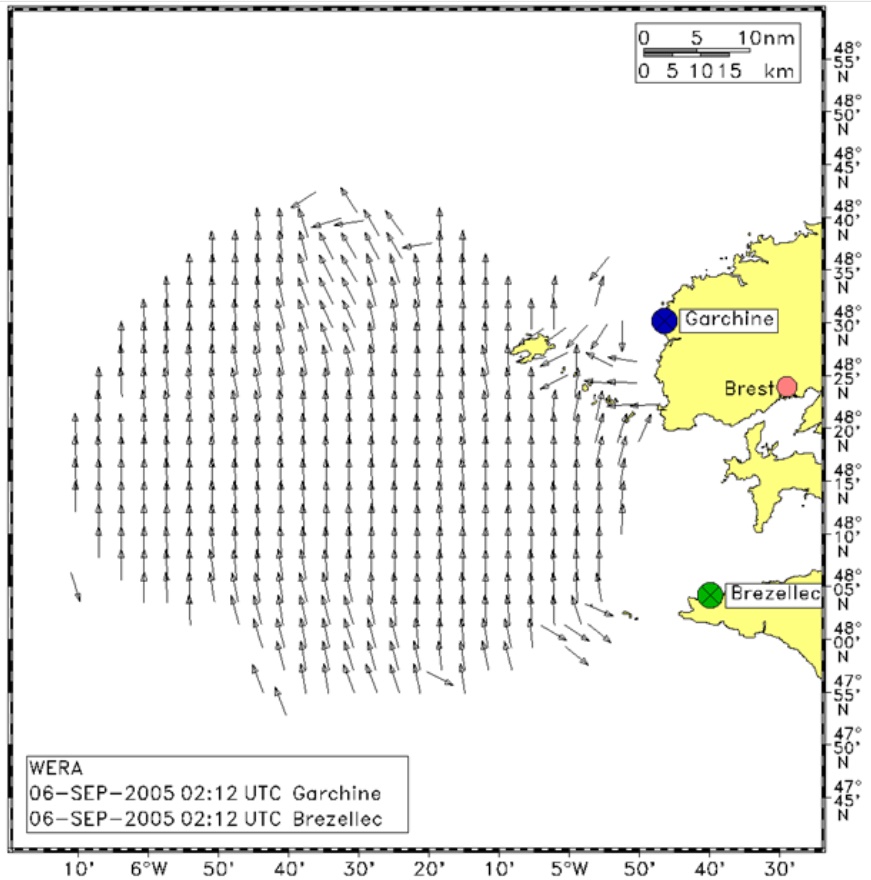
| 20:06, 24 October 2020 | WindFieldOffBrest.jpg (file) |  |
178 KB | Example of measured wind direction measured by HF radar of the coast of Brest (France). | 1 |
| 20:05, 24 October 2020 | WaveFieldOffBrest.jpg (file) |  |
195 KB | Wave field measured by HF radar off the coast of Brest. | 1 |
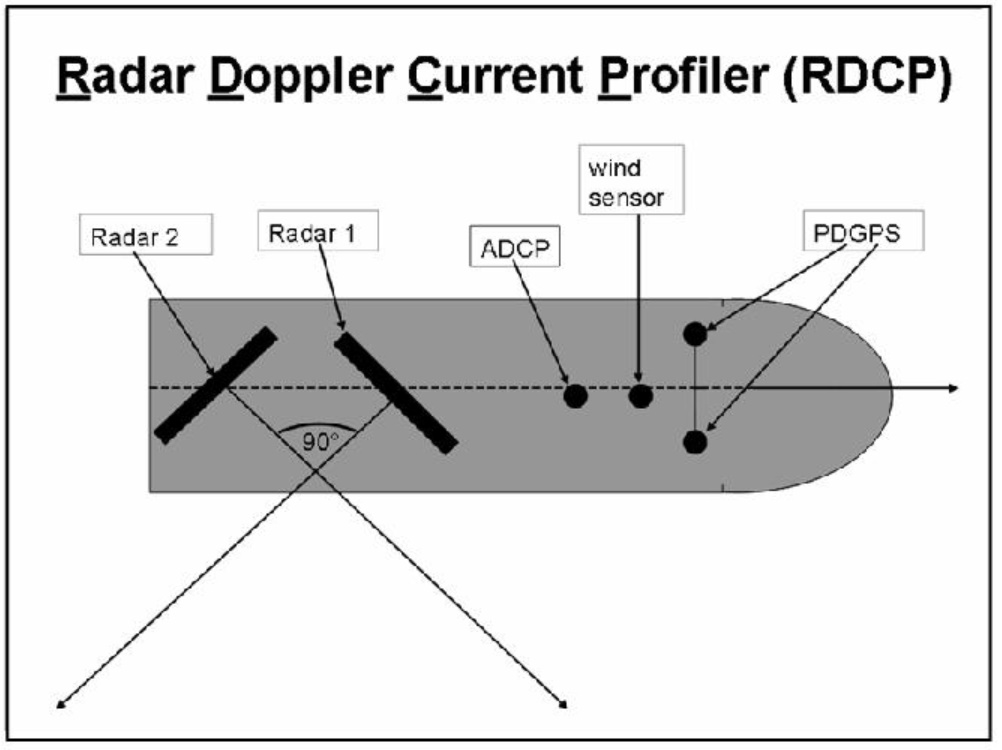
| 20:04, 24 October 2020 | RDCPScheme.jpg (file) |  |
97 KB | Ship with mounted Radar Doppler Current Profiler (RDCP). | 1 |
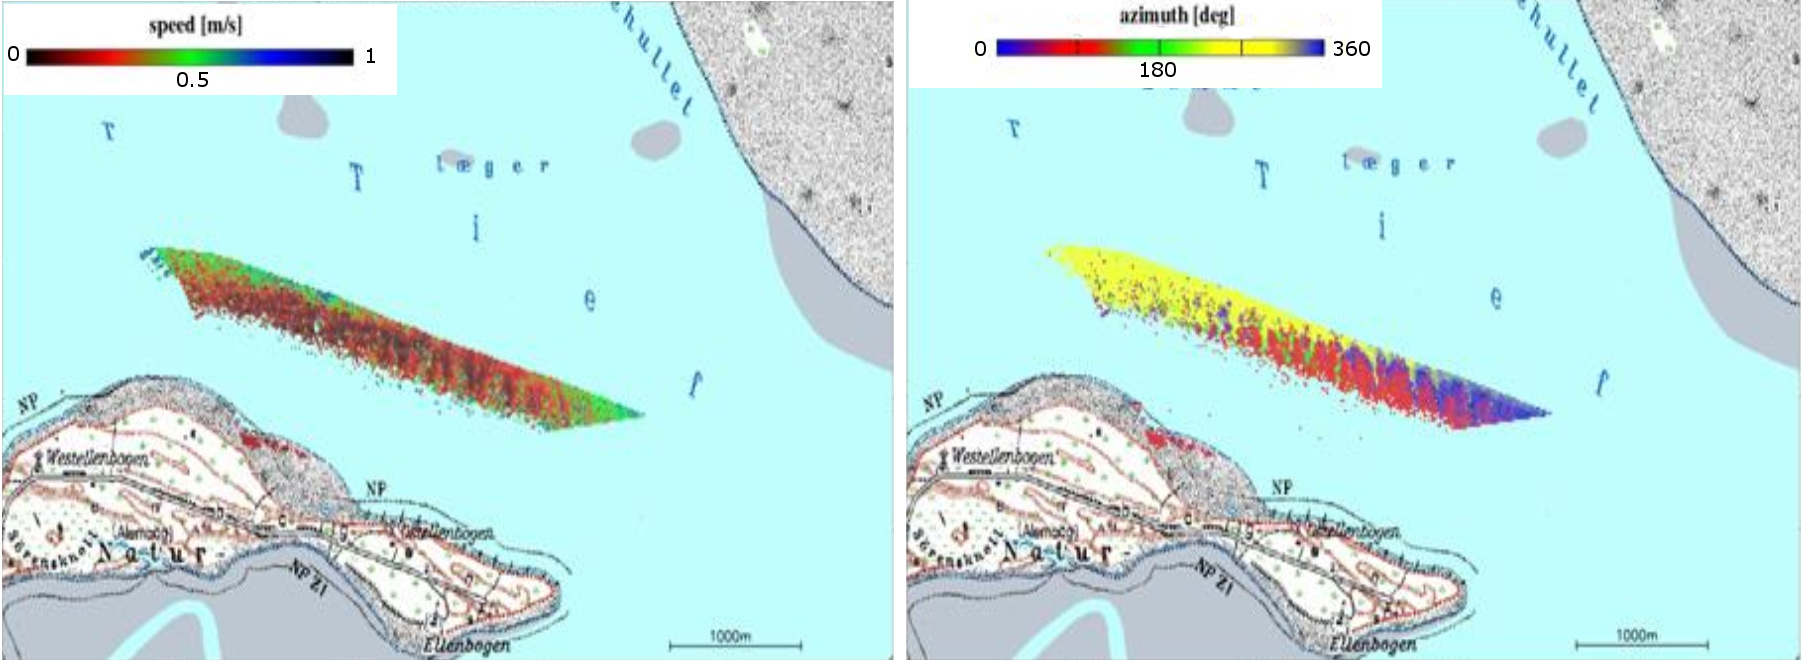
| 20:03, 24 October 2020 | RDCPcurrent.jpg (file) |  |
262 KB | The two maps show the current distribution within a tidal channel in the German bight (Lister Tief) obtained with RDCP. Left panel: current speed; right panel: current direction. | 1 |
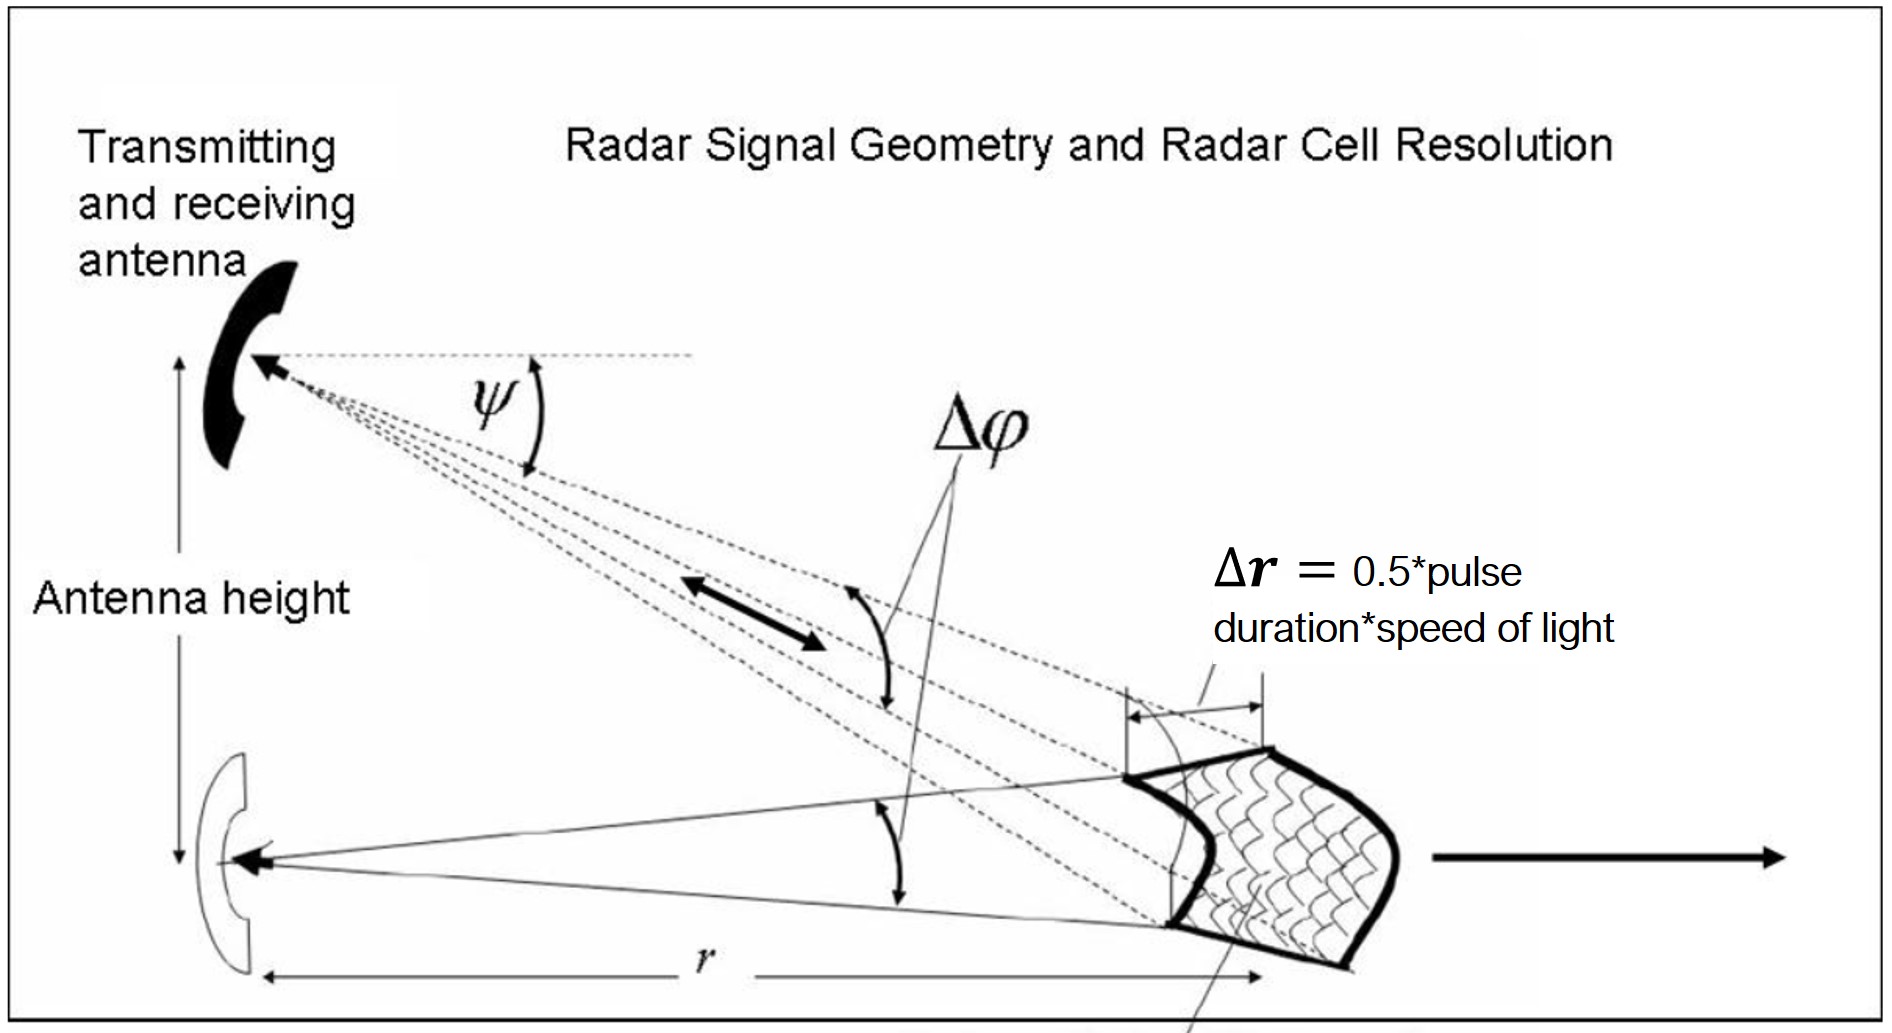
| 20:02, 24 October 2020 | RadarGeometry.jpg (file) |  |
168 KB | Geometry microwave radar. | 1 |
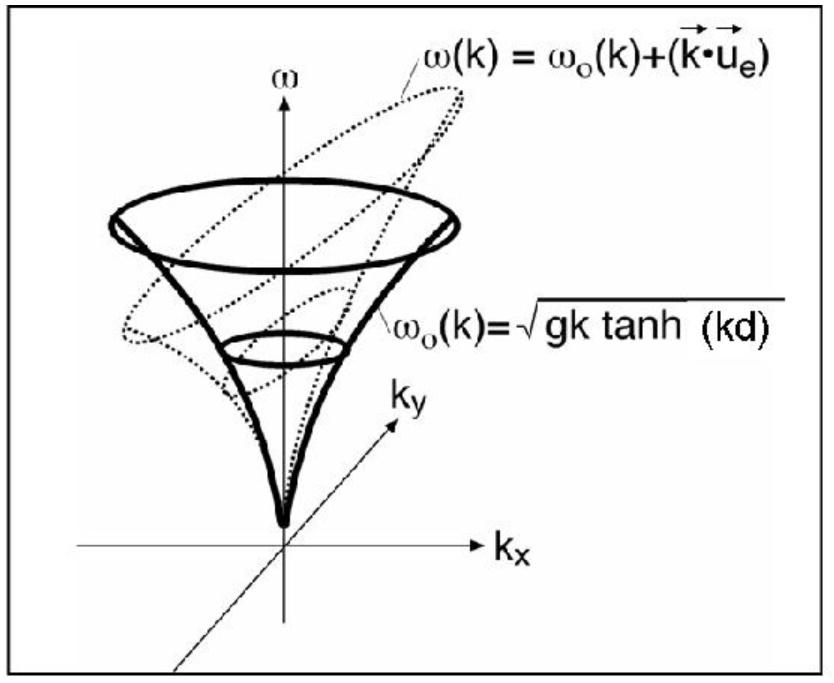
| 19:51, 24 October 2020 | DispersionShell.jpg (file) |  |
78 KB | Gravity wave-dispersion shell in the wave vector-frequency domain . | 1 |
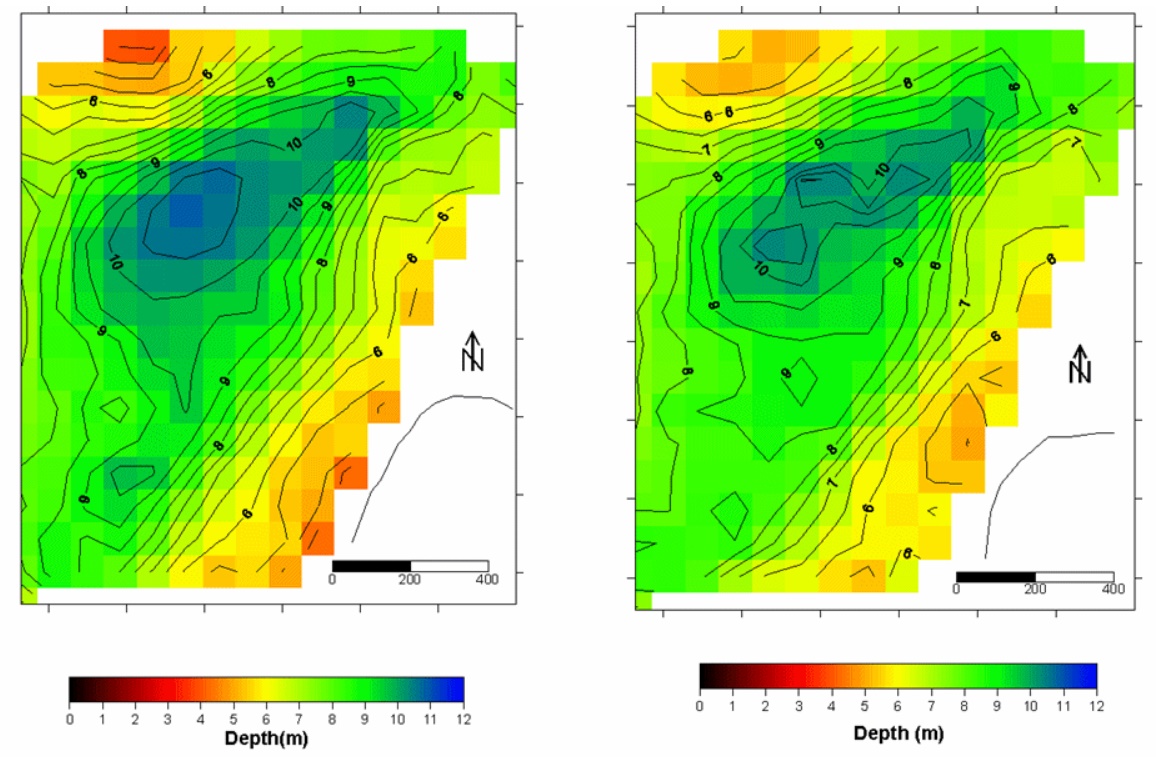
| 19:51, 24 October 2020 | DiSCbathymetries.jpg (file) |  |
272 KB | Bathymetries of List West (north end of the Island Sylt in the German bight) derived by DiSC for February 20 (left) and February 28 (right). | 1 |