Difference between revisions of "Coastal observation systems"
(→Transectional and stationary in situ observations) |
Dronkers J (talk | contribs) |
||
| (106 intermediate revisions by 3 users not shown) | |||
| Line 2: | Line 2: | ||
<p> | <p> | ||
There are a series of objectives why we need to have observational data: to control the outcome of (governmental) monitoring programmes, the obtain data for modelling exercises and to enable scientific analyses of field data to improve our understanding of the marine environment, e.g. to enable assessments of the environmental quality and long term changes. <br> | There are a series of objectives why we need to have observational data: to control the outcome of (governmental) monitoring programmes, the obtain data for modelling exercises and to enable scientific analyses of field data to improve our understanding of the marine environment, e.g. to enable assessments of the environmental quality and long term changes. <br> | ||
| − | To observe our marine environment several options are nowadays available: FerryBoxes, Poles in shallow waters like the Wadden Sea, Gliders, regular ship cruises for vertical resolution of parameters, wave rider buoys, shore based radar like HF and XF, and remote sensing from satellites. A combination of different approaches enables coverage on different time and spatial scales. Several of these observational techniques will be presented through examples of actual measurements. Examples are taken from the [ | + | To observe our marine environment several options are nowadays available: FerryBoxes, Poles in shallow waters like the Wadden Sea, Gliders, regular ship cruises for vertical resolution of parameters, wave rider buoys, shore based radar like HF and XF, and remote sensing from satellites. A combination of different approaches enables coverage on different time and spatial scales. Several of these observational techniques will be presented through examples of actual measurements. Examples are taken from the [https://www.hzg.de/institutes_platforms/cosyna/index.php.de COSYNA] integrated observation system developed by [http://www.hzg.de/ HZG] together with other German research institutes during the last years. |
<p> | <p> | ||
<br> | <br> | ||
| Line 43: | Line 43: | ||
<p> | <p> | ||
{| align ="center" style="text-align:center; font-size:85%" | {| align ="center" style="text-align:center; font-size:85%" | ||
| − | |[[Image:Ferrybox 3.jpg|center| | + | |[[Image:Ferrybox 3.jpg|center|420px]] |
|- | |- | ||
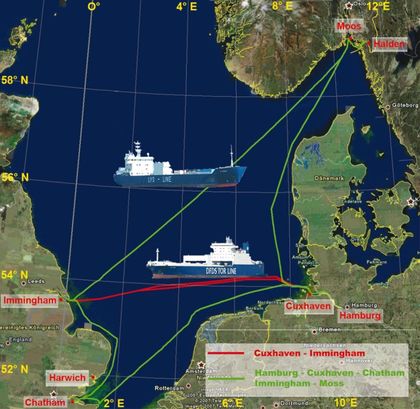
| − | |Current FerryBox transects in the southern North Sea operated by | + | |Current FerryBox transects in the southern North Sea operated by HZG: <br> Route Cuxhaven - Immingham: RoRo-ship TorDania, <br> Route Gemany - England - Norway: cargo ship LysBris. |
|} | |} | ||
<p> | <p> | ||
<br> | <br> | ||
<p> | <p> | ||
| + | The FerryBox technology developed by HZG works so well - especially due to the integrated anti-fouling system - that it is used not only on ships but as well at any station that has enough power to run the necessary pumps. Therefore, these 'stationary FerryBox systems' have been installed in the stations 'Cuxhaven' and 'Fino-3'. Our partner AWI installed one FerryBox on their shore station at Helgoland. The design and the parameters are the same as on the ship-borne FerryBox systems. | ||
| + | The pictures bellow show salinity data from a transect in the southern North Sea between Germany (Cuxhaven) and the UK (Immingham) during the period from March till November 2008 and a graph showing a single transect and the concomitant remote sensing picture of the southern North Sea for the parameter chlorophyll-a. | ||
| + | <p> | ||
| + | <br> | ||
| + | <p> | ||
| + | {| align ="center" style="text-align:center; font-size:85%" | ||
| + | |[[Image:Salinity_data_from_a_transect_in_the_southern_North_Sea.jpg|center|341px]] | ||
| + | |[[Image:Remote sensing picture of the southern North Sea for the parameter chlorophyll-a.jpg|center|330px]] | ||
| + | |- | ||
| + | |Salinity data from a transect in the southern North Sea <br> between Germany (Cuxhaven) and the UK (Immingham) <br> from March till November 2008. | ||
| + | |Valign="top"|Single transect and the concomitant remote sensing picture <br> of chlorophyll-a in the southern North Sea. | ||
| + | |} | ||
| + | <p> | ||
| + | <br> | ||
| + | <p> | ||
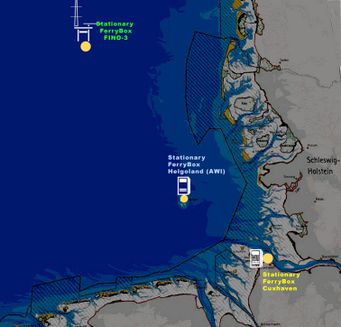
| + | Apart from FerryBoxes on board ships of opportunity the possibility exists to install FerryBoxes stationery at selected locations. Currently installations at three locations along the river Elbe (Cuxhaven), on the island of Helgoland and on a research platform (FINO-3) are in operation (see map). | ||
| + | |||
| + | {| align ="center" style="text-align:center; font-size:85%" | ||
| + | |[[Image:Stationery_FerryBoxes_in_the_Wadden_Sea_area.jpg|center|341px]] | ||
| + | |- | ||
| + | |Map indicating the locations where [[FerryBox_-_Continuous_and_automatic_water_quality_observations_along_transects|FerryBoxes]] are installed (yellow dots) | ||
| + | |} | ||
| + | <p> | ||
| + | <br> | ||
| + | <p> | ||
| + | |||
| + | == Stationary in situ Observations == | ||
| + | <p> | ||
| + | ===Wadden Sea Poles=== | ||
| + | <p> | ||
| + | {| align="right" style="text-align:center; font-size:85%; margin-left: 5px " | ||
| + | |[[Image:A Wadden Sea Pole.jpg|450px]] | ||
| + | |- | ||
| + | |A picture of a Wadden Sea Pole the different censors are indicated. | ||
| + | |} | ||
| + | |||
| + | High-frequent water quality data are a prerequisite for an assessment of the substance exchange between [[North Sea]] and Wadden Sea.<br> | ||
| + | Parameters measured are pressure (depth), water temperature, conductivity, current velocity/direction, turbidity, chlorophyll-a-fluorescence, photosynthetic active radiation, pH-value, oxygen, and meteorology (pressure, temperature, wind speed, humidity, irradiation and precipitation). An example of such as complete pole is shown in the diagram. | ||
| + | <p> | ||
| + | The continuously operating reference network of COSYNA is built from fixed platforms producing high-resolution time series of meteorological, oceanographic and water quality parameters. They yield insights into the system’s variability on time scales ranging from seconds to years. In the German Bight, existing and planned off-shore platforms, e.g., FINO3 and wind energy installations will provide power and broadband capacities to operate FerryBoxes and wave radars. Smaller, self-contained poles in the Wadden Sea (see figure above) and the mouth of the Elbe record data through which to study the exchange of energy and matter between the shallow, intertidal near-coast basins and the German Bight. | ||
| + | <p> | ||
| + | In the shallow areas of the Wadden Sea poles enable the automated measurement of different parameters. Energy supply is by solar panels. All data are transmitted to shore. | ||
| + | {| align="right" style="text-align:center; font-size:85%; margin-left: 5px " | ||
| + | |[[Image:Spiekeroog_pole.jpg|200px]] | ||
| + | |- | ||
| + | |The Spiekeroog Pole | ||
| + | |} | ||
| + | <p> | ||
| + | <br> | ||
| + | <p> | ||
| + | |||
| + | ===Spiekeroog Pole=== | ||
| + | <p> | ||
| + | Since autumn 2002, the ICBM, University of Oldenburg, has been running the research platform Spiekeroog. In the framework of COSYNA the station is modernized by applying new technical concepts and new instruments. The complete update of the research platform should be finished at the end of the year 2012. | ||
| + | <p> | ||
| + | <br> | ||
| + | <p> | ||
| + | ===Exemplary results=== | ||
| + | <p> | ||
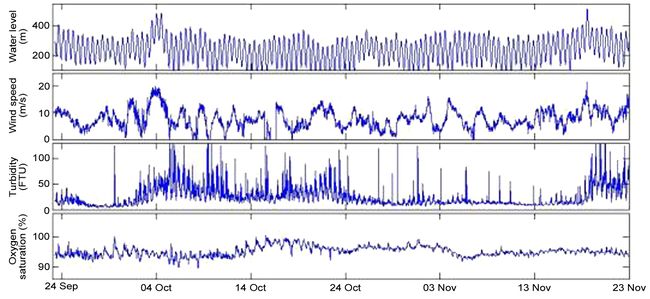
| + | The figure bellow depicts a typical high-resolution 10 min time series, measured in the Hörnum Deep, south of Sylt Island. From top to bottom, data on water level, wind speed, turbidity and oxygen saturation are shown for two months. One can see that high wind speeds, e.g., during 4 October, 2009 and 19 November, 2009, influenced not only the water level (inflow of North Sea water into the Hörnum Deep), but also led to higher erosion rates that are mirrored by an increase in turbidity. | ||
| + | <p> | ||
| + | <br> | ||
| + | <p> | ||
| + | {| align ="center" style="text-align:center; font-size:85%" | ||
| + | |[[Image:Typical high-resolution 10 min time series, measured in the Hornum Deep.jpg|center|650px]] | ||
| + | |- | ||
| + | |Typical high-resolution 10 min time series, measured in the Hörnum Deep. | ||
| + | |} | ||
| + | <p> | ||
| + | <br> | ||
| + | <p> | ||
| + | == Gliders == | ||
| + | <p> | ||
| + | {| align ="right" style="text-align:center; font-size:85%; margin-left:5px" | ||
| + | |[[Image:glider2.jpg|center|250px]] | ||
| + | |- | ||
| + | |The underwater glider | ||
| + | |} | ||
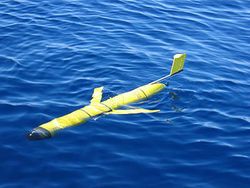
| + | The underwater glider, or glider in short, is an autonomous underwater vehicle. It works buoyancy driven and is extremely energy efficient. | ||
| + | <br> | ||
| + | The underwater glider, or glider in short, is a relatively new measurement platform, and originally developed as a low-cost, long-endurance device for observing the oceans. Being a host for a multitude of sensors, such as CTD, optical backscatter, and fluorescence sensors, gliders can be programmed to follow set way-points. Depending on the sensor payload and battery type, glider missions may last from a couple of weeks to a couple of months. During the mission, the glider pilot can adjust sampling strategies, way-points, etc. from behind his/her desk using a satellite link to communicate with the glider. Concurrently, whilst in operation, (a subset of the) data can be sent to a land-based server via a satellite link, providing scientists with near-real time data. | ||
| + | <p> | ||
| + | <br> | ||
| + | <p> | ||
| + | ===Concept of operation=== | ||
| + | <p> | ||
| + | In contrast to conventional underwater vehicles, the glider has no propeller. Instead, the glider has a buoyancy engine, which allows the glider to control its buoyancy by +/- 250 g. Consequently, the glider can attain a vertical motion up or down, depending on its buoyancy. A pair of wings converts a part of the vertical velocity into forward motion. As a result, the glider profiles the water column in a saw-tooth manner. Its low cruising speed of about 40 cm/s makes the glider extremely efficient and operates at about 1-2 Watts, giving the glider the unique endurance. A glider at the surface is shown above. It is envisioned to include glider technology in the COSYNA observatory. Due to the adverse conditions in the North Sea (strong currents, high-volume ship traffic), first a pilot project will be conducted. A first test has recently been completed. Deployed from Helgoland, HZG's first glider Amadeus flew a 15 day mission during the second half of February 2011, travelling over 300 km, and enduring effortlessly a more or less continuous winter storm. | ||
| + | {| align ="right" style="text-align:center; font-size:85%; margin-left:5px" | ||
| + | |[[Image:Data_collected_with_the_glider.jpg|center|350px]] | ||
| + | |- | ||
| + | |Data collected using the glider during a 15 day test. | ||
| + | |} | ||
| + | <p> | ||
| + | <br> | ||
| + | <p> | ||
| + | ===First Results=== | ||
| + | <p> | ||
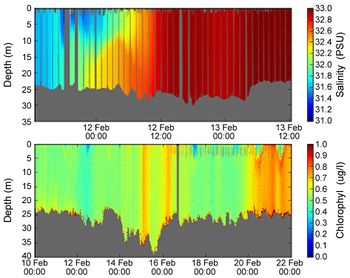
| + | Data collected during this mission are shown in the figure below. The upper panel shows salinity, computed from the CTD's conductivity, temperature and pressure for a two-day period around 12 February. Due to strong mixing as a result from currents and windforcing and lack of a thermocline (as it was winter), most of the time the water column is well-mixed. Around 12 February, however, the glider crossed a front. The top panel shows the detailed recordings of the horizontal and vertical gradients in salinity at the location of the front. The bottom panel shows the concentrations of chlorophyll-a for the whole mission period. Because of the winter season, the concentrations are low. During the course of the mission, some variability in chlorophyll is observed. Further analysis should distinguish between geographical and temporal effects. | ||
| + | <p> | ||
| + | <br> | ||
| + | <p> | ||
| + | <br style="clear:both;"/> | ||
| + | == Surveys with Research Vessels == | ||
| + | {| align ="left" style="text-align:center; font-size:85%; margin-right:5px" | ||
| + | |[[Image:Scanfish.jpg|250px]] | ||
| + | |- | ||
| + | |Example of scanfish recordings | ||
| + | |} | ||
| + | |||
| + | Regular ship cruises on a fixed criss-cross track across the German Bight provide a quasi-synoptic overview of the German Bight from time to time. | ||
| + | The surveys interpolate spatially observed variables between the fixed stations and add vertical depth information to the surface FerryBox and remote sensing data. | ||
| + | The research vessels are equipped with a FerryBox, Acoustic Doppler Current Profiler (ADCP), [[Use_of_ground_based_radar_in_hydrography#Mapping_by_Radar_Doppler_Current_Profiler_.28RDCP.29|Radar Doppler Current Profiler]] (RDCP), profiling water samplers and an undulating towed instrument carrier (‘Scanfish’). | ||
| + | |||
| + | Cruises by research ships across the German Bight complement the regular in situ stationary and ship of opportunity observations. They provide a quasi-synoptic overview of the German Bight from time to time. The chosen criss-cross ship-track of RV ‘Heincke’ (see figure below) contacts the fixed COSYNA and state monitoring BSH-MARNET stations and catches the East-West and South-North cross-shore gradients in the German Bight. Additional near-transects are carried out using the smaller RV ‘Ludwig Prandtl’ (figure). The research vessels are equipped with a FerryBox, profiling water samplers and an undulating towed instrument carrier (‘Scanfish’,™ see below). | ||
| + | |||
| + | <p><br><p> | ||
| + | These surveys thus fulfil several purposes simultaneously: | ||
| + | * Interpolating spatially observed variables between the fixed stations | ||
| + | * Adding vertical depth information to the surface FerryBox and remote sensing data | ||
| + | * Calibrating instruments by well-controlled in situ water samples | ||
| + | * Testing of new sensor packages to be included later in the pre-operational observation mode | ||
| + | * Enabling additional process studies with the support of voluminous information from the standard COSYNA equipment running on board. | ||
| + | <p> | ||
| + | During the cruises, the central set of data is recorded by the “SCANFISH”, a multi-instrument platform towed behind the vessel. Undulating up and down movement is generated by moving flaps and ongoing changing the cable length. Maximal operational vessel speed is about 10 knots. In this way a “saw-tooth” chain of observation points is generated over most part of the water column along the ship track. At maximal operational vessel speed of 10 knots, vertical movements of 1 ms-1 and sensor recording frequencies of 12 Hz, the observational resolution is about 10 cm in the vertical and typically 150 m in the horizontal. | ||
| + | |||
| + | <p> | ||
| + | <br> | ||
| + | <p> | ||
| + | |||
| + | ===Vertical Multi-instrument Profiler=== | ||
| + | |||
| + | <p> | ||
| + | |||
| + | Optical and acoustical instruments on-board the Scanfish record proxies that must be related in a further processing step to the [[biotic]] and [[abiotic]] substances present in the water: optical [[turbidity]] to the concentration of total suspended matter or fluorescence to the concentration of chlorophyll a pigments. The ongoing undulation motion during the cruises make the taking of water samples very difficult and would demand e.g. the use of a voluminous combined cable-water house tube '''(citation IOW)'''. Instead, we decouple the taking of water samples from the enduring Scanfish operation. At selected stations, when the vessel stops, a vertical profiler equipped with instrumentation identical to the Scanfish is lowered. In addition it contains the water samplers that are filled by a motor driven pumping system over a time range of up to one minute. In this way concentration fluctuations of the suspended matter are averaged out and an exact timing between sampling and sensor recording is achieved. | ||
| + | <p> | ||
| + | <br> | ||
| + | <p> | ||
| + | |||
| + | ===Other Instruments=== | ||
| + | <p> | ||
| + | During RV Heincke measuring campaigns the following instruments are operated: | ||
| + | * Acoustic Doppler Current Profiler (ADCP) | ||
| + | * [[FerryBox_-_Continuous_and_automatic_water_quality_observations_along_transects|FerryBox]] | ||
| + | * Radar Doppler Current Profiler (RDCP) | ||
| + | An example of results obtained with a Scanfish is given below. | ||
| + | <p> | ||
| + | <br> | ||
| + | <p> | ||
| + | |||
| + | ==SHIP SURVEYS – A flexible observation component of COSYNA== | ||
| + | <p> | ||
| + | |||
| + | ===Remote automated systems still leave observational gaps=== | ||
| + | <p> | ||
| + | |||
| + | Ongoing observations by means of remotely controlled automated systems on fixed platforms, cruising line-ships or [[remote sensing]] systems provide a sustained observational data network. However, additional ship cruises are further necessary to fill the following observational gaps in space and time: | ||
| + | * In-situ fixed stations cover only point locations. | ||
| + | * Liner carrying FerryBox cover only specific transects in one (near surface) water depth. | ||
| + | * Remote sensing (land-/ship-based radar, satellites) detects only properties from the water surface. | ||
| + | * Systematic, enduring scans of the full water columns by autonomous underwater vehicles, e.g. gliders may become the optimal solution in future. Adverse environmental conditions prevailing within the German Bight hinder their routine use within [https://www.hzg.de/institutes_platforms/cosyna/index.php.de COSYNA]: (1) shallowness (< 50 m), (2) tidal currents of up to 1 ms-1, (3) variable mixing of fresh water from the rivers, (4) extensive human usage (shipping, fishery). They demand significant adaptations of the operation control system of the vehicles. Further no sampling is possible during operation that would allow to reliably transforming the gathered optical and acoustical information into concentrations of substances. | ||
| + | <p> | ||
| + | <br> | ||
| + | <p> | ||
| + | |||
| + | ===Ship surveys to complement fixed pre-operational observation grid=== | ||
| + | <p> | ||
| + | For the first phase of COSYNA, the traditional approach of ship surveys is chosen instead | ||
| + | * to fill up observational gaps, especially in the vertical of the water column, and to interpolate between fixed stations, | ||
| + | * to validate remote sensing by in-situ observation, | ||
| + | * to enhance a catalogue of underwater radiation spectra for satellite algorithms, | ||
| + | * to conduct studies with complex sensor systems and configuration , | ||
| + | * to test and advance new sensors before integration into automated, pre-operational configurations, | ||
| + | * to take water samples for consecutive lab analyses for parameters that cannot measured by sensors and to relate optical and acoustical information into concentrations of substances. | ||
| + | |||
| + | <p> | ||
| + | <br> | ||
| + | <p> | ||
| + | |||
| + | ===Advancing scientific knowledge about system development:=== | ||
| + | <p> | ||
| + | For the scientific part, the data will be analysed e.g. | ||
| + | * to understand better the conditions for the development and breakup of vertical stratification, (link) | ||
| + | * to identify processes that act on scales ranging from hundreds of meters to several kilometres, | ||
| + | * to identify simpler proxies for parameters that can so far only be measured with high effort, | ||
| + | * to use the generated oversampling to optimize the sampling strategies for the automated observing network | ||
| + | * to improve process parameterisations in numerical models, | ||
| + | * to validate patterns of a broad range of key state variables predicted from the numerical models used in COSYNA for pre-operational state reconstruction and forecast. | ||
| + | <p> | ||
| + | <br> | ||
| + | <p> | ||
| + | |||
| + | ==Waverider Buoys== | ||
| + | <p> | ||
| + | {| align ="left" style="text-align:center; font-size:85%; margin-right:5px" | ||
| + | |[[Image:Waverecorder buoy.JPG|150px]] | ||
| + | |- | ||
| + | |A waverider buoy | ||
| + | |} | ||
| + | Data from the buoy are: [[Wave height]], wave length and [[wave period]]. | ||
| + | <p> | ||
| + | |||
| + | A Waverider buoy follows the movements of the sea surface, and determines the wave height by measuring the vertical acceleration of the buoy. At the heart of all Waverider buoys is an accelerometer, mounted on a horizontal, stabilised platform suspended in a fluid filled sphere in the bottom of the Waverider buoy. Directional Waverider buoys - as used in COSYNA - have two fixed accelerometers to measure accelerations in the north-south and east-west axes. This information is combined with the heave to resolve wave directions. | ||
| + | <p> | ||
| + | <br> | ||
| + | <p> | ||
| + | {| align ="center" style="text-align:center; font-size:85%; margin-left:5px" | ||
| + | |[[Image:Significant wave height.JPG|center]] | ||
| + | |- | ||
| + | |Example of wave-height recorded by a waverider buoy | ||
| + | |} | ||
| + | <p> | ||
| + | <br> | ||
| + | <p> | ||
| + | |||
| + | ==Radar observations of currents and waves== | ||
| + | <p> | ||
| + | |||
| + | {| align ="left" style="text-align:center; font-size:85%; margin-right:5px" | ||
| + | |[[Image:Radars german bight.JPG|200px]] | ||
| + | |- | ||
| + | |radars in the German Bight | ||
| + | |} | ||
| + | Two radar systems operating in the high frequency (HF-band) and the microwaves (X-band) regime are used to probe the sea surface in COSYNA. | ||
| + | <p> | ||
| + | |||
| + | The X-band combines local spatial coverage with high resolution, whereas the HF-band provides broad coverage at the expense of resolution. In COSYNA the antennae for the HF system (WERA) are located on Sylt, near Büsum and at Wangerooge (see map with coverage of the German Bight). | ||
| + | |||
| + | <p> | ||
| + | |||
| + | Ground-based radars are used to obtain synoptic maps of hydrographic parameters, particularly waves, currents and the local water depth ([[bathymetry]]). Maps of surface currents yield ground truth for satellite remote sensing and calibration data for hydrodynamic models. | ||
| + | <p> | ||
| + | |||
| + | Radar remote sensing of the sea surface provides a broad variety of observations. While single radar images give a kind of instantaneously "frozen" surface, the surface dynamics can be observed by tracking features in subsequent radar measurements. In contrast to the satellite systems, the incident angle of ground based radars is only a few degrees and near to zero (grazing) at far ranges. In this case, the working range of the radar strongly depends on the operating frequency. Due to their continuous measurement capabilities, the information provided by ground based instruments installed at the coast or on offshore platforms does not suffer from the episodic character of the satellite- or airborne radar observations. | ||
| + | <p> | ||
| + | Two radar systems operating in the high frequency (HF-band) and the microwaves (X-band) regime are used to probe the sea surface in COSYNA. The HF signal propagates along the air-sea interface far behind the optical horizon, where as the microwave signal only covers the optically visible area. The X-band combines local spatial coverage with high resolution, where as the HF-band provides broad coverage at the expense of resolution. | ||
| + | |||
| + | <p> | ||
| + | Ground-based radars are used to obtain synoptic maps of hydrographic parameters, particularly waves, currents and the local water depth (bathymetry). | ||
| + | <p> | ||
| + | <br> | ||
| + | <p> | ||
| + | ===X-Band Radar=== | ||
| + | |||
| + | <p> | ||
| + | Microwave (X-band) radars, which are limited by line-of-sight propagation to the horizon. Due to the large available bandwidth in the microwave frequency range, the spatial resolution can be as fine as 5 m at 5 km working range. By installing a microwave radar on-board a ship, the observation area can be extended along the ship track to a regional scale. X-band wave radar (≈ship radar) can be used with special electronics and sophisticated evaluation algorithms for the measurement of waves, currents and bathymetry. It uses an A/D converter, a PC, and a processing software connected to a marine X-Band radar (9.41GHz) The system is applied from shore and from ship stations. There are two permanent stations on Sylt. These give (together with ship cruises with multi-beam [[Akoestische onderwatertechnieken| echosounders]]) important information on sediment transport and [[coastal morphology]] '''(see link below)'''. | ||
| + | <p> | ||
| + | <br> | ||
| + | |||
| + | Typical results: X-Band Radar: Change of [[bathymetry]] during a single storm, observed with a radar installation at the island of Sylt (February 2002) (see diagram). The bathymetric maps show the seafloor relief, calculated from X-band radar signals, before and after a severe storm passed. Within 5 days a volume of 50.000 m<sup>3</sup> sand (error about 25%) was transported into the observation area. | ||
| + | <p> | ||
| + | <br> | ||
| + | <p> | ||
| + | |||
| + | {|align ="center" style="text-align:center; font-size:85%" | ||
| + | |[[Image:Results x band radar.JPG|450px]] | ||
| + | |- | ||
| + | |X-band radar observations of bathymetry | ||
| + | |} | ||
| + | <p> | ||
| + | <br> | ||
| + | <p> | ||
| + | |||
| + | ===HF Radar=== | ||
| + | <p> | ||
| + | |||
| + | Decameter wave radars, also known as High Frequency (HF) radars, make use of ground wave propagation far beyond the horizon. HF radars provide about 1.5 km at up to 200 km working range. Surface [[currents]] are hard to measure by conventional means. The unique advantage of the HF radar is the ability to map the horizontal variability of currents which is needed for several applications. Eddy dynamics, such as propagation and decay, can be studied, as well as the spatial variability of tidal currents. Maps of surface currents yield ground truth for satellite remote sensing and calibration data for hydrodynamic models. | ||
| + | |||
| + | <p> | ||
| + | |||
| + | The WERA system is a shore based remote sensing system using the over the horizon radar technology to monitor ocean surface currents, waves and wind direction. | ||
| + | |||
| + | <p> | ||
| + | The WERA system, developed at the University of Hamburg, has one main advantage: The possibility of connecting different configurations of receive antennas. When operated with linear array, information on the sea state can be obtained via second-order spectra bands. A further advantage is the flexibility in range resolution between 0.3 km and 1.2 km, instead of the fixed resolution of about 2 km of most CODAR systems. This is achieved by transmitting frequency- modulated continuous wave (FMCW) chirps instead of continuous wave (CW) pulses. In addition, this technique avoids the blind range of about 3 km in front of the CODAR. In COSYNA the antennae for the WERA system are located on Sylt, near Büsum and at Wangerooge. | ||
| + | <p> | ||
| + | <br> | ||
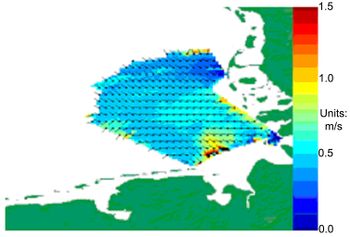
| + | Typical results: HF-Band: Synoptic current map derived from the continuous measurements of the HF-radar system (9 September, 2011, 14 UTC, snapshot from the COSYNA data portal). The radial current components are retrieved from the Doppler shift of the backscattered signal. Combining the measurement from the stations, located on Sylt, near Büsum and at Wangerooge, 2D surface current vectors are retrieved (current direction depicted by line, current velocity colour coded). The synoptic current data from the German Bight are used for data assimilation into numerical models. | ||
| + | <p> | ||
| + | <br> | ||
| + | <p> | ||
| + | {|align ="center" style="text-align:center; font-size:85%" | ||
| + | |[[Image:Results hf radar.JPG|center|350px]] | ||
| + | |- | ||
| + | |Example of waveheight recorded by a waverider buoy | ||
| + | |} | ||
| + | |||
| + | ==Remote sensing by satellites== | ||
| + | <p> | ||
| + | ===Satellite Remote Sensing=== | ||
| + | <p> | ||
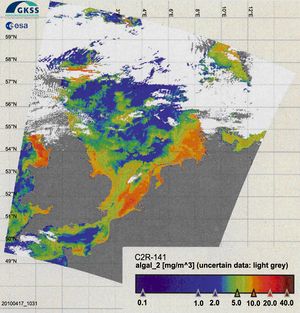
| + | Remote sensing is a unique technique used to observe large areas of ocean and land surface simultaneously. It is possible to measure concentrations of chlorophyll, suspended matter and yellow substance (also referred to as CDOM) in the visible light spectrum. The algorithms for the open, blue ocean are well established, whereas for coastal regions with highly variable waters they are still the subject of research. Recently, the ESA decided to use an algorithm developed at HZG to reprocess all coastal data from [[MERIS]]. This currently optimal algorithm is also used in COSYNA on a daily basis, as shown in the figure (below) of a snapshot of chlorophyll concentrations in the North Sea on 17 May, 2010. | ||
| + | In addition, sea surface temperature (SST) data from other satellites are used in COSYNA. | ||
| + | |||
| + | <p> | ||
| + | <br> | ||
| + | <p> | ||
| + | |||
| + | {| align ="center" style="text-align:center; font-size:85%" | ||
| + | |[[Image:Chrolofyl concentrations RS.JPG|center|300px]] | ||
| + | |- | ||
| + | |chlorophyll concentrations in the North Sea measured by a satellite | ||
| + | |} | ||
| + | |||
| + | ===MERIS on ENVISAT=== | ||
| + | |||
| + | <p> | ||
| + | |||
| + | [http://envisat.esa.int/instruments/meris/ MERIS] is a Medium Resolution Imaging Spectrometer operating in the solar reflective spectral range by ESA and installed on the European environmental satellite (ENVISAT). | ||
| + | <p> | ||
| + | With fifteen spectral bands it can be used to determine among many other parameters concentrations of chlorophyll, suspended matter and yellow substances in water. ESA's standard processor for these parameters was developed by Helmholtz-Zentrum Geesthacht (HZG). | ||
| + | <p> | ||
| + | |||
| + | MERIS, as one of ten major instruments on [http://envisat.esa.int/ Envisat], is operationally delivering data with global coverage in mid latitudes on two out of three days. The data are provided in near real time by ESA in a rolling archive, downloaded for COSYNA purposes to HZG and processed further with optimised algorithms and are available in various formats and as pictures and quick looks. | ||
| + | <p> | ||
| + | <br> | ||
| + | <p> | ||
| + | |||
| + | ===ASAR on ENVISAT=== | ||
| + | <p> | ||
| + | ASAR, the Advanced Synthetic Aperture Radar (ASAR), operating at C-band, is imaging microwave radar and ensures continuity with the image mode (SAR) and the wave mode of the ERS1/2 AMI. | ||
| + | At Helmholtz-Zentrum Geesthacht a algorithm was developed to retrieve high resolution wind fields from SAR (WiSAR), which is capable of handling SAR data from the satellites ERS1, ERS2, RADARSAT1 and ENVISAT. | ||
| + | It is based on estimation of wind directions from linear features visible in the SAR image and wind speeds from the normalized radar cross section (NRCS) and capable of distinguishing between wind and none wind induced features. | ||
| + | We are archiving selected ENVISAT ASAR imagery for scientific purposes. Within this activity we demonstrate the application of WiSAR in an operational mode, which results in ASAR retrieved wind fields in near real time. | ||
| + | <p> | ||
| + | <br> | ||
| + | <p> | ||
| + | ===Reference Stations for Remote Sensing=== | ||
| + | <p> | ||
| + | The most critical parameter when computing water constituents from satellite data (radiation) is the correction of the atmospheric influence. To get more reliable corrections two land-based stations on Helgoland and in Büsum are operated that measure parameters such as aerosols, sunshine and irradiance. | ||
| + | <p> | ||
| + | <br> | ||
| + | <p> | ||
| + | ===Exemplary Results=== | ||
| + | <p> | ||
| + | Chlorophyll concentration over the North Sea, 17 May 2010 at 10.30UTC derived from MERIS with the 'Case-2-Regional' Processor (see above). Note that only natural clouds (no contrails) are visible due to airspace closure over Europe. | ||
| + | <p> | ||
| + | To obtain a better overview over chlorophyll dynamics and to reduce the effect of cloud coverage on data, monthly means and monthly maxima are derived. The pictures show the monthly maximum concentrations of chlorophyll in 2003. They were created by combining many daily scenes for each month. | ||
| + | <p> | ||
| + | Optical remote sensing is an ideal instrument through which to obtain spatial information for large areas almost every day. The lack of information in deeper water levels and under clouds requires additional information from other in situ measurements in combination with numerical models to assimilate missing data. | ||
| + | <p> | ||
| + | In addition, further in situ measurements from campaigns and from regular stations are necessary to validate and improve satellite-derived data. | ||
| + | <p> | ||
| + | <br> | ||
| + | <p> | ||
| + | ==New Technologies in COSYNA== | ||
| + | <p> | ||
| + | In addition to "mature" techniques, such as Wadden Sea Poles, FerryBox, Radar and Optical Remote Sensing that are used in COSYNA in a pre-operational mode, there are new technologies that first have to be tried in an experimental mode. | ||
| + | <p> | ||
| + | Examples of such new technologies are: | ||
| + | * Lander for measurements at the sediment/water interface | ||
| + | * Underwater node (infrastructure to couple underwater instruments into COSYNA) | ||
| + | * Active and passive samplers for micro-pollutants | ||
| + | * Automated sensors for water biogeochemical parameters (algal groups & species, alkalinity, [[zooplankton]] and more) | ||
| + | <p> | ||
| + | <br> | ||
| + | <p> | ||
| + | |||
| + | ===Measurements at the Sediment-Water Interface (Landers)=== | ||
| + | <p> | ||
| + | |||
| + | In coastal areas of shelf seas the exchange processes between sediment and water are important for the whole system. Dependent on the material properties of sediment and suspended matter transport processes near the bottom lead from topographical changes over re-suspension at the sediment surface to suspension of particles in the water column. Despite many investigations a holistic picture of the complex processes, especially the small-scale interactions between turbulence, micro-topography and biogeochemical exchange processes is still missing. | ||
| + | <p> | ||
| + | |||
| + | Within COSYNA two systems for continuous near-bottom measurements will be build; one system focusing more on physical processes (SedOBS) and the other concentrating on biogeochemical exchange (NusOBS). As instrument carriers autonomous "lander systems" are used, that later will be coupled to underwater nodes. The instruments will be operated by the German partners AWI (Bremerhaven), MARUM (Bremen) and ZMAW (Hamburg). | ||
| + | <p> | ||
| + | <br> | ||
| + | <p> | ||
| + | |||
| + | {| align="center" width="650" border="1" Cellspacing="0" Cellpadding="4" | ||
| + | ! Parameters for Physical Sediment Observations (SedOBS) | ||
| + | ! Parameters for Biogeochemical Observations (NusOBS) | ||
| + | |- | ||
| + | | | ||
| + | High-resolution current profile (ADCP), turbulence, CTD, Eddy correlation, particle size (LISST), floc-cam, high-resolution sonar, noise-recording | ||
| + | | | ||
| + | Particle sampler, benthic flow-chamber, current CTD, in situ water sampler, in situ porewater sampler, in situ autoanalyser | ||
| + | |} | ||
| + | <p> | ||
| + | <br> | ||
| + | <p> | ||
| + | |||
| + | ===Underwater Nodes=== | ||
| + | <p> | ||
| + | |||
| + | Within the last years "underwater nodes" gain in importance as interfaces for underwater observing networks (e.g., NEPTUNE Canada at the US/Canadian west coast). They provide the necessary infrastructure (power & data communication) to operate various sensors and complex devices at the sea bottom. Within COSYNA a stable technology for shallow-water (<100 m) applications will be developed. The objective is to deploy autonomous systems that are deployed in different North Sea areas (and later in the Arctic) and allow a flexible and modular coupling of different near-bottom measurement systems. Thus, a network of long-term operated underwater observatories can be established to investigate processes at the sediment-water interface in a sufficient spatial and temporal resolution independent from ship cruises. | ||
| + | <p> | ||
| + | |||
| + | The main challenge in developing an underwater node is to provide power and broad band data communication to many instruments from different users in a reliable manner: Even if an instrument produces a short circuit by penetrating water the other instruments shall not be influenced. All data will be transported to the users desk in a transparent way with 100 Mbit/s and each user can control his/her individual instrument by internet. The instrument will be developed and operated jointly by HZG and AWI. | ||
| + | <p> | ||
| + | <br> | ||
| + | <p> | ||
| + | |||
| + | ===Integrative sampling for the analysis of chemical contamination=== | ||
| + | <p> | ||
| + | |||
| + | The first steps were planning and realizing an underwater sampling platform. The newly developed sampling infrastructure was equipped with passive as well as active samplers (Mussels, [http://www.marinespecies.org/aphia.php?p=taxdetails&id=140480 ''Mytilus edulis'']) and the robustness of the installation under field conditions was tested. In 2011 the first continuous operation of the systems could be realized at the “Seebäderbrücke” in Cuxhaven and on one tetrapod located within the TN 10 field of “MarGate”. | ||
| + | <p> | ||
| + | <br> | ||
| + | <p> | ||
| + | The implementation of passive samplers started with an optimization of the deployment strategy in terms of size and fixation of the polymer sheets. Supplementary laboratory experiments were focused on the development of cleaning and extraction procedures for the passive sampler material used and on the optimization of the spiking procedure necessary to calculate the sampling rates of the passive sampling devices. | ||
| + | <p> | ||
| + | Active samplers (''Mytilus edulis'', av. 90 or 100 individuals per cage) were deployed and continuously sampled for many months. Laboratory experiments were performed to establish standard procedures for sample preparation and measurements of basic physiological data. | ||
| + | <p> | ||
| + | <br> | ||
| + | <p> | ||
| + | |||
| + | ===Zooplankton Recorder (MOKI)=== | ||
| + | <p> | ||
| + | {| align ="right" style="text-align:center; font-size:85%; margin-left:5px" | ||
| + | |[[Image:Zooplankton recorder.JPG|220px|center]] | ||
| + | |- | ||
| + | |Zooplankton recorder | ||
| + | |} | ||
| + | |||
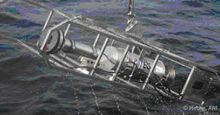
| + | Rapid mapping of [[plankton]] abundance in combination with taxonomic and size composition will be enabled by the [[zooplankton]] recorder MOKI (figure left: the predecessor LOKI). MOKI allows to image minute objects of sizes below 100 μm with high resolution. Modular components allow the use as devices towed from research vessels, as a component of the FerryBox or as a component on unmanned platforms, e.g. piles or underwater nodes. Images of dominant plankton groups can be classified in the MOKI-Browser and objects can be assigned to their respective environmental parameters: Depth, temperature, salinity and oxygen concentration. The instrument has been developed and will be modified and operated by the partner AWI. | ||
| + | <p> | ||
| + | <br> | ||
| + | <p> | ||
| + | |||
| + | ===Nucleic Acid Biosensor=== | ||
| + | <p> | ||
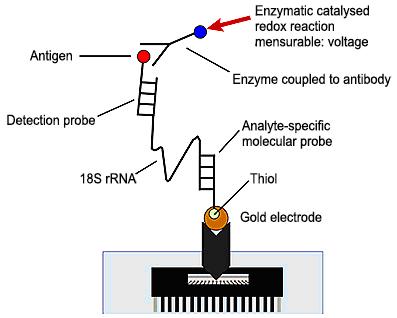
| + | The surveillance of marine phytoplankton will be greatly facilitated with nucleic acid biosensors. The core of the biosensor is a multiprobe chip, that can be used for the simultaneous detection of a variety of algae. A molecular probe as a detection component specifically binds to the target of interest. In turn, an antibody-enzyme-complex coupled to the signal moiety transforms this detection event into a redox-reaction that can be measured as an electrochemical signal. This technique allows rapid detection and counting of microalgae in complex samples. | ||
| + | <p> | ||
| + | The main steps are automatically carried out in a portable device. | ||
| + | Whereas the detection principle has already been verified the main challenge in COSYNA is to construct a device that reliably filters sea water in order to concentrate algae cells, that "cracks” the cells (lysis) and transports the resulting fluid to the detector. | ||
| + | <p> | ||
| + | The instrument has been developed and will be operated by the partner [http://www.awi.de/en/ AWI]. | ||
| + | <p> | ||
| + | <br> | ||
| + | <p> | ||
| + | {| align ="center" style="text-align:center; font-size:85%" | ||
| + | |[[Image:Nucleic Acid Biosensor.JPG|center]] | ||
| + | |- | ||
| + | |Principle of a Nucleic Acid Biosensor | ||
| + | |} | ||
| + | |||
| + | ===PSICAM=== | ||
| + | Precise determination of light absorption in seawater using a newly developed optical instrument. | ||
| + | <p> | ||
| + | |||
| + | '''(Ref. to paper by Röttgers in L&O Methods)''' | ||
| + | <p> | ||
| + | <br> | ||
| + | <p> | ||
| + | |||
| + | ===Sensors for pH and alkalinity=== | ||
| + | <p> | ||
| + | Autonomous sensors are required for a comprehensive documentation and characterisation of the changes in the marine carbon system. To describe the carbon system two out of four system parameters have to be determined. The pH value and the alkalinity are two of these. The pH analysis system adds an acid-base indicator dye (m-cresol purple) to a seawater sample. The indicator dye has different extinction coefficients in its acid and in its base state which can be used for spectrophotometric determination of the pH value. If the temperature of the sample is carefully controlled the precision reaches ±0.0007 pH units. The accuracy of the determination lies within ±0.01 pH units compared to certified reference material. The advantage of this method is that no drift occurs. Hence no calibration of the indicator is needed in the field. Only temperature and salinity have to be known accurately. For determination of total alkalinity a tracer monitored titration with a strong acid (HCl) is performed. Bromocresol green is used as tracer having similar optical properties such as m-cresol purple. The tracer gives the ability to optically measure the concentration of the indicator and therewith the concentration of the acid. In addition the pH value can be calculated during the titration procedure which is needed for determination of the alkalinity. Application of these sensors allows monitoring of seawater pH and alkalinity in autonomous underway systems in a high spatial and temporal resolution. | ||
| + | <p> | ||
| + | <br> | ||
| + | <p> | ||
| + | |||
| + | == See also == | ||
| + | |||
| + | * [[Nutrient analysers]] | ||
| + | * [[Optical measurements in coastal waters]] | ||
| + | * [[Optical remote sensing]] | ||
| + | * [[Fluorescence sensors]] | ||
| + | * [[Real-time algae monitoring]] | ||
| + | * [[Measuring instruments for coasts]] | ||
| + | * [[Measuring instruments for estuaries]] | ||
| + | * [[Measuring instruments for rivers]] | ||
| + | * [[Field Observation Techniques, State of the Art 2012]] | ||
| + | * [[Ships of opportunity and ferries as instrument carriers]] | ||
| + | * [[Manual Sediment Transport Measurements in Rivers, Estuaries and Coastal Seas]] | ||
| + | * [[Use of X-band and HF radar in marine hydrography]] | ||
| + | * [[Waves and currents by X-band radar]] | ||
| + | * [https://www.ferrybox.org/dissemination/online_data/index.php.en FerryBox Database] | ||
| + | * [[European coastal and marine observatories (2020)]] | ||
| + | |||
| + | |||
| + | <p> | ||
| + | <br> | ||
| + | <p> | ||
| + | {{Authorwithoutaccount | ||
| + | |AuthorID=4710 | ||
| + | |AuthorFullName=Colijn, Franciscus}} | ||
| + | |||
| + | [[Category:Coastal and marine observation and monitoring]] | ||
Latest revision as of 21:32, 25 October 2020
Contents
- 1 The need for observations
- 2 FerryBox
- 3 Stationary in situ Observations
- 4 Gliders
- 5 Surveys with Research Vessels
- 6 SHIP SURVEYS – A flexible observation component of COSYNA
- 7 Waverider Buoys
- 8 Radar observations of currents and waves
- 9 Remote sensing by satellites
- 10 New Technologies in COSYNA
- 11 See also
The need for observations
There are a series of objectives why we need to have observational data: to control the outcome of (governmental) monitoring programmes, the obtain data for modelling exercises and to enable scientific analyses of field data to improve our understanding of the marine environment, e.g. to enable assessments of the environmental quality and long term changes.
To observe our marine environment several options are nowadays available: FerryBoxes, Poles in shallow waters like the Wadden Sea, Gliders, regular ship cruises for vertical resolution of parameters, wave rider buoys, shore based radar like HF and XF, and remote sensing from satellites. A combination of different approaches enables coverage on different time and spatial scales. Several of these observational techniques will be presented through examples of actual measurements. Examples are taken from the COSYNA integrated observation system developed by HZG together with other German research institutes during the last years.
FerryBox
Transectional and stationary in situ observations
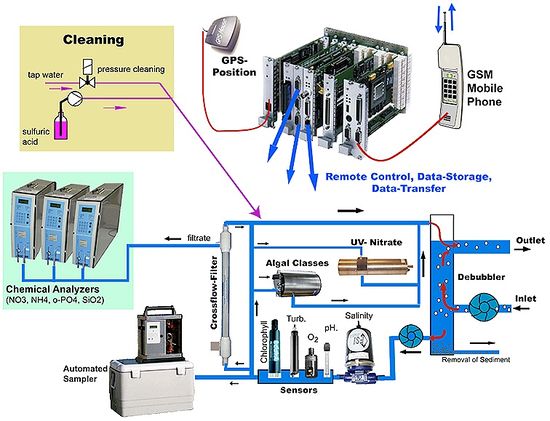
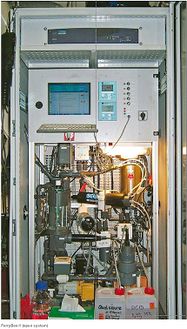
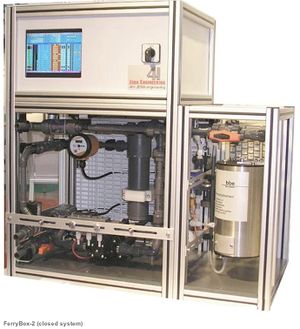
The FerryBox is an automated measuring system used for the measurement of physical and biogeochemical parameters in surface waters. It is mounted on ‘ships of opportunity’, such as ferries or container ships, on their regular routes across the North Sea or on shore-based installations (Helgoland Island, Cuxhaven, and FINO3). Water is pumped from a subsurface inlet into the measuring circuit of multiple sensors (see Diagram)). An important feature is the regular automated cleaning and antifouling procedure of the box. All processes can be controlled remotely via the telemetry line from land. Data are transmitted and made available after each transect via the Internet. Due to the automated biogeochemical instrumentation of the FerryBoxes the regular transects give detailed insights into the processes and are a main source for data assimilation into models.
| Schematic design of the FerryBox flow-through and data system with special features for unattended operation (automatic cleaning system). |
Parameters measured are a.o. water temperature, conductivity, turbidity, oxygen, pH, and chlorophyll-a-fluorescence. Water samples for further lab analysis are taken. On some routes measured additionally are: Algal classes and nutrients (ammonia, nitrite/nitrate, o-phosphate, silicate). In the near future sensors for pCO2, alkalinity, a flow-cytometer and an instrument to measure geneprobes to detect specific species can be installed in some FerryBoxes.
|
|
| Ferry Box (open system) | Ferry Box (closed system) |
| Pictures of commercial available FerryBoxes | |
Water quality data of surface waters on 3 ship routes in a high frequency (daily, 2-daily, weekly - depending on route). Due to some long-distance routes to England and Norway these data are the link between the German Bight and the North Sea.
| Current FerryBox transects in the southern North Sea operated by HZG: Route Cuxhaven - Immingham: RoRo-ship TorDania, Route Gemany - England - Norway: cargo ship LysBris. |
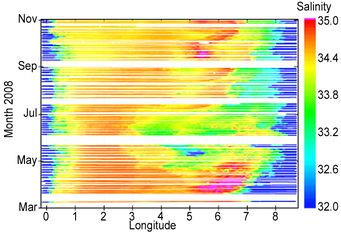
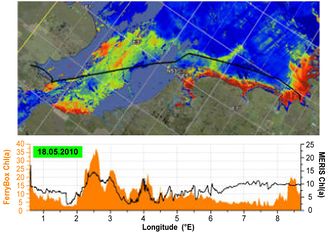
The FerryBox technology developed by HZG works so well - especially due to the integrated anti-fouling system - that it is used not only on ships but as well at any station that has enough power to run the necessary pumps. Therefore, these 'stationary FerryBox systems' have been installed in the stations 'Cuxhaven' and 'Fino-3'. Our partner AWI installed one FerryBox on their shore station at Helgoland. The design and the parameters are the same as on the ship-borne FerryBox systems. The pictures bellow show salinity data from a transect in the southern North Sea between Germany (Cuxhaven) and the UK (Immingham) during the period from March till November 2008 and a graph showing a single transect and the concomitant remote sensing picture of the southern North Sea for the parameter chlorophyll-a.
| Salinity data from a transect in the southern North Sea between Germany (Cuxhaven) and the UK (Immingham) from March till November 2008. |
Single transect and the concomitant remote sensing picture of chlorophyll-a in the southern North Sea. |
Apart from FerryBoxes on board ships of opportunity the possibility exists to install FerryBoxes stationery at selected locations. Currently installations at three locations along the river Elbe (Cuxhaven), on the island of Helgoland and on a research platform (FINO-3) are in operation (see map).
| Map indicating the locations where FerryBoxes are installed (yellow dots) |
Stationary in situ Observations
Wadden Sea Poles
|
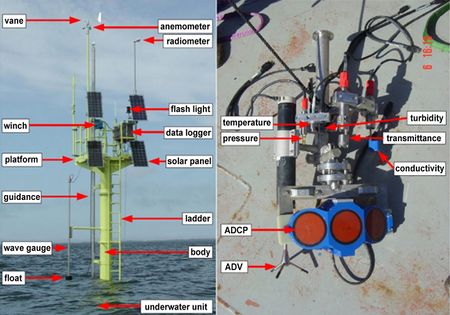
| A picture of a Wadden Sea Pole the different censors are indicated. |
High-frequent water quality data are a prerequisite for an assessment of the substance exchange between North Sea and Wadden Sea.
Parameters measured are pressure (depth), water temperature, conductivity, current velocity/direction, turbidity, chlorophyll-a-fluorescence, photosynthetic active radiation, pH-value, oxygen, and meteorology (pressure, temperature, wind speed, humidity, irradiation and precipitation). An example of such as complete pole is shown in the diagram.
The continuously operating reference network of COSYNA is built from fixed platforms producing high-resolution time series of meteorological, oceanographic and water quality parameters. They yield insights into the system’s variability on time scales ranging from seconds to years. In the German Bight, existing and planned off-shore platforms, e.g., FINO3 and wind energy installations will provide power and broadband capacities to operate FerryBoxes and wave radars. Smaller, self-contained poles in the Wadden Sea (see figure above) and the mouth of the Elbe record data through which to study the exchange of energy and matter between the shallow, intertidal near-coast basins and the German Bight.
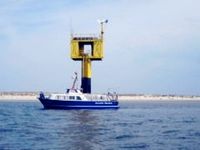
In the shallow areas of the Wadden Sea poles enable the automated measurement of different parameters. Energy supply is by solar panels. All data are transmitted to shore.
|
| The Spiekeroog Pole |
Spiekeroog Pole
Since autumn 2002, the ICBM, University of Oldenburg, has been running the research platform Spiekeroog. In the framework of COSYNA the station is modernized by applying new technical concepts and new instruments. The complete update of the research platform should be finished at the end of the year 2012.
Exemplary results
The figure bellow depicts a typical high-resolution 10 min time series, measured in the Hörnum Deep, south of Sylt Island. From top to bottom, data on water level, wind speed, turbidity and oxygen saturation are shown for two months. One can see that high wind speeds, e.g., during 4 October, 2009 and 19 November, 2009, influenced not only the water level (inflow of North Sea water into the Hörnum Deep), but also led to higher erosion rates that are mirrored by an increase in turbidity.
| Typical high-resolution 10 min time series, measured in the Hörnum Deep. |
Gliders
| The underwater glider |
The underwater glider, or glider in short, is an autonomous underwater vehicle. It works buoyancy driven and is extremely energy efficient.
The underwater glider, or glider in short, is a relatively new measurement platform, and originally developed as a low-cost, long-endurance device for observing the oceans. Being a host for a multitude of sensors, such as CTD, optical backscatter, and fluorescence sensors, gliders can be programmed to follow set way-points. Depending on the sensor payload and battery type, glider missions may last from a couple of weeks to a couple of months. During the mission, the glider pilot can adjust sampling strategies, way-points, etc. from behind his/her desk using a satellite link to communicate with the glider. Concurrently, whilst in operation, (a subset of the) data can be sent to a land-based server via a satellite link, providing scientists with near-real time data.
Concept of operation
In contrast to conventional underwater vehicles, the glider has no propeller. Instead, the glider has a buoyancy engine, which allows the glider to control its buoyancy by +/- 250 g. Consequently, the glider can attain a vertical motion up or down, depending on its buoyancy. A pair of wings converts a part of the vertical velocity into forward motion. As a result, the glider profiles the water column in a saw-tooth manner. Its low cruising speed of about 40 cm/s makes the glider extremely efficient and operates at about 1-2 Watts, giving the glider the unique endurance. A glider at the surface is shown above. It is envisioned to include glider technology in the COSYNA observatory. Due to the adverse conditions in the North Sea (strong currents, high-volume ship traffic), first a pilot project will be conducted. A first test has recently been completed. Deployed from Helgoland, HZG's first glider Amadeus flew a 15 day mission during the second half of February 2011, travelling over 300 km, and enduring effortlessly a more or less continuous winter storm.
| Data collected using the glider during a 15 day test. |
First Results
Data collected during this mission are shown in the figure below. The upper panel shows salinity, computed from the CTD's conductivity, temperature and pressure for a two-day period around 12 February. Due to strong mixing as a result from currents and windforcing and lack of a thermocline (as it was winter), most of the time the water column is well-mixed. Around 12 February, however, the glider crossed a front. The top panel shows the detailed recordings of the horizontal and vertical gradients in salinity at the location of the front. The bottom panel shows the concentrations of chlorophyll-a for the whole mission period. Because of the winter season, the concentrations are low. During the course of the mission, some variability in chlorophyll is observed. Further analysis should distinguish between geographical and temporal effects.
Surveys with Research Vessels
|
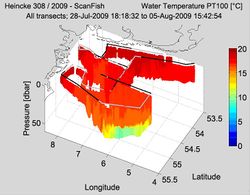
| Example of scanfish recordings |
Regular ship cruises on a fixed criss-cross track across the German Bight provide a quasi-synoptic overview of the German Bight from time to time. The surveys interpolate spatially observed variables between the fixed stations and add vertical depth information to the surface FerryBox and remote sensing data. The research vessels are equipped with a FerryBox, Acoustic Doppler Current Profiler (ADCP), Radar Doppler Current Profiler (RDCP), profiling water samplers and an undulating towed instrument carrier (‘Scanfish’).
Cruises by research ships across the German Bight complement the regular in situ stationary and ship of opportunity observations. They provide a quasi-synoptic overview of the German Bight from time to time. The chosen criss-cross ship-track of RV ‘Heincke’ (see figure below) contacts the fixed COSYNA and state monitoring BSH-MARNET stations and catches the East-West and South-North cross-shore gradients in the German Bight. Additional near-transects are carried out using the smaller RV ‘Ludwig Prandtl’ (figure). The research vessels are equipped with a FerryBox, profiling water samplers and an undulating towed instrument carrier (‘Scanfish’,™ see below).
These surveys thus fulfil several purposes simultaneously:
- Interpolating spatially observed variables between the fixed stations
- Adding vertical depth information to the surface FerryBox and remote sensing data
- Calibrating instruments by well-controlled in situ water samples
- Testing of new sensor packages to be included later in the pre-operational observation mode
- Enabling additional process studies with the support of voluminous information from the standard COSYNA equipment running on board.
During the cruises, the central set of data is recorded by the “SCANFISH”, a multi-instrument platform towed behind the vessel. Undulating up and down movement is generated by moving flaps and ongoing changing the cable length. Maximal operational vessel speed is about 10 knots. In this way a “saw-tooth” chain of observation points is generated over most part of the water column along the ship track. At maximal operational vessel speed of 10 knots, vertical movements of 1 ms-1 and sensor recording frequencies of 12 Hz, the observational resolution is about 10 cm in the vertical and typically 150 m in the horizontal.
Vertical Multi-instrument Profiler
Optical and acoustical instruments on-board the Scanfish record proxies that must be related in a further processing step to the biotic and abiotic substances present in the water: optical turbidity to the concentration of total suspended matter or fluorescence to the concentration of chlorophyll a pigments. The ongoing undulation motion during the cruises make the taking of water samples very difficult and would demand e.g. the use of a voluminous combined cable-water house tube (citation IOW). Instead, we decouple the taking of water samples from the enduring Scanfish operation. At selected stations, when the vessel stops, a vertical profiler equipped with instrumentation identical to the Scanfish is lowered. In addition it contains the water samplers that are filled by a motor driven pumping system over a time range of up to one minute. In this way concentration fluctuations of the suspended matter are averaged out and an exact timing between sampling and sensor recording is achieved.
Other Instruments
During RV Heincke measuring campaigns the following instruments are operated:
- Acoustic Doppler Current Profiler (ADCP)
- FerryBox
- Radar Doppler Current Profiler (RDCP)
SHIP SURVEYS – A flexible observation component of COSYNA
Remote automated systems still leave observational gaps
Ongoing observations by means of remotely controlled automated systems on fixed platforms, cruising line-ships or remote sensing systems provide a sustained observational data network. However, additional ship cruises are further necessary to fill the following observational gaps in space and time:
- In-situ fixed stations cover only point locations.
- Liner carrying FerryBox cover only specific transects in one (near surface) water depth.
- Remote sensing (land-/ship-based radar, satellites) detects only properties from the water surface.
- Systematic, enduring scans of the full water columns by autonomous underwater vehicles, e.g. gliders may become the optimal solution in future. Adverse environmental conditions prevailing within the German Bight hinder their routine use within COSYNA: (1) shallowness (< 50 m), (2) tidal currents of up to 1 ms-1, (3) variable mixing of fresh water from the rivers, (4) extensive human usage (shipping, fishery). They demand significant adaptations of the operation control system of the vehicles. Further no sampling is possible during operation that would allow to reliably transforming the gathered optical and acoustical information into concentrations of substances.
Ship surveys to complement fixed pre-operational observation grid
For the first phase of COSYNA, the traditional approach of ship surveys is chosen instead
- to fill up observational gaps, especially in the vertical of the water column, and to interpolate between fixed stations,
- to validate remote sensing by in-situ observation,
- to enhance a catalogue of underwater radiation spectra for satellite algorithms,
- to conduct studies with complex sensor systems and configuration ,
- to test and advance new sensors before integration into automated, pre-operational configurations,
- to take water samples for consecutive lab analyses for parameters that cannot measured by sensors and to relate optical and acoustical information into concentrations of substances.
Advancing scientific knowledge about system development:
For the scientific part, the data will be analysed e.g.
- to understand better the conditions for the development and breakup of vertical stratification, (link)
- to identify processes that act on scales ranging from hundreds of meters to several kilometres,
- to identify simpler proxies for parameters that can so far only be measured with high effort,
- to use the generated oversampling to optimize the sampling strategies for the automated observing network
- to improve process parameterisations in numerical models,
- to validate patterns of a broad range of key state variables predicted from the numerical models used in COSYNA for pre-operational state reconstruction and forecast.
Waverider Buoys
|
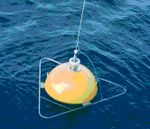
| A waverider buoy |
Data from the buoy are: Wave height, wave length and wave period.
A Waverider buoy follows the movements of the sea surface, and determines the wave height by measuring the vertical acceleration of the buoy. At the heart of all Waverider buoys is an accelerometer, mounted on a horizontal, stabilised platform suspended in a fluid filled sphere in the bottom of the Waverider buoy. Directional Waverider buoys - as used in COSYNA - have two fixed accelerometers to measure accelerations in the north-south and east-west axes. This information is combined with the heave to resolve wave directions.
| Example of wave-height recorded by a waverider buoy |
Radar observations of currents and waves
|
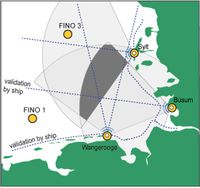
| radars in the German Bight |
Two radar systems operating in the high frequency (HF-band) and the microwaves (X-band) regime are used to probe the sea surface in COSYNA.
The X-band combines local spatial coverage with high resolution, whereas the HF-band provides broad coverage at the expense of resolution. In COSYNA the antennae for the HF system (WERA) are located on Sylt, near Büsum and at Wangerooge (see map with coverage of the German Bight).
Ground-based radars are used to obtain synoptic maps of hydrographic parameters, particularly waves, currents and the local water depth (bathymetry). Maps of surface currents yield ground truth for satellite remote sensing and calibration data for hydrodynamic models.
Radar remote sensing of the sea surface provides a broad variety of observations. While single radar images give a kind of instantaneously "frozen" surface, the surface dynamics can be observed by tracking features in subsequent radar measurements. In contrast to the satellite systems, the incident angle of ground based radars is only a few degrees and near to zero (grazing) at far ranges. In this case, the working range of the radar strongly depends on the operating frequency. Due to their continuous measurement capabilities, the information provided by ground based instruments installed at the coast or on offshore platforms does not suffer from the episodic character of the satellite- or airborne radar observations.
Two radar systems operating in the high frequency (HF-band) and the microwaves (X-band) regime are used to probe the sea surface in COSYNA. The HF signal propagates along the air-sea interface far behind the optical horizon, where as the microwave signal only covers the optically visible area. The X-band combines local spatial coverage with high resolution, where as the HF-band provides broad coverage at the expense of resolution.
Ground-based radars are used to obtain synoptic maps of hydrographic parameters, particularly waves, currents and the local water depth (bathymetry).
X-Band Radar
Microwave (X-band) radars, which are limited by line-of-sight propagation to the horizon. Due to the large available bandwidth in the microwave frequency range, the spatial resolution can be as fine as 5 m at 5 km working range. By installing a microwave radar on-board a ship, the observation area can be extended along the ship track to a regional scale. X-band wave radar (≈ship radar) can be used with special electronics and sophisticated evaluation algorithms for the measurement of waves, currents and bathymetry. It uses an A/D converter, a PC, and a processing software connected to a marine X-Band radar (9.41GHz) The system is applied from shore and from ship stations. There are two permanent stations on Sylt. These give (together with ship cruises with multi-beam echosounders) important information on sediment transport and coastal morphology (see link below).
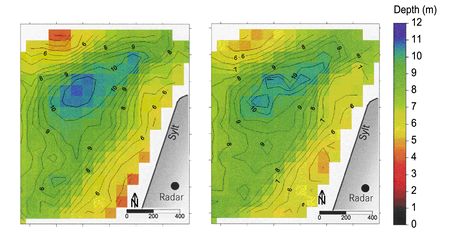
Typical results: X-Band Radar: Change of bathymetry during a single storm, observed with a radar installation at the island of Sylt (February 2002) (see diagram). The bathymetric maps show the seafloor relief, calculated from X-band radar signals, before and after a severe storm passed. Within 5 days a volume of 50.000 m3 sand (error about 25%) was transported into the observation area.
|
| X-band radar observations of bathymetry |
HF Radar
Decameter wave radars, also known as High Frequency (HF) radars, make use of ground wave propagation far beyond the horizon. HF radars provide about 1.5 km at up to 200 km working range. Surface currents are hard to measure by conventional means. The unique advantage of the HF radar is the ability to map the horizontal variability of currents which is needed for several applications. Eddy dynamics, such as propagation and decay, can be studied, as well as the spatial variability of tidal currents. Maps of surface currents yield ground truth for satellite remote sensing and calibration data for hydrodynamic models.
The WERA system is a shore based remote sensing system using the over the horizon radar technology to monitor ocean surface currents, waves and wind direction.
The WERA system, developed at the University of Hamburg, has one main advantage: The possibility of connecting different configurations of receive antennas. When operated with linear array, information on the sea state can be obtained via second-order spectra bands. A further advantage is the flexibility in range resolution between 0.3 km and 1.2 km, instead of the fixed resolution of about 2 km of most CODAR systems. This is achieved by transmitting frequency- modulated continuous wave (FMCW) chirps instead of continuous wave (CW) pulses. In addition, this technique avoids the blind range of about 3 km in front of the CODAR. In COSYNA the antennae for the WERA system are located on Sylt, near Büsum and at Wangerooge.
Typical results: HF-Band: Synoptic current map derived from the continuous measurements of the HF-radar system (9 September, 2011, 14 UTC, snapshot from the COSYNA data portal). The radial current components are retrieved from the Doppler shift of the backscattered signal. Combining the measurement from the stations, located on Sylt, near Büsum and at Wangerooge, 2D surface current vectors are retrieved (current direction depicted by line, current velocity colour coded). The synoptic current data from the German Bight are used for data assimilation into numerical models.
| Example of waveheight recorded by a waverider buoy |
Remote sensing by satellites
Satellite Remote Sensing
Remote sensing is a unique technique used to observe large areas of ocean and land surface simultaneously. It is possible to measure concentrations of chlorophyll, suspended matter and yellow substance (also referred to as CDOM) in the visible light spectrum. The algorithms for the open, blue ocean are well established, whereas for coastal regions with highly variable waters they are still the subject of research. Recently, the ESA decided to use an algorithm developed at HZG to reprocess all coastal data from MERIS. This currently optimal algorithm is also used in COSYNA on a daily basis, as shown in the figure (below) of a snapshot of chlorophyll concentrations in the North Sea on 17 May, 2010. In addition, sea surface temperature (SST) data from other satellites are used in COSYNA.
| chlorophyll concentrations in the North Sea measured by a satellite |
MERIS on ENVISAT
MERIS is a Medium Resolution Imaging Spectrometer operating in the solar reflective spectral range by ESA and installed on the European environmental satellite (ENVISAT).
With fifteen spectral bands it can be used to determine among many other parameters concentrations of chlorophyll, suspended matter and yellow substances in water. ESA's standard processor for these parameters was developed by Helmholtz-Zentrum Geesthacht (HZG).
MERIS, as one of ten major instruments on Envisat, is operationally delivering data with global coverage in mid latitudes on two out of three days. The data are provided in near real time by ESA in a rolling archive, downloaded for COSYNA purposes to HZG and processed further with optimised algorithms and are available in various formats and as pictures and quick looks.
ASAR on ENVISAT
ASAR, the Advanced Synthetic Aperture Radar (ASAR), operating at C-band, is imaging microwave radar and ensures continuity with the image mode (SAR) and the wave mode of the ERS1/2 AMI. At Helmholtz-Zentrum Geesthacht a algorithm was developed to retrieve high resolution wind fields from SAR (WiSAR), which is capable of handling SAR data from the satellites ERS1, ERS2, RADARSAT1 and ENVISAT. It is based on estimation of wind directions from linear features visible in the SAR image and wind speeds from the normalized radar cross section (NRCS) and capable of distinguishing between wind and none wind induced features. We are archiving selected ENVISAT ASAR imagery for scientific purposes. Within this activity we demonstrate the application of WiSAR in an operational mode, which results in ASAR retrieved wind fields in near real time.
Reference Stations for Remote Sensing
The most critical parameter when computing water constituents from satellite data (radiation) is the correction of the atmospheric influence. To get more reliable corrections two land-based stations on Helgoland and in Büsum are operated that measure parameters such as aerosols, sunshine and irradiance.
Exemplary Results
Chlorophyll concentration over the North Sea, 17 May 2010 at 10.30UTC derived from MERIS with the 'Case-2-Regional' Processor (see above). Note that only natural clouds (no contrails) are visible due to airspace closure over Europe.
To obtain a better overview over chlorophyll dynamics and to reduce the effect of cloud coverage on data, monthly means and monthly maxima are derived. The pictures show the monthly maximum concentrations of chlorophyll in 2003. They were created by combining many daily scenes for each month.
Optical remote sensing is an ideal instrument through which to obtain spatial information for large areas almost every day. The lack of information in deeper water levels and under clouds requires additional information from other in situ measurements in combination with numerical models to assimilate missing data.
In addition, further in situ measurements from campaigns and from regular stations are necessary to validate and improve satellite-derived data.
New Technologies in COSYNA
In addition to "mature" techniques, such as Wadden Sea Poles, FerryBox, Radar and Optical Remote Sensing that are used in COSYNA in a pre-operational mode, there are new technologies that first have to be tried in an experimental mode.
Examples of such new technologies are:
- Lander for measurements at the sediment/water interface
- Underwater node (infrastructure to couple underwater instruments into COSYNA)
- Active and passive samplers for micro-pollutants
- Automated sensors for water biogeochemical parameters (algal groups & species, alkalinity, zooplankton and more)
Measurements at the Sediment-Water Interface (Landers)
In coastal areas of shelf seas the exchange processes between sediment and water are important for the whole system. Dependent on the material properties of sediment and suspended matter transport processes near the bottom lead from topographical changes over re-suspension at the sediment surface to suspension of particles in the water column. Despite many investigations a holistic picture of the complex processes, especially the small-scale interactions between turbulence, micro-topography and biogeochemical exchange processes is still missing.
Within COSYNA two systems for continuous near-bottom measurements will be build; one system focusing more on physical processes (SedOBS) and the other concentrating on biogeochemical exchange (NusOBS). As instrument carriers autonomous "lander systems" are used, that later will be coupled to underwater nodes. The instruments will be operated by the German partners AWI (Bremerhaven), MARUM (Bremen) and ZMAW (Hamburg).
| Parameters for Physical Sediment Observations (SedOBS) | Parameters for Biogeochemical Observations (NusOBS) |
|---|---|
|
High-resolution current profile (ADCP), turbulence, CTD, Eddy correlation, particle size (LISST), floc-cam, high-resolution sonar, noise-recording |
Particle sampler, benthic flow-chamber, current CTD, in situ water sampler, in situ porewater sampler, in situ autoanalyser |
Underwater Nodes
Within the last years "underwater nodes" gain in importance as interfaces for underwater observing networks (e.g., NEPTUNE Canada at the US/Canadian west coast). They provide the necessary infrastructure (power & data communication) to operate various sensors and complex devices at the sea bottom. Within COSYNA a stable technology for shallow-water (<100 m) applications will be developed. The objective is to deploy autonomous systems that are deployed in different North Sea areas (and later in the Arctic) and allow a flexible and modular coupling of different near-bottom measurement systems. Thus, a network of long-term operated underwater observatories can be established to investigate processes at the sediment-water interface in a sufficient spatial and temporal resolution independent from ship cruises.
The main challenge in developing an underwater node is to provide power and broad band data communication to many instruments from different users in a reliable manner: Even if an instrument produces a short circuit by penetrating water the other instruments shall not be influenced. All data will be transported to the users desk in a transparent way with 100 Mbit/s and each user can control his/her individual instrument by internet. The instrument will be developed and operated jointly by HZG and AWI.
Integrative sampling for the analysis of chemical contamination
The first steps were planning and realizing an underwater sampling platform. The newly developed sampling infrastructure was equipped with passive as well as active samplers (Mussels, Mytilus edulis) and the robustness of the installation under field conditions was tested. In 2011 the first continuous operation of the systems could be realized at the “Seebäderbrücke” in Cuxhaven and on one tetrapod located within the TN 10 field of “MarGate”.
The implementation of passive samplers started with an optimization of the deployment strategy in terms of size and fixation of the polymer sheets. Supplementary laboratory experiments were focused on the development of cleaning and extraction procedures for the passive sampler material used and on the optimization of the spiking procedure necessary to calculate the sampling rates of the passive sampling devices.
Active samplers (Mytilus edulis, av. 90 or 100 individuals per cage) were deployed and continuously sampled for many months. Laboratory experiments were performed to establish standard procedures for sample preparation and measurements of basic physiological data.
Zooplankton Recorder (MOKI)
| Zooplankton recorder |
Rapid mapping of plankton abundance in combination with taxonomic and size composition will be enabled by the zooplankton recorder MOKI (figure left: the predecessor LOKI). MOKI allows to image minute objects of sizes below 100 μm with high resolution. Modular components allow the use as devices towed from research vessels, as a component of the FerryBox or as a component on unmanned platforms, e.g. piles or underwater nodes. Images of dominant plankton groups can be classified in the MOKI-Browser and objects can be assigned to their respective environmental parameters: Depth, temperature, salinity and oxygen concentration. The instrument has been developed and will be modified and operated by the partner AWI.
Nucleic Acid Biosensor
The surveillance of marine phytoplankton will be greatly facilitated with nucleic acid biosensors. The core of the biosensor is a multiprobe chip, that can be used for the simultaneous detection of a variety of algae. A molecular probe as a detection component specifically binds to the target of interest. In turn, an antibody-enzyme-complex coupled to the signal moiety transforms this detection event into a redox-reaction that can be measured as an electrochemical signal. This technique allows rapid detection and counting of microalgae in complex samples.
The main steps are automatically carried out in a portable device. Whereas the detection principle has already been verified the main challenge in COSYNA is to construct a device that reliably filters sea water in order to concentrate algae cells, that "cracks” the cells (lysis) and transports the resulting fluid to the detector.
The instrument has been developed and will be operated by the partner AWI.
| Principle of a Nucleic Acid Biosensor |
PSICAM
Precise determination of light absorption in seawater using a newly developed optical instrument.
(Ref. to paper by Röttgers in L&O Methods)
Sensors for pH and alkalinity
Autonomous sensors are required for a comprehensive documentation and characterisation of the changes in the marine carbon system. To describe the carbon system two out of four system parameters have to be determined. The pH value and the alkalinity are two of these. The pH analysis system adds an acid-base indicator dye (m-cresol purple) to a seawater sample. The indicator dye has different extinction coefficients in its acid and in its base state which can be used for spectrophotometric determination of the pH value. If the temperature of the sample is carefully controlled the precision reaches ±0.0007 pH units. The accuracy of the determination lies within ±0.01 pH units compared to certified reference material. The advantage of this method is that no drift occurs. Hence no calibration of the indicator is needed in the field. Only temperature and salinity have to be known accurately. For determination of total alkalinity a tracer monitored titration with a strong acid (HCl) is performed. Bromocresol green is used as tracer having similar optical properties such as m-cresol purple. The tracer gives the ability to optically measure the concentration of the indicator and therewith the concentration of the acid. In addition the pH value can be calculated during the titration procedure which is needed for determination of the alkalinity. Application of these sensors allows monitoring of seawater pH and alkalinity in autonomous underway systems in a high spatial and temporal resolution.
See also
- Nutrient analysers
- Optical measurements in coastal waters
- Optical remote sensing
- Fluorescence sensors
- Real-time algae monitoring
- Measuring instruments for coasts
- Measuring instruments for estuaries
- Measuring instruments for rivers
- Field Observation Techniques, State of the Art 2012
- Ships of opportunity and ferries as instrument carriers
- Manual Sediment Transport Measurements in Rivers, Estuaries and Coastal Seas
- Use of X-band and HF radar in marine hydrography
- Waves and currents by X-band radar
- FerryBox Database
- European coastal and marine observatories (2020)
Please note that others may also have edited the contents of this article.
|
