Use of aerial photographs for shoreline position and mapping applications
This article gives an introduction of monitoring by taking aerial photographs. This observation technique is an example of remote sensing and can be used to monitor the coastal zone.
Contents
Introduction
Aerial photographs still supply inexhaustible information on details of the Earth surface. Although high resolution satellite images begin to be regarded as a competitive alternative, both their scale and operational conditions have yet to meet the standards of aerial photographs. In addition, traditions of aerial photography dates back to the World War I, and the archived collections of aerial photographs from that time provide excellent, high resolution information on the coastal zone. Historical aerial photographs make it possible to analyse past phenomena and processes, thereby greatly extending the capabilities of present day’s coastal monitoring.
Application of aerial photographs for coastal monitoring purposes
Conditions for use
To be used in coastal zone monitoring, vertical aerial photographs have to be taken so that the principal point of an image be located within the beach or in the water area (Fig.1a). It is only then that the details of the seaward slope of a dune or a cliff will be sufficiently well resolved. Photographs with the principal points situated landwards beyond the top range of the cliff or the crest line of the dune (Fig.1b) should not be interpreted as the details of the cliff or dune seaward slope may not be discernible.
The highest accuracy of identification is ensured by photogrammetrically processed pictures.The processing requires knowledge on elements of the interior orientation of the camera used to take the pictures (photograph coordinates of the principal point and the principal distance); elements of the exterior orientation of each picture (location of the objective and of the camera’s principal axis on exposure) have to be known as well.
Identification of morphological components
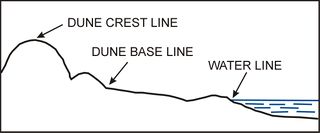
To monitor coastal changes, identification – on an aerial photograph - of the following morphological components of the shore may prove helpful or important (Fig. 2):
- water line (a momentary border between the land and the sea); it varies rapidly, depends on the sea level and wave parameter, and is visible on the photograph as a distinct boundary between the light tone of the beach and the dark tone of the water;
- dune base line/cliff food line; it changes after every major storm and is an indicator of annual changes; it is visible on the photograph as a boundary of vegetation cover;
- cliff range line/dune crest line; an indicator of multiyear changes.
Due to poor legibility of the terrain, the location of the dune base line may be identified in the field to about 1 m. This is the accuracy with which the dune base line can be determined in 1:10 000 – 1:20 000 aerial photographs if these have been taken as described above.
Aerial photograph processing and rectification
Depending on source data and information on elements of interior and exterior orientation of the aerial photographs at hand, different rectification techniques can be used:
- 3D spatial digitising, involving the use of stereoscopic effect and an image station; the most accurate technique making it possible to produce a 3D map of the area monitored;
- ortho-rectification, followed by 3D spatial digitising of morphological elements; the technique is somewhat less accurate than 3D spatial digitising; morphological components are identifiable with the assumed accuracy of 1 m;
- rectification methods using control points (without prior knowledge on elements of interior and exterior orientation); a simplified, least accurate technique, used to process historical photographs; the accuracy depends on the height of dunes or a cliff; the location error does not exceed 2 m if the cliff height is on the order of 10 m.
Monitoring the coast
Short-term coastal changes are reflected in morphological shore components within the beach, while long-term changes can be deciphered from elements of the fore dune and the main dune or cliff. As shown by studies involving aerial photograph interpretation (Stafford et al. 1971[1], El-Ashry 1977[2], Leatherman 1983[3], 1993[4], Musielak et al. 1985[5], 1991[6], Furmańczyk 1994[7]), the dune/cliff base line is the best indicator of coastal dynamics in non-tidal seas, similarly to the high tide line in tidal seas.
To monitor coastal changes, it is recommended that multi-temporal aerial photographs be taken at few years intervals; it is only then that the magnitude of changes may be higher than the accuracy of morphological component identification. Historical aerial photographs are a valuable aid and source of information for studies on coastal dynamics. Despite the lack of knowledge on elements of internal and external orientation (which significantly affects the rectification accuracy), historical photographs substantially extend the temporal axis of observations and make it possible to carry out long-term analyses.
Identification of coastal dynamics
Identification of the position of dune/cliff base line, carried out periodically, every few years, allows to determine the following coastal dynamics parameters:
- net movement, i.e., the distance between points on the dune/cliff base line between the first and the most recent record (the oldest and the youngest series of photographs), as measured perpendicularly with respect to the shore;
- total movement, i.e., the total distance between the points on the dune/cliff base line on the first and the most recent photographs, the intermittent records being factored in;
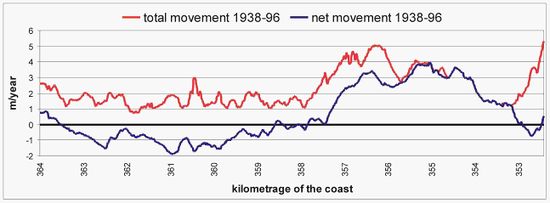
The indicators can be used to extract patterns of coastal development and to produce a dynamics classification of the coast. The two parameters can be presented in the form of a plot of their along-shore variability (Fig. 3).
A case study
Coastal changes in the Pomeranian Bay (Baltic Sea) were analysed based on 4 series of aerial photographs: the recent (1996) series of 1:26000 photographs and 3 historical series of 1938, 1951, and 1973, taken at 1:25000, 1:22000, and 1:28000, respectively. The 1996 series pictures were orthorectified and used as a reference to calibrate the historical photographs. At each photograph, the dune base line was interpreted and the magnitude of coastal changes was calculated for the periods of 1938-96, 1938-51, 1951-73, and 1973-96. The changes in 1938-96 represent the net-movement values, the total-movement values being calculated from changes in 1938-51, 1951-73, and 1973-96. The results, in the form of net-movement and total-movement plots, are shown in Fig. 4.
There are visible some sections of the coast with various combination of the net and total movement values. For example section from 353 to 354,5km have the same value of the total and net movement which means that there are permanent accumulation process. On the section from 360,5 to 361,5km total movement have the same value as net movement but with opposite sign which means that there are permanent erosion process. Very interesting section there is from 357,5 to 358,5km because value of the net movement is around zero, but total movement has a pretty big value, which means that in this section coast is oscillating (erosion and accumulation processes are observed here). The most stable points of the coast there are in places where net movement is around zero and total movement has minimum value like in 363,5; 362,0; 359,2; 358,5; 357,8 and 353,0km.
See also
Internal links
- Shoreline
- Argus video monitoring system
- Satellite-derived nearshore bathymetry
- HyMap: Hyperspectral seafloor mapping and direct bathymetry calculation in littoral zones
External links
References
- ↑ Stafford D.B. Langfelder J. 1971. Air photo survey for coastal erosion. Photogrametric Engineering. No.6. 556-575.
- ↑ El-Ashry M.T. 1977. Air photography and coastal problems. Benchmark Papers in Geology. No.38. 427.
- ↑ Leatherman S.P. 1983. Shoreline mapping: A comparison of techniques. Shore and Beach. Vol.51. 28-33.
- ↑ Leatherman S.P. 1993. Remote sensing applied to coastal change analysis. Gurney. Foster. Parkinson [ed]. Global Change Atlas.
- ↑ Musielak i in. 1985. Fotointerpretacyjna Mapa Strefy Brzegowej. Praca zbiorowa. Odcinek Świnoujście-Dźwirzyno. Stan z lipca 1983. Skala 1:5000. 23 sekcje. OPGK. Szczecin.
- ↑ Musielak S. Furmańczyk K. Osadczuk K. Prajs J. 1991. Fotointerpretacyjny Atlas Dynamiki Strefy Brzegu Morskiego. Lata 1958-1989. Odcinek Świnoujście-Pogorzelica. Skala 1:5000. 21 sekcji. Instytut Nauk o Morzu US, OPGK Szczecin, pod red Musielaka. Wyd. Urząd Morski Szczecin.
- ↑ Furmańczyk K. 1994. Współczesny rozwój strefy brzegowej morza bezpływowego w świetle badań teledetekcyjnych południowych wybrzeży Bałtyku. Uniwersytet Szczeciński. Rozprawy i Studia. Tom 161. (in Polish)
Please note that others may also have edited the contents of this article.
|


