Difference between revisions of "Remote sensing"
(→Eutrophication, ocean colour and algal blooms) |
(→Eutrophication, ocean colour and algal blooms) |
||
| Line 85: | Line 85: | ||
== Eutrophication, ocean colour and algal blooms== | == Eutrophication, ocean colour and algal blooms== | ||
The most useful information for monitoring of eutrophication is the ocean color. The chlorofyll pigment colors green in the surrounding ocean so that phytoplankton can be detected out of space with remote sensing sensors such as [[MERIS]] (Envisat's Medium Resolution Imaging Spectrometer) and [[MODIS]] (The Moderate Resolution Imaging Spectroradiometer). | The most useful information for monitoring of eutrophication is the ocean color. The chlorofyll pigment colors green in the surrounding ocean so that phytoplankton can be detected out of space with remote sensing sensors such as [[MERIS]] (Envisat's Medium Resolution Imaging Spectrometer) and [[MODIS]] (The Moderate Resolution Imaging Spectroradiometer). | ||
| − | Remote sensing can thus provide a wide visual picture and allows us to create more insight into the eutrophication processes | + | Remote sensing can thus provide a wide visual picture and allows us to create more insight into the eutrophication processes (however to maximize the usefulness of satellite data and for their calibration and validation it is essential to obtain in situ data for the monitoring of eutrophication). |
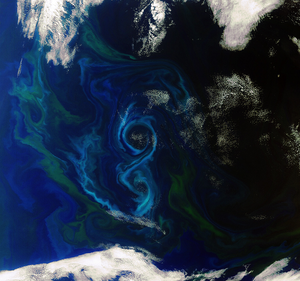
[[Image:Envisatsummerbloom.png|300px|thumb|left|<small>Earth-observing satellite Envisat MERIS image of a phytoplankton bloom in the South Atlantic Ocean: different types and quantities of phytoplankton exhibit different colours, such as the blues and greens in this image)(Photo Credit: ESA) </small>]] | [[Image:Envisatsummerbloom.png|300px|thumb|left|<small>Earth-observing satellite Envisat MERIS image of a phytoplankton bloom in the South Atlantic Ocean: different types and quantities of phytoplankton exhibit different colours, such as the blues and greens in this image)(Photo Credit: ESA) </small>]] | ||
The main reason to measure ocean colour is to study [[phytoplankton]], the microscopic algae which are at the base of the oceanic food web. Remote sensing plays an important role in the detection, monitoring and prediction of [[Algal_bloom|algal blooms]] in the marine environment as these algae are considered a potential threat when they form so called [[Harmful_algal_bloom|harmful algal blooms]] and so appropriate measures can be taken. In situ measurements are useful when more information is required on the type of algae present but when there is a sudden shift in time and location these methods become too expensive. | The main reason to measure ocean colour is to study [[phytoplankton]], the microscopic algae which are at the base of the oceanic food web. Remote sensing plays an important role in the detection, monitoring and prediction of [[Algal_bloom|algal blooms]] in the marine environment as these algae are considered a potential threat when they form so called [[Harmful_algal_bloom|harmful algal blooms]] and so appropriate measures can be taken. In situ measurements are useful when more information is required on the type of algae present but when there is a sudden shift in time and location these methods become too expensive. | ||
Revision as of 16:10, 27 November 2013
Contents
Introduction
There is an increasing demand for accurate, timely information on environmental and natural resources, including spatial relationships and temporal changes and trends, local to global. In the broadest sense, remote sensing is the measurement or acquisition of information of an object or phenomenon, by a recording device that is not in physical or intimate contact with the object. In practice, remote sensing is the utilization at a distance (as from aircraft, spacecraft, satellite, or ship) of any device for gathering information about the environment. Advantages of this technology are:
- Observation of a large geographical area
- Long-term and fast collection of data
- Lower collecting costs
- "Inaccessible" regions become accessible (e.g. Antarctica)
- Object is not being destroyed
Disadvantages are:
- Lower spatial resolution (depending on the type of sensor)
- Need for the installation of complex systems (which have a long testing phase)
- Captured data need to be calibrated via in-situ data
- Noise caused by another source than the desired one
- Atmospheric effects degrade the quality of the images and need to be corrected
Brief history
| <1960 | Aerial photography |
| 1826 | Invention of photography by Joseph Nicéphore Niépce |
| 1850s | Photography with cameras from hot-air balloons |
| 1903 | Invention of pigeon photography (used during World War I and the Civil War) |
| 1909 | Photography from air planes |
| World War I | Military surveillance: airplanes with cameras |
| From 1960 | Shift in the use of platforms for remote sensing: air planes are replaced by satellites |
| 1960s | Space programs and race between the United States (US) and the Soviet-Union (USSR) |
| 04 October 1957 | Sputnik I (USSR): first artificial satellite to go into orbit |
| 31 January 1958 | Explorer I (US) is launched |
| 1960 | TIROS-1: first meteorological satellite
First use of term 'Remote sensing' |
| 1972 | Landsat-1: launch of the first earth resource satellite |
| 1990s | Launch of earth resource satellites by national space agencies and commercial companies |
General principles of remote sensing
Remote sensors are devices that measure and record specific types of energy. In remote sensing this energy is electromagnetic radiation which is reflected or emitted by all natural and synthetic objects on Earth. The electromagnetic spectrum is the continuous range of electromagnetic radiation. The spectrum can be divided in the following regions: gamma rays, X-rays, ultraviolet, visible light, infrared, microwaves and radio waves. Remote sensing involves measurement of energy in many parts in the EM spectrum and takes place in spectral bands. A spectral band is defined as a discrete interval of the EM spectrum. Satellite sensors for example have been designed to measure responses within particular spectral bands to enable the discrimination of the major Earth surface materials. Scientist choose a particular spectral band for data collection depending on what they wish to examine. The data captured and recorded by the sensors must be analyzed by interpretive and measurement techniques in order to provide useful information about their subjects. The technique varies from simple traditional methods of visual interpretation to complicated methods using computer processing. The output is usually an image.
Types of sensors
Remote sensing systems can be divided into 2 categories: active or passive sensors. In active sensors (e.g. radar) energy is transmitted from the sensor so they provide their own energy source for illumination. The sensor emits radiation which is directed toward the object or surface to be investigated. The radiation reflected from that target is detected and measured by the sensor. Passive systems (e.g. photographic camera) measure energy that is naturally available or depend on an external energy source (for example the sunlight).
Atmospheric effects
When the Earth is observed remote sensors are looking through the atmosphere. The atmospheric constituents (particles and gases) can affect the incoming light and radiation by causing wavelength dependent absorption and scattering. Scattering occurs when particles or large gas molecules present in the atmosphere interact with and cause the electromagnetic radiation to be redirected from its original path. Absorption causes molecules in the atmosphere to absorb energy at various wavelengths. Ozone, carbon dioxide and water vapor are the most important to absorb radiation. These atmospheric effects degrade the quality of the images. Some of them can be corrected before the images are subjected to further analysis and interpretation.
Remote sensing applications
- Agriculture
- Environmental monitoring and risks
- Geology
- Oceanography
- Climatology
- Ecology
- Meteorology
- Topography and cartography
- Oil and mineral exploitations
- Military
Eutrophication, ocean colour and algal blooms
The most useful information for monitoring of eutrophication is the ocean color. The chlorofyll pigment colors green in the surrounding ocean so that phytoplankton can be detected out of space with remote sensing sensors such as MERIS (Envisat's Medium Resolution Imaging Spectrometer) and MODIS (The Moderate Resolution Imaging Spectroradiometer). Remote sensing can thus provide a wide visual picture and allows us to create more insight into the eutrophication processes (however to maximize the usefulness of satellite data and for their calibration and validation it is essential to obtain in situ data for the monitoring of eutrophication).
The main reason to measure ocean colour is to study phytoplankton, the microscopic algae which are at the base of the oceanic food web. Remote sensing plays an important role in the detection, monitoring and prediction of algal blooms in the marine environment as these algae are considered a potential threat when they form so called harmful algal blooms and so appropriate measures can be taken. In situ measurements are useful when more information is required on the type of algae present but when there is a sudden shift in time and location these methods become too expensive. Satellite sensors detect the reflected light by the sea surface in different wavelengths. The "colour" of the ocean is determined by the impact of light with the water and any colored particles or dissolved chemicals in the water. Colour is the light reflected by the water and the substances present in it. When light hits a water molecule or a coloured substrate in it, the different colours (wavelengths) can be absorbed or scattered in differing intensities. The colour we see results from the colours that are reflected. The substances in seawater which most affect the water colour are: phytoplankton, inorganic particles, dissolved organic chemicals, and the water molecules themselves. Phytoplankton contains green-coloured chlorophyll-a (necessary to produce organic carbon using light and carbon dioxide during photosynthesis) which absorbs red and blue light and reflects green light. Other particles can reflect and absorb light, which increases turbidity of the water. The ocean colour is also an indicator of the health of oceans. The chlorophyll concentrations can be derived from satellite data by calculating the ratio blue / green of the ocean. When blue is more absorbed,green is more reflected which indicates a higher concentration of phytoplankton in the water and vice versa. Examples of modern colour satellites sensors are SeaWiFS (Sea-viewing Wide Field of view Sensor), MODIS (Moderate Resolution Imaging Spectroradiometer) and MERIS (Medium Resolution Imaging Spectrometer). An overview of satellites and sensors used in Earth Observation is found here. Once a bloom begins, an ocean colour sensor can make an initial identification of its chlorophyll pigment, and therefore its species and toxicity.
See also
References
- Natural resources Canada: Canada Centre for Remote Sensing Tutorial: Fundamentals of Remote Sensing (PDF)
- http://www.esa.int/SPECIALS/Eduspace_EN/SEMF9R3Z2OF_0.html
- http://eoedu.belspo.be/en/applications/index.htm
- http://earthobservatory.nasa.gov/Features/RemoteSensing/
- http://eoedu.belspo.be/en/applications/index.htm
- http://en.wikipedia.org/wiki/History_of_photography
- http://www.jpl.nasa.gov/jplhistory/early/firstsatellites.php
- http://www.geog.ucsb.edu/~jeff/115a/remotesensinghistory.html
Please note that others may also have edited the contents of this article.
|


