Difference between revisions of "Extreme storms"
Dronkers J (talk | contribs) |
Dronkers J (talk | contribs) |
||
| Line 84: | Line 84: | ||
==Related articles== | ==Related articles== | ||
:[[Risk and coastal zone policy: example from the Netherlands]] | :[[Risk and coastal zone policy: example from the Netherlands]] | ||
| − | |||
:[[Wave climate classification according to wind climate]] | :[[Wave climate classification according to wind climate]] | ||
:[[Flood risk analysis study at the German Bight Coast]] | :[[Flood risk analysis study at the German Bight Coast]] | ||
Revision as of 21:23, 1 July 2020
Contents
Introduction
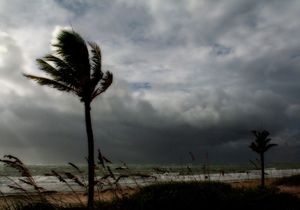
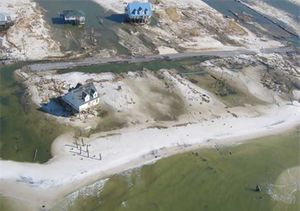
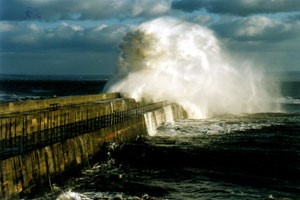
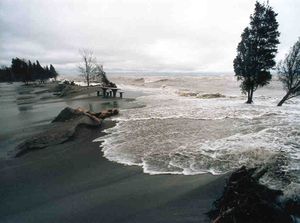
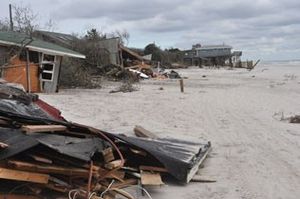
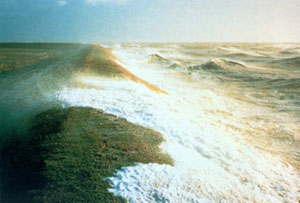
Extreme storms can be defined as intense storm events characterised by strong winds blowing over the surface of the sea, large and long waves that can travel long distances until they reach the shore and high water levels known as storm surge [1]. Such storms can significantly affect navigation and petroleum platforms and can cause a range of potential hazards to coastal areas, such as overwash and/or inundation, beach or shore erosion, as well as damages to coastal protection structures or to infrastructure of developed coastal areas (see Figs. 1a-1f). The most frequent natural hazards to coastal areas, namely flooding and erosion are usually induced by extreme storm events, resulting in lives lost, human injuries and damage to property or to the environment.
Extreme storms are usually defined as the sources of coastal flooding or erosion risk, transmitted to the receptors (society, economy, environmental values) through the pathways of the respective coastal hazard. The intensity of storm-induced coastal processes and the morphodynamic response of a coastal area to an extreme storm event depend strongly on the characteristics of the storm (i.e. storm peak, duration, directionality, energetic content), as well as on the characteristics of the coastal area (i.e. beach profile, gain size, relative orientation of the shoreline)[2][3]
The description of risk sources in coastal areas helps to deliver the hydrologic and hydraulic boundary conditions needed to describe the loading of defences or can be used as key input to calculate the probability of occurrence of a certain coastal hazard (i.e. coastal flooding or erosion). Main coastal risk sources include both intense meteorological synoptic-scale cyclonic events, the tropical cyclones which form almost exclusively over tropical seas, as well as marine storm events resulting from severe wave conditions and/or high sea levels (tide and storm surge) offshore and transformed to nearshore. Tsunamis, namely very long waves most often generated by seismic activity, also belong to coastal risk sources characterised by a high damage potential.
Tropical storms
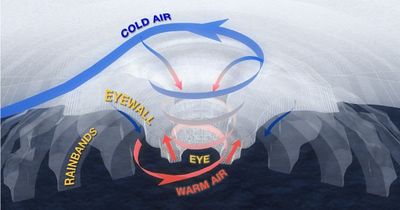
Tropical cyclones are intense local meteorological systems characterised by extremely low pressure in the cyclone center near the sea surface and caused by a combination of warm water, evaporation, swirling winds and other factors. The drag on the sea surface causes the wind to spiral in towards the center of the storm, transferring heat from the ocean surface to the air and therefore refuelling and perhaps strengthening the system (Fig. 2). The intensity of the tropical cyclone increases with lower sea-level pressures in the core of the storm, as well as with stronger winds near the sea surface.
In the Atlantic and Northeast Pacific, tropical cyclones are called hurricanes, while the terms typhoons and cyclones are used for similar types of disturbances in the Northwest Pacific and in the South Pacific and Indian Ocean, respectively (see Fig. 3). Therefore, aside from slightly different wind speeds, there is no difference between a hurricane, a typhoon, and a cyclone.
Most tropical cyclones form within the trade wind region, tracking from east to west, turning poleward under the influence of monsoon circulation and then continuing to turn towards the northeast due to western winds in the mid-latitudes[4]. The intensification stages leading to fully developed tropical cyclones include tropical disturbances, tropical depressions and tropical storms, distinctly separated based on the maximum wind speed near the sea surface. For a tropical cyclone to form and develop there are seven main requirements[4]:
- Sufficiently warm deep sea-surface temperatures,
- Enough Coriolis force to cause the tangential flow of air around the eye of the tropical cyclone,
- Atmospheric instability developed non locally to support deep thunderstorm convection,
- High humidity in the lower to middle levels of the troposphere,
- Low vertical wind shear allowing to create a low-pressure center at the sea surface where thunderstorm clusters can be formed,
- Enough relative vorticity at the lower part of the troposphere enabling the clustering of thunderstorms,
- A pre-existing low level focus or disturbance enabling horizontal convergence in the atmospheric boundary layer.
The reduced atmospheric pressure in the eye of the tropical cyclone combined with wind blowing towards the coast could form large propagating storm surges able to inundate very large areas of the shore and cause significant damages. High surface waves, generated by the total wind speed of the tropical cyclone relative to the surface, resulting as a vector sum of the translation and the rotation speed of the storm, could significantly increase the damage caused. The main coastal hazards resulting from a tropical cyclone include flooding caused by the fast propagating storm surge, high wind speeds causing significant damages inland, beach erosion, as well as wave scour at the toe of structures protecting coastal areas and wave battering of such structures[4].
Wave storms and storm surges
A storm can be simply defined as an intense atmospheric perturbation, which impacts directly on the sea surface causing significantly increased wave heights and sometimes high storm surges[5]. Strong winds over the sea, especially those with large fetches acting for long durations, favor the air-sea momentum transfer[6], possibly leading to high and long sea waves. Wave storms are usually defined as events of significant wave height, [math]H_s[/math], exceeding a predefined threshold (critical [math]H_s[/math]) with a minimum duration. The duration of the storm starts when [math]H_s[/math] exceeds the threshold and ends when [math]H_s[/math] goes below it. Both the threshold of the storm event and its minimum duration are defined based on the objective of the study i.e. storms with a high flooding or erosion potential to the adjacent coastal area. Studies performed for the Spanish coast in the Mediterranean, define a wave storm as an event during which [math]H_s[/math] overpasses the threshold of 2 m with a minimum duration of 6 h, as the limiting conditions required to significantly erode the Catalan coast[3][5]. Therefore, wave storms are considered to be sufficiently intense and durable to produce substantial impacts based on the objectives of each study. It is also quite common to define a maximum time interval for which the wave data fall below the threshold within a single wave storm event. For longer time intervals the storm is splitted in two different wave storm events, allowing for suites of low energetic events to be treated as independent wave storms. To determine wave storm events, long time series of wave data at quite a high temporal resolution (i.e. hourly data) should be made available. Such data can be acquired from a wave buoy network, measuring significant wave height, [math]H_s[/math], peak spectral wave period, [math]T_p[/math], and prevailing wave direction, [math]\theta[/math], or hindcast wave data can be utilised. Sea level is composed of three components, namely the mean sea level, the tidal level and zero mean surge level (i.e. the meteorological residual)[7]. The storm surge is the stochastic component of sea level mainly induced by the inverse barometer effect and strong winds. A storm surge event is defined in a similar manner to the wave storm event. Therefore, an appropriate threshold is defined and the event starts when the storm surge overpasses it and terminates when it gets below this minimum value. A minimum duration of each storm event is also considered. Sea level variations can be acquired from tide gauge records and satellite-altimeter data[8].
Methods to analyse extreme storms and predict return periods
Once storm events (wave storms, storm surge events or wind storms) are identified, time series of storm peaks can be constructed defined by means of the maximum value within each event. These maxima should belong to independent storm events, therefore it is quite common to consider a minimum separation time interval between consecutive peak values [9]. Extreme Value Analysis (EVA) can then be performed to extract return levels of wave/ storm surge/ wind characteristics corresponding to defined return periods i.e. 50, 100, 1000 years. Extreme Value methods are utilized for the purpose of extrapolation to levels more extreme than those observed. Univariate Extreme Value Theory (EVT) includes models for[10]:
- Block maxima (the block size is usually considered equal to one year)
- Exceedances over high thresholds (Peaks Over Threshold (POT) models)
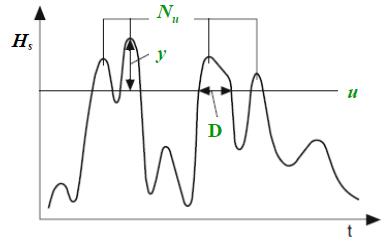
and are used according to data availability. The former models correspond to the family of the Generalized Extreme Value (GEV) distribution, where the largest storms (i.e. the storm with the highest peak [math]H_s[/math]) within each year are selected. The POT method, where all events exceeding a defined threshold [math]u[/math] are considered, defines a two dimensional point process ([math]y, \; N_u[/math]), where the excesses, [math]y[/math], of the threshold [math]u[/math] follow a Generalised Pareto Distribution (GPD), while the number of storms, [math]N_u[/math], is Poisson distributed (Fig. 4, Fig. 5).

The most frequent natural hazards to coastal areas, such as coastal flooding and coastal erosion, are particularly likely when high tides, storm surge and/or large waves occur at the same time. Where the source of a hazard consists of more than one variables (i.e. coastal flooding caused by extreme wave heights and sea levels), it is necessary to consider the joint probability distribution of these variables[12]. Joint exceedance combinations of wave heights and sea levels with a given probability of occurrence are defined in terms of sea conditions in which a given wave height is exceeded at the same time as a given water level (or its surge component) being exceeded. There are different levels of complexity for joint probability methods but all require some assessment of the dependence between variables[13]:
- A relatively simple method uses the marginal distributions of the variables involved and an assessment of their dependence. The joint return period is expressed in terms of combinations of the marginal return periods.
- A more sophisticated approach involves fitting a probability distribution to the joint distribution of variables and extrapolating the joint density function. The benefit of this approach is that the return period of the response function can be easily determined, but a large amount of concurrent data of the variables is needed. For this approach Multivariate Extreme Value Theory and copula functions can be used to extract joint exceedance probabilities and joint return levels. Approaches based on copula functions are able to model multivariate datasets with mixed marginal distributions and complex dependence structures[15].
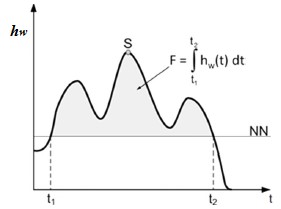
Joint probability approaches have been used in the literature to model the pair of extreme wave height, [math]H_s[/math], and peak period, [math]T_p[/math] [16], [math]H_s[/math] and associated mean period, [math]T_m[/math] [17], maximum water level (storm surge), [math]S[/math] and associated fullness, [math]F[/math], of the entire storm surge curve defined as the energetic content of the event within the storm duration (Fig. 6)[14]. Corbella and Stretch[18] investigate dependencies between wave height, wave period, storm duration, water level and storm inter-arrival time and use trivariate copulas to jointly analyze the variables that are significantly associated.
Extreme storms in coastal engineering practice

Extreme storms are usually related to cross-shore profile changes and longshore changes of the coastline and are considered to induce a range of hazards to coastal areas, the most common of which are flooding and coastal erosion. Population growth, concentration of economic activities, asset concentration, urbanization and tourism lead to an increasing vulnerability of such areas to the aforementioned hazards. The above mentioned challenges coupled with the general inception of a changing climate, with extreme marine events of higher intensity and frequency and mean sea level rise are expected to increase exposure of coastal societies to the associated hazards. Especially when coastal environments are highly urbanised or developed, extreme storm events can induce serious impacts on infrastructure, coastal communities and recreational activities of the affected coastal areas. The increasing potential to predict or forecast such events and to attain reliable estimates of future severe sea states can significantly contribute to reduce flooding and/or erosion risks by prevention or preparedness of the risk receptors.
Extreme storms are also used in the design of coastal protection works, port and harbour structures. Return levels of wave height, wave period, wave run-up and storm surge corresponding to defined return periods (complying with the design standards of each country) are utilised to provide design values of crest characteristics, berm height and width, mean nominal diameter of armour elements and windward slope angle of such structures. They are also used to define the number of layers of coastal structures, to select the appropriate types of armour units, as well as to provide design estimates of toe protection characteristics. During the last few years, probabilistic design approaches based on reliability and risk-based design concepts have been increasingly proposed and applied in the fields of civil engineering and water defences, because of their ability to provide an explicit measure of the safety level of structured systems. More specifically, safety assessments of flood defence assets are increasingly performed with the technique of structural reliability. Reliability-based design optimization deals with obtaining optimal designs characterized by low costs and by a low probability of failure[21][22]. Risk-based design of structures is defined as the approach in which the costs of protection are explicitly weighted against the risk reduction in the protected area. In contrast with reliability-based design, the failure probability for which the structure is designed depends on the consequences of failure[23][24]. To determine the failure probability of a structure is critical for both methods. When the source of the failure consists of a single variable, i.e. extreme wave height or extreme sea level, the failure probability [19] can be computed from a distribution function by a given value of the source variable (failure condition). When the source of failure consists of more than one variables, their joint exceedance probability is determined by integrating the joint probability density of the variables over the failure region (Fig. 7).
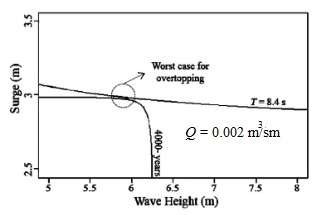
Failure probability referring to the occurrence of a particular response (i.e. overtopping, force on the structure) can be obtained by intersecting the equal response curve with the joint exceedance probability curve of a certain joint return period. The intersection point is referred to as the worst case loading combination (critical condition) for the response under study. The area within the response curve represents the failure probability of the structure for this particular response (Fig. 8).
Related articles
- Risk and coastal zone policy: example from the Netherlands
- Wave climate classification according to wind climate
- Flood risk analysis study at the German Bight Coast
- Stability of rubble mound breakwaters and shore revetments
- Statistical description of wave parameters
References – Further reading
- ↑ U.S. Geological Survey (USGS), 2016. Coastal Change Hazards: Hurricanes and Extreme Storms, Available from: http://coastal.er.usgs.gov/hurricanes/extreme-storms, National Assessment of Storm-Induced Coastal Change Hazards, Available from: http://coastal.er.usgs.gov/hurricanes/sandy/ [accessed on 31-10-2016]
- ↑ Cooper, J.A.G., Jackson, D.W.T., Navas, F., McKenna, J. and Malvarez, G., 2004. “Identifying storm impacts on an embayed, high-energy coastline: examples from western Ireland”. Marine Geology, Vol. 210(1), 261-280.
- ↑ 3.0 3.1 Mendoza, E.T. and Jiménez, J.A., 2006. “Storm-Induced Beach Erosion Potential on the Catalonian Coast”, Journal of Coastal Research, SI 48, 81-88.
- ↑ 4.0 4.1 4.2 Stull, R.B., 2011. “Meteorology for Scientists and Engineers”, 3rd Edition, 938 pp, Free online for everyone worldwide under a Creative Commons license, ISBN 978-0-88865-178-5
- ↑ 5.0 5.1 Bosom, E. and Jiménez, J.A., 2011. “Probabilistic coastal vulnerability assessment to storms at regional scale: application to Catalan beaches (NW Mediterranean)”, Natural Hazards and Earth System Sciences, Vol. 11(2), 475-484.
- ↑ Guimarães, P.V., Farina, L. and Toldo Jr, E.E., 2014. “Analysis of extreme wave events on the southern coast of Brazil”, Natural Hazards and Earth System Sciences, Vol. 14(12), 3195-3205.
- ↑ Pugh, D.T., 1987. “Tides, Surges and Mean Sea Level: a Handbook for Engineers and Scientists”, Wiley, Chichester, 472 pp.
- ↑ Menéndez, M., Méndez, F.J. and Losada, I.J., 2009. “Forecasting seasonal to interannual variability in extreme sea levels”, ICES Journal of Marine Science, Vol. 66, 1490-1496.
- ↑ Makris, C., Galiatsatou, P., Tolika, K., Anagnostopoulou, C., Kombiadou, K., Prinos, P., Velikou, K., Kapelonis, Z., Tragou, E., Androulidakis, Y., Athanassoulis, G., Vagenas, C., Tegoulias, I., Baltikas, V., Krestenitis, Y., Gerostathis, T., Belibassakis, K. and Rusu, E., 2016. “Climate change effects on the marine characteristics of the Aegean and Ionian Seas”, Ocean Dynamics, 1-33.
- ↑ Coles, S., 2001. “An introduction to statistical modeling of extreme values”, Springer Series in Statistics, Springer, Berlin, 209 pp.
- ↑ Galiatsatou, P., Prinos, P. and Sánchez-Arcilla, A., 2008. “Estimation of extremes. Conventional versus Bayesian techniques”, Journal of Hydraulic Research, Vol. 46(2), 211-223.
- ↑ Hawkes, P.J., Gouldby, B.P., Tawn, J.A. and Owen, M.W., 2002. “The joint probability of waves and water levels in coastal defence design”, Journal of Hydraulic Research, Vol. 40(3), 241-251.
- ↑ DEFRA/ Environment Agency Flood and Coastal Defence R&D Programme, 2005. “Joint Probability: Dependence Mapping and Best Practice”, Technical report on dependence mapping, R&D Technical Report FD2308/TR1.
- ↑ 14.0 14.1 Wahl, T., Mudersbach, C. and Jensen, J., 2015. “Statistical assessment of storm surge scenarios within integrated risk analyses”, Coastal Engineering Journal, Elsevier, Vol. 57(1), 1540003.
- ↑ Oumeraci, H., Kortenhaus, A., Burzel, A., Naulin, M., Dassanayake, D.R., Jensen, J., Wahl, T., Mudersbach, C., Gönnert, G., Gerkensmeir, B., Fröhle, P. and Ujeyl, G., 2015. “XtremRisK -Integrated flood risk analysis for extreme storm surges at open coasts and in estuaries: Methodology, key results and lessons learned”, Coastal Engineering Journal, Vol. 57(1), 1540001.
- ↑ Repko, A., Van Gelder, P.H.A.J.M., Voortman, H.G. and Vrijling, J.K., 2004. “Bivariate description of offshore wave conditions with physics-based extreme value statistics”, Applied Ocean Research, Vol. 26, 162-170.
- ↑ Ferreira, J.A. and Guedes Soares, C., 2002. “Modelling bivariate distributions of significant wave height and mean period”, Applied Ocean Research, Vol. 24, 31-45.
- ↑ Corbella, A. and Stretch, D.D., 2013. “Simulating a multivariate sea storm using Archimedean copulas”, Coastal Engineering, Vol. 76, 68–78.
- ↑ 19.0 19.1 Yeh, S-P., Ou, S-H., Doong, D-J., Kao, C.C. and Hsieh, D.W.J., 2006. “Joint probability analysis of waves and water level during typhoons”, Proc 3rd Chinese-German Joint Symposium on Coastal and Ocean Engineering. Cite error: Invalid
<ref>tag; name "Yeh" defined multiple times with different content - ↑ Galiatsatou, P. and Prinos, P., 2011. “Bivariate Analysis of Extreme Wave and Storm Surge Events. Determining the Failure Area of Structures”, The Open Journal of Ocean Engineering, Vol. 4(1), 4-13.
- ↑ Dai Viet, N., Verhagen, H.J., van Gelder, P.H.A.J.M. and Vrijling, J.K., 2008. “Conceptual design for the breakwater system of the south of Doson Naval Base: Optimization versus deterministic design”, Proc. COPEDEC VII, Dubai, UAE, Paper No:053
- ↑ Van Gelder, P., Buijs, F., Horst, W., Kanning, W., Mai Van, C., Rajabalinejad, M., de Boer, E., Gupta, S., Shams, R., van Erp, N., Gouldby, B.P., Kingston, G., Sayers, P.B., Willis, M., Kortenhaus, A. and Lambrecht, H.J., 2009. “Reliability analysis of flood defence structures and systems in Europe”, Flood Risk Management: Research and Practice-Samuels et al. (eds), Taylor & Francis Group, London, ISBN 978-0-415-48507-4.
- ↑ Mai Van, C., van Gelder, P. H. A. J. M. and Vrijling, J. K., 2010. “Risk based design of coastal flood defences-A vietnam case”, In: Reliability, Risk and Safety: Theory and Applications – Briš, Guedes Soares & Martorell (eds), Taylor & Francis Group, London, ISBN 978-0-415-55509-8
- ↑ Voortman, H. G., 2002. “Risk-based design of large scale flood defence systems”, PhD thesis. Delft University of Technology, the Netherlands.
