Difference between revisions of "CNEXO experimental SandPit in Seine Estuary"
Dronkers J (talk | contribs) |
|||
| (14 intermediate revisions by 6 users not shown) | |||
| Line 1: | Line 1: | ||
| − | |||
| − | |||
Through the sixty’s, needs of sands and gravels quickly increased and several studies were carried out by Cnexo (former name of Ifremer Institute) on substitution materials to prevent problems of material supply. | Through the sixty’s, needs of sands and gravels quickly increased and several studies were carried out by Cnexo (former name of Ifremer Institute) on substitution materials to prevent problems of material supply. | ||
In order to study responses of exploitation of submarine materials, a full-scale experiment was launched in 1973 on a site located at the mouth of the Seine estuary. | In order to study responses of exploitation of submarine materials, a full-scale experiment was launched in 1973 on a site located at the mouth of the Seine estuary. | ||
| Line 7: | Line 5: | ||
==Initial state of bathymetry== | ==Initial state of bathymetry== | ||
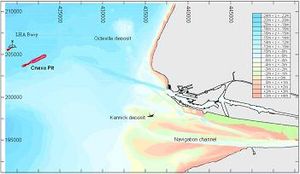
| − | The Cnexo sandpit is 2. | + | The Cnexo sandpit is 2.5km long, 400m wide and its direction is SW-NE. It was dug in a region where the depths varied between 16m and 17.5m with a slight slope toward the North. Figure 1 gives a good idea of the Cnexo pit location inside the Seine Estuary and also shows both the location of the Candhis wave buoy used to collect wave data and the location of two well-known and well-studied sediment deposits (Octeville deposit and Kannick deposit). |
[[Image:Cnexo.JPG|thumb|Figure 1: Cnexo pit location]] | [[Image:Cnexo.JPG|thumb|Figure 1: Cnexo pit location]] | ||
| − | A sediment study of the East part of the Seine bay was carried out in 1967 and showed that the Cnexo pit was dug in a region where the bottom material was made of fine quartz sands with a median diameter between 0. | + | A sediment study of the East part of the Seine bay was carried out in 1967 and showed that the Cnexo pit was dug in a region where the bottom material was made of fine quartz sands with a median diameter between 0.25mm and 0.50mm. These sands at the surface of the bottom contain from 20% to 30% of limestone but less than 2% of silt. |
Before its dredging, the studied site was located on a vast homogeneous sandy zone under which we find old terraces of the Seine river which are mainly composed of coarser materials, more heterogeneous and containing less limestone. Manufacturers of materials were interested in these terraces and especially in their coarser parts. | Before its dredging, the studied site was located on a vast homogeneous sandy zone under which we find old terraces of the Seine river which are mainly composed of coarser materials, more heterogeneous and containing less limestone. Manufacturers of materials were interested in these terraces and especially in their coarser parts. | ||
| − | The dredging of the Cnexo sandpit was carried out from 1974 to 1980 through 13 campaigns of materials extraction that removed more than 2.800. | + | The dredging of the Cnexo sandpit was carried out from 1974 to 1980 through 13 campaigns of materials extraction that removed more than 2.800.000m3 of materials. |
[[Image:Cnexo2.JPG|thumb|Figure 2: Cnexo dredging]] | [[Image:Cnexo2.JPG|thumb|Figure 2: Cnexo dredging]] | ||
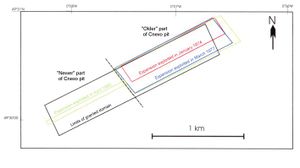
The whole granted domain was not exploited at the same time. | The whole granted domain was not exploited at the same time. | ||
| − | From 1974 to 1977, the only Northeast part of the domain was dredged on a length of | + | From 1974 to 1977, the only Northeast part of the domain was dredged on a length of 1500m approximately. At the end of this first stage, this “old” dredging is 200m wide and his depth varied between 3m and 5m. |
| − | From 1977 to 1980, the Southwest part of the domain was also dredged and this dredging was deeper and also thinner. At the end of the “new” dredging in 1980, the whole dredging | + | From 1977 to 1980, the Southwest part of the domain was also dredged and this dredging was deeper and also thinner. At the end of the “new” dredging in 1980, the whole dredging was about 3 km long and between 130m to 300m wide (These dimensions are found using 18m isobaths). Its bathymetry was deeper in its “new” Southwest part (between 5m and 13m deep) than in its “old” Northeast part (between 3m and 6m deep). |
Figure 2 shows these different stages of Cnexo dredging from 1974 to 1980. | Figure 2 shows these different stages of Cnexo dredging from 1974 to 1980. | ||
| Line 31: | Line 29: | ||
Three different bathymetries were collected for years 1981, 1996 and 2002. The two most recent bathymetries (1996 and 2002) were made by Le Havre Harbour that used exactly the same Global Positioning System for both studied years. Le Havre harbour considers that precision is around 1 meter for the planimetric coordinates and not more than 20 cm for the altimetric coordinate. | Three different bathymetries were collected for years 1981, 1996 and 2002. The two most recent bathymetries (1996 and 2002) were made by Le Havre Harbour that used exactly the same Global Positioning System for both studied years. Le Havre harbour considers that precision is around 1 meter for the planimetric coordinates and not more than 20 cm for the altimetric coordinate. | ||
1981 bathymetric data are more hazardous and was found by digitalizing an old map. | 1981 bathymetric data are more hazardous and was found by digitalizing an old map. | ||
| − | Even if the field measurements had been made correctly we should not expect better precision than | + | Even if the field measurements had been made correctly we should not expect better precision than 10m to 15m for planimetric coordinates and 30 cm for altimetric coordinate. |
==Morphodynamic evolution of Cnexo Sandpit since 1981== | ==Morphodynamic evolution of Cnexo Sandpit since 1981== | ||
| Line 38: | Line 36: | ||
[[Image:Cnexo4.JPG|thumb|Figure 4: Cross-section Slong in 1981, 1996 and 2002]] | [[Image:Cnexo4.JPG|thumb|Figure 4: Cross-section Slong in 1981, 1996 and 2002]] | ||
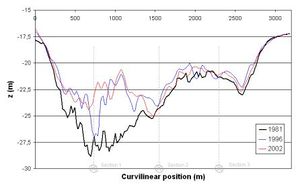
| − | A strong filling of the pit | + | A strong filling of the pit was measured in the southern part of Cnexo pit between 1981 and 1996 and continued between 1996 and 2002 but with a smaller range. See Figure 4. |
===Differential bathymetric map=== | ===Differential bathymetric map=== | ||
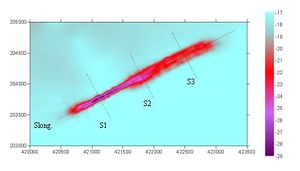
| − | A differential bathymetric map is presented in | + | A differential bathymetric map is presented in Figure 5. A clear filling of the pit between 1981 and 2002 was found while the two slopes of this pit were eroded, which seems physically correct. The phenomenon was stronger in the southern part than in the northern part that was less dug. |
[[Image:Cnexo5.JPG|thumb|Figure 5: Bathymetric differential map between 2002 and 1981]] | [[Image:Cnexo5.JPG|thumb|Figure 5: Bathymetric differential map between 2002 and 1981]] | ||
| Line 49: | Line 47: | ||
===Volume analysis of the Cnexo pit=== | ===Volume analysis of the Cnexo pit=== | ||
| − | A volume analysis was carried out on a restricted domain around the pit. From 1981 to 1996 an accretion of about +615. | + | A volume analysis was carried out on a restricted domain around the pit. From 1981 to 1996 an accretion of about +615.000m3 (41 000m3 /year) was found and from 1996 to 2002 accretion was about +90.000m3 (15 000m3 /year). |
| Line 59: | Line 57: | ||
Two wave databases were collected from two wave buoys located near the CNEXO site. | Two wave databases were collected from two wave buoys located near the CNEXO site. | ||
These buoys belong to the CANDHIS French wave observation network. | These buoys belong to the CANDHIS French wave observation network. | ||
| − | The first buoy | + | The first buoy was located near Antifer and gave omni directional wave data from July 1996 to December 2002 which lead to more than 14000 measurements of (Hp; Tp). |
| − | This buoy | + | This buoy was a little bit far from the Cnexo site and would require a wave propagation study to get the modified wave field above the studied pit. |
| − | The second buoy | + | The second buoy gave omni directional wave data from January 1997 to February 2003 which lead to more than 29000 measurements of (Hp; Tp). This latter buoy was very close to the Cnexo pit (several kilometres far only) as it is shown on the location map (Figure 1) which means that no propagation model needs to be used to get the correct waves field above the Cnexo pit. Unfortunately wave directions are not given. |
Hindcast wave-data at this location have been extracted from the numerical wave data-base along the French coasts, under construction within a joint project between Météo-France, CETMEF and EDF LNHE. This extraction was made for the whole years 1999 and 2000 with a result every 3 hours, which leads to more than 5800 measurements of (Hp; Tp; Direction). | Hindcast wave-data at this location have been extracted from the numerical wave data-base along the French coasts, under construction within a joint project between Météo-France, CETMEF and EDF LNHE. This extraction was made for the whole years 1999 and 2000 with a result every 3 hours, which leads to more than 5800 measurements of (Hp; Tp; Direction). | ||
| Line 76: | Line 74: | ||
[[Image:wave.JPG|thumb|Figure 7: Wave height behind CNEXO sandpit]] | [[Image:wave.JPG|thumb|Figure 7: Wave height behind CNEXO sandpit]] | ||
| − | Because of a large computation area, just wave periods larger than 6. | + | Because of a large computation area, just wave periods larger than 6.5s can be computed with REFONDE® model that solves mild slope equation by the Finite Element Methods. Mesh exceeds 800.000 finite elements. |
| − | Figure 7 shows results of wave modelling results for wave class H4 (Hp=3.29 m; T=7.5s; direction=298°)and in particular the slightly changes of wave heights behind the pit. | + | Figure 7 shows results of wave modelling results for wave class H4 (Hp=3.29 m; T=7.5s; direction=298°) and in particular the slightly changes of wave heights behind the pit. |
===Currents modelling === | ===Currents modelling === | ||
| − | Tide data come from SOGREAH's hydrodynamic model for the Seine Estuary where the Cnexo pit lies. These results are given from April 1st 2002 to April 30th 2002. This period comprises 56 tides. Data for a medium tide is then extracted. Hydrodynamic velocity components (u,v) and water heights h are given at the 4 corners of a rectangular domain around the Cnexo pit. The rectangular domain is | + | |
| + | |||
| + | Tide data come from SOGREAH's hydrodynamic model for the Seine Estuary where the Cnexo pit lies. These results are given from April 1st 2002 to April 30th 2002. This period comprises 56 tides. Data for a medium tide is then extracted. Hydrodynamic velocity components (u,v) and water heights h are given at the 4 corners of a rectangular domain around the Cnexo pit. The rectangular domain is 10km x 10km centred on the Cnexo pit which is 3km long. The maximum water height is 8.25 meters and the maximum current velocity is 0.77m/s. | ||
| + | |||
| + | [[Image:Current.JPG|thumb|Figure 8: Current velocity for a medium tide]] | ||
| + | |||
A short hydrodynamic modelling is run by CETMEF using the REFLUX® model that solves shallow water equations by the Finite Elements Method. The boundary conditions are the water levels. Velocity results are obtained inside the computation area and compared with SOGREAH’s data on the same point. Rough results without calibration are shown in Figure 8. These results are correct and should be improved with a little calibration. However as the current itself has a very poor influence on the sediment transport it was decided to take a homogeneous current field among the whole domain but just changing with time. | A short hydrodynamic modelling is run by CETMEF using the REFLUX® model that solves shallow water equations by the Finite Elements Method. The boundary conditions are the water levels. Velocity results are obtained inside the computation area and compared with SOGREAH’s data on the same point. Rough results without calibration are shown in Figure 8. These results are correct and should be improved with a little calibration. However as the current itself has a very poor influence on the sediment transport it was decided to take a homogeneous current field among the whole domain but just changing with time. | ||
| + | |||
| + | == Morphological response modelling == | ||
| + | |||
| + | Preliminary results of sediment transport model show that waves have more effect on transport than currents do. That shows that the simplification to homogeneous currents among the domain is a correct hypothesis in a first approach. We also found that storm waves (classes H3 + H4) which represent only 4.5% of total wave events are responsible of 90% of sediment transport. It was decided to model first only storm waves for calibration and then to carry out a final complete modelling in order to get the definitive results. | ||
| + | |||
| + | [[Image:Section8.JPG|thumb|Figure 9: Results for section S8 with Soulsby –Van Rijn sediment transport law]] | ||
| + | |||
| + | |||
| + | After a rough calibration we ran out our model for 21 years with every wave conditions and a homogeneous current field. The newer part of the pit is more filled (around 6m of deposit) than the older part (around 2m of deposit) and southern slopes of the pit are much eroded. | ||
| + | |||
| + | With cross-sections shown in Figure 9 we can see that the model does not reproduce perfectly the measurement in cross-sections with a too strong erosion of the southern part. Figure 10 shows on the contrary quite good results for the longitudinal section except a slightly too important filling of the older part. | ||
| + | |||
| + | [[Image:Sectionlong.JPG|thumb|Figure 9: Results for section Slong with Soulsby –Van Rijn sediment transport law]] | ||
| + | |||
| + | |||
| + | We also see in the latter figure that results with the total wave events are very close to results keeping only storm events. Modelling of the total wave events improves however slightly the results. | ||
| + | |||
== References == | == References == | ||
| − | Lemoine M., Clabaut P., Simon S., Augris C., 1999, Étude de la souille expérimentale d’exploitation de granulats marins dite | + | Lemoine M., Clabaut P., Simon S., Augris C., 1999, Étude de la souille expérimentale d’exploitation de granulats marins dite « souille CNEXO » en baie de Seine : évolution morpho-sédimentologique et faunistique entre 1981 et 1996, Rapport Ifremer. |
Desprez M., 1996, Étude des sédiments superficiels et de la macrofaune benthique dans le secteur de l’ancienne fouille expérimentale du CNEXO. État en décembre 1995. Rapport GEMEL Picardie. | Desprez M., 1996, Étude des sédiments superficiels et de la macrofaune benthique dans le secteur de l’ancienne fouille expérimentale du CNEXO. État en décembre 1995. Rapport GEMEL Picardie. | ||
{{author | {{author | ||
|AuthorID=11176 | |AuthorID=11176 | ||
| − | | | + | |AuthorFullName= Sergent, Philippe |
| − | }} | + | |AuthorName=Sergent}} |
| + | |||
| + | [[Category:Physical coastal and marine processes]] | ||
| + | [[Category:Sediment]] | ||
| + | [[Category:Morphodynamics]] | ||
Latest revision as of 19:28, 28 June 2019
Through the sixty’s, needs of sands and gravels quickly increased and several studies were carried out by Cnexo (former name of Ifremer Institute) on substitution materials to prevent problems of material supply. In order to study responses of exploitation of submarine materials, a full-scale experiment was launched in 1973 on a site located at the mouth of the Seine estuary. Morphodynamic behaviour of Cnexo pit was studied within SANDPIT European FP5 project.
Contents
Initial state of bathymetry
The Cnexo sandpit is 2.5km long, 400m wide and its direction is SW-NE. It was dug in a region where the depths varied between 16m and 17.5m with a slight slope toward the North. Figure 1 gives a good idea of the Cnexo pit location inside the Seine Estuary and also shows both the location of the Candhis wave buoy used to collect wave data and the location of two well-known and well-studied sediment deposits (Octeville deposit and Kannick deposit).
A sediment study of the East part of the Seine bay was carried out in 1967 and showed that the Cnexo pit was dug in a region where the bottom material was made of fine quartz sands with a median diameter between 0.25mm and 0.50mm. These sands at the surface of the bottom contain from 20% to 30% of limestone but less than 2% of silt.
Before its dredging, the studied site was located on a vast homogeneous sandy zone under which we find old terraces of the Seine river which are mainly composed of coarser materials, more heterogeneous and containing less limestone. Manufacturers of materials were interested in these terraces and especially in their coarser parts.
The dredging of the Cnexo sandpit was carried out from 1974 to 1980 through 13 campaigns of materials extraction that removed more than 2.800.000m3 of materials.
The whole granted domain was not exploited at the same time. From 1974 to 1977, the only Northeast part of the domain was dredged on a length of 1500m approximately. At the end of this first stage, this “old” dredging is 200m wide and his depth varied between 3m and 5m. From 1977 to 1980, the Southwest part of the domain was also dredged and this dredging was deeper and also thinner. At the end of the “new” dredging in 1980, the whole dredging was about 3 km long and between 130m to 300m wide (These dimensions are found using 18m isobaths). Its bathymetry was deeper in its “new” Southwest part (between 5m and 13m deep) than in its “old” Northeast part (between 3m and 6m deep).
Figure 2 shows these different stages of Cnexo dredging from 1974 to 1980.
Bathymetric data
Three different bathymetries were collected for years 1981, 1996 and 2002. The two most recent bathymetries (1996 and 2002) were made by Le Havre Harbour that used exactly the same Global Positioning System for both studied years. Le Havre harbour considers that precision is around 1 meter for the planimetric coordinates and not more than 20 cm for the altimetric coordinate. 1981 bathymetric data are more hazardous and was found by digitalizing an old map. Even if the field measurements had been made correctly we should not expect better precision than 10m to 15m for planimetric coordinates and 30 cm for altimetric coordinate.
Morphodynamic evolution of Cnexo Sandpit since 1981
Cross-sections analysis
A strong filling of the pit was measured in the southern part of Cnexo pit between 1981 and 1996 and continued between 1996 and 2002 but with a smaller range. See Figure 4.
Differential bathymetric map
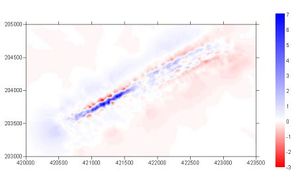
A differential bathymetric map is presented in Figure 5. A clear filling of the pit between 1981 and 2002 was found while the two slopes of this pit were eroded, which seems physically correct. The phenomenon was stronger in the southern part than in the northern part that was less dug.
Volume analysis of the Cnexo pit
A volume analysis was carried out on a restricted domain around the pit. From 1981 to 1996 an accretion of about +615.000m3 (41 000m3 /year) was found and from 1996 to 2002 accretion was about +90.000m3 (15 000m3 /year).
Waves and currents data
Waves data
Two wave databases were collected from two wave buoys located near the CNEXO site. These buoys belong to the CANDHIS French wave observation network. The first buoy was located near Antifer and gave omni directional wave data from July 1996 to December 2002 which lead to more than 14000 measurements of (Hp; Tp). This buoy was a little bit far from the Cnexo site and would require a wave propagation study to get the modified wave field above the studied pit. The second buoy gave omni directional wave data from January 1997 to February 2003 which lead to more than 29000 measurements of (Hp; Tp). This latter buoy was very close to the Cnexo pit (several kilometres far only) as it is shown on the location map (Figure 1) which means that no propagation model needs to be used to get the correct waves field above the Cnexo pit. Unfortunately wave directions are not given. Hindcast wave-data at this location have been extracted from the numerical wave data-base along the French coasts, under construction within a joint project between Météo-France, CETMEF and EDF LNHE. This extraction was made for the whole years 1999 and 2000 with a result every 3 hours, which leads to more than 5800 measurements of (Hp; Tp; Direction).
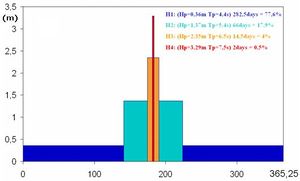
An analysis of these numerical measurements was made in order to study the main directions of waves. The four dominant angular domains centred around dominant directions are used for a simplified wave climate shown in Figure 6. The dominant direction is around 298°.
Waves modelling
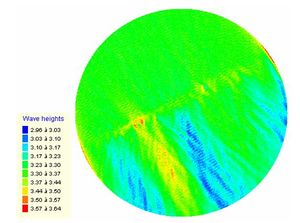
Because of a large computation area, just wave periods larger than 6.5s can be computed with REFONDE® model that solves mild slope equation by the Finite Element Methods. Mesh exceeds 800.000 finite elements. Figure 7 shows results of wave modelling results for wave class H4 (Hp=3.29 m; T=7.5s; direction=298°) and in particular the slightly changes of wave heights behind the pit.
Currents modelling
Tide data come from SOGREAH's hydrodynamic model for the Seine Estuary where the Cnexo pit lies. These results are given from April 1st 2002 to April 30th 2002. This period comprises 56 tides. Data for a medium tide is then extracted. Hydrodynamic velocity components (u,v) and water heights h are given at the 4 corners of a rectangular domain around the Cnexo pit. The rectangular domain is 10km x 10km centred on the Cnexo pit which is 3km long. The maximum water height is 8.25 meters and the maximum current velocity is 0.77m/s.
A short hydrodynamic modelling is run by CETMEF using the REFLUX® model that solves shallow water equations by the Finite Elements Method. The boundary conditions are the water levels. Velocity results are obtained inside the computation area and compared with SOGREAH’s data on the same point. Rough results without calibration are shown in Figure 8. These results are correct and should be improved with a little calibration. However as the current itself has a very poor influence on the sediment transport it was decided to take a homogeneous current field among the whole domain but just changing with time.
Morphological response modelling
Preliminary results of sediment transport model show that waves have more effect on transport than currents do. That shows that the simplification to homogeneous currents among the domain is a correct hypothesis in a first approach. We also found that storm waves (classes H3 + H4) which represent only 4.5% of total wave events are responsible of 90% of sediment transport. It was decided to model first only storm waves for calibration and then to carry out a final complete modelling in order to get the definitive results.
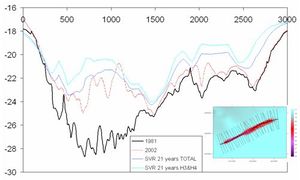
After a rough calibration we ran out our model for 21 years with every wave conditions and a homogeneous current field. The newer part of the pit is more filled (around 6m of deposit) than the older part (around 2m of deposit) and southern slopes of the pit are much eroded.
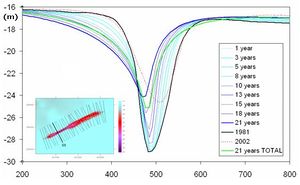
With cross-sections shown in Figure 9 we can see that the model does not reproduce perfectly the measurement in cross-sections with a too strong erosion of the southern part. Figure 10 shows on the contrary quite good results for the longitudinal section except a slightly too important filling of the older part.
We also see in the latter figure that results with the total wave events are very close to results keeping only storm events. Modelling of the total wave events improves however slightly the results.
References
Lemoine M., Clabaut P., Simon S., Augris C., 1999, Étude de la souille expérimentale d’exploitation de granulats marins dite « souille CNEXO » en baie de Seine : évolution morpho-sédimentologique et faunistique entre 1981 et 1996, Rapport Ifremer.
Desprez M., 1996, Étude des sédiments superficiels et de la macrofaune benthique dans le secteur de l’ancienne fouille expérimentale du CNEXO. État en décembre 1995. Rapport GEMEL Picardie.
Please note that others may also have edited the contents of this article.
|
