File list
This special page shows all uploaded files.
| Date | Name | Thumbnail | Size | User | Description | Versions |
|---|---|---|---|---|---|---|
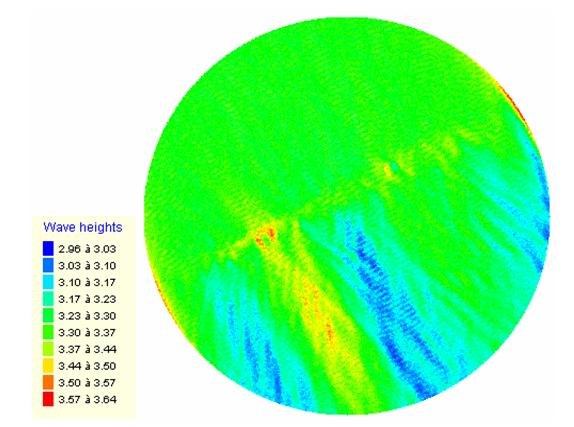
| 10:35, 6 April 2007 | Wave.JPG (file) |  |
35 KB | Sergent | 1 | |
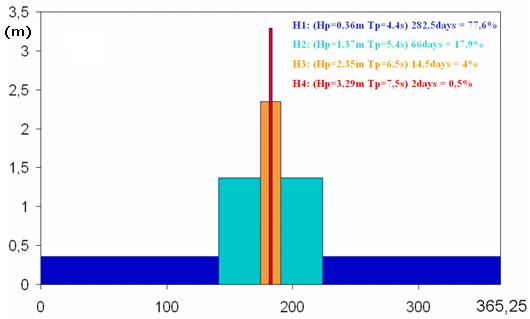
| 10:11, 6 April 2007 | Climate.JPG (file) |  |
17 KB | Sergent | 1 | |
| 15:17, 5 April 2007 | Banner.jpg (file) | 11 KB | Juliettejackson | 1 | ||
| 15:02, 5 April 2007 | BODC.gif (file) |  |
43 bytes | Juliettejackson | 1 | |
| 14:58, 5 April 2007 | Pol logo50.gif (file) | 2 KB | Juliettejackson | 1 | ||
| 14:58, 5 April 2007 | Cobs.gif (file) | 14 KB | Juliettejackson | 1 | ||
| 14:54, 5 April 2007 | Channel coastal obs logo.gif (file) | 3 KB | Juliettejackson | 1 | ||
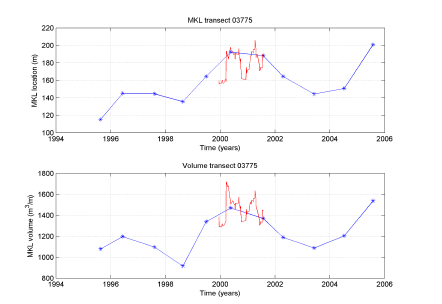
| 15:44, 4 April 2007 | Application5.png (file) |  |
22 KB | Cohen | MCL position and volume at JARKUS transect 3775 from JARKUS data and assimilation model. | 1 |
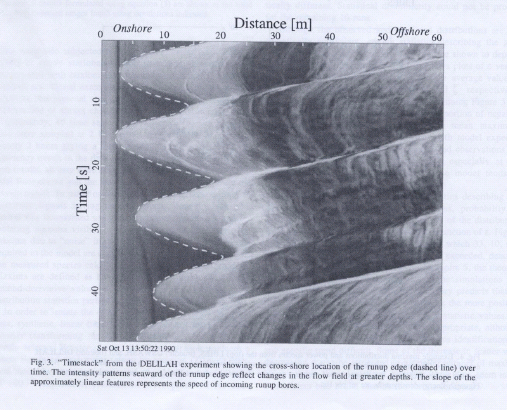
| 15:44, 4 April 2007 | Application4.png (file) |  |
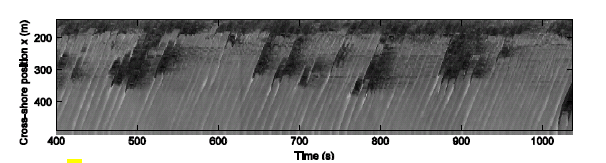
235 KB | Cohen | Argus timestack image of the DELILAH experiment showing the cross-shore location of the run-up edge. | 1 |
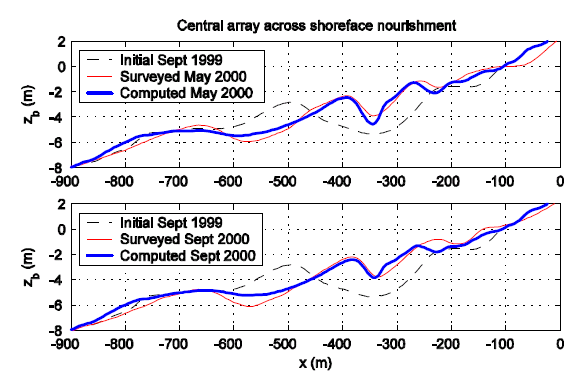
| 15:43, 4 April 2007 | Application3.png (file) |  |
44 KB | Cohen | Subtidal bathymetry derived from Argus images compared with a surveyed bathymetry in May 2000 and September 2000. | 1 |
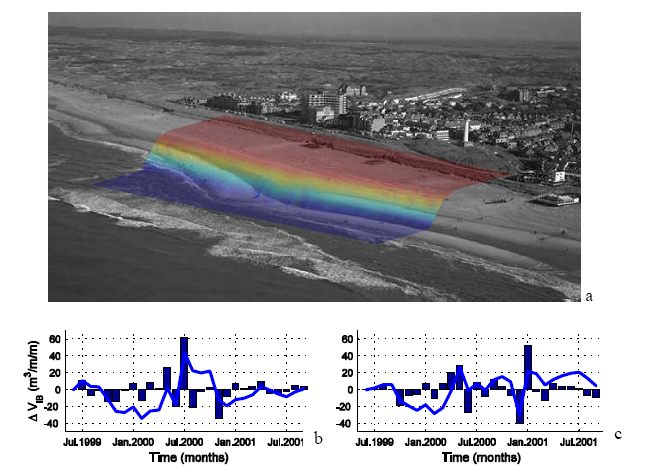
| 15:42, 4 April 2007 | Application2.png (file) |  |
160 KB | Cohen | Intertidal bathymetry at Egmond aan Zee derived from Argus images. Volume changes are shown in two cross-shore arrays 400 m from the cameras to the north and south respectively. | 1 |
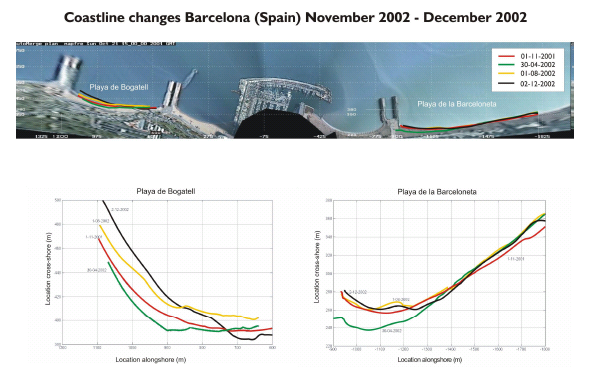
| 15:42, 4 April 2007 | Application1.png (file) |  |
111 KB | Cohen | Coastline changes derived from Argus images in Barcelona between November and December 2002. | 1 |
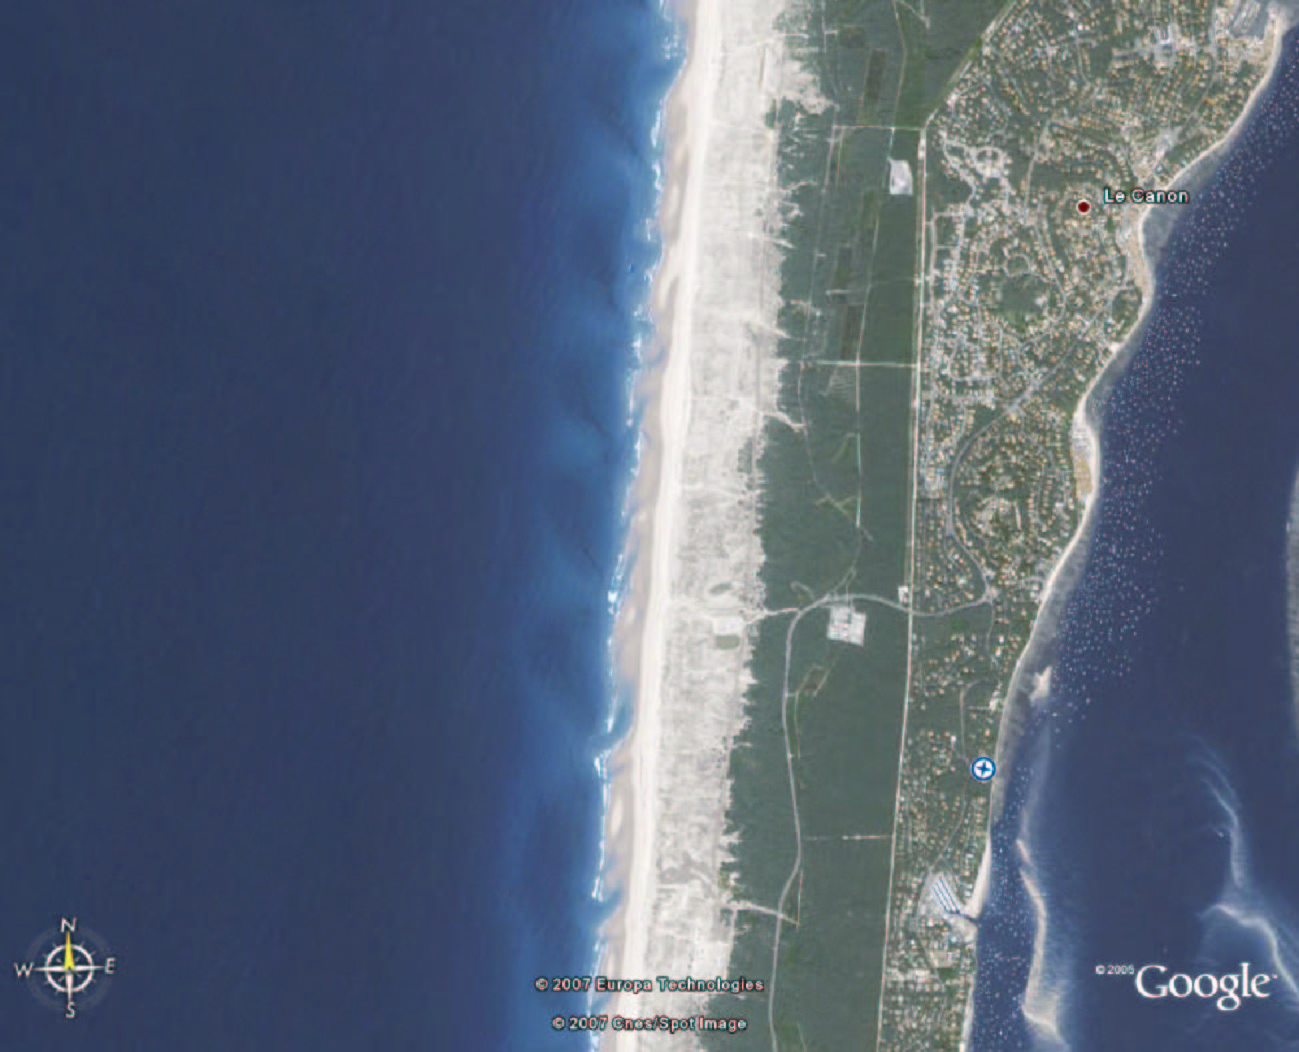
| 15:40, 4 April 2007 | Truc Vert5.jpg (file) |  |
193 KB | Falques | 1 | |
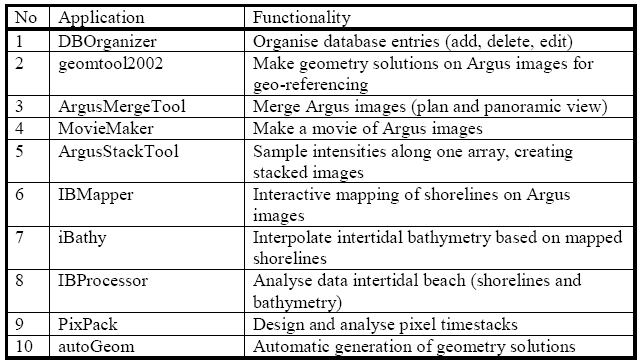
| 15:29, 4 April 2007 | TableTools.png (file) |  |
49 KB | Cohen | table with Argus analysis tools | 1 |
| 15:20, 4 April 2007 | Amur.jpg (file) |  |
176 KB | Falques | 1 | |
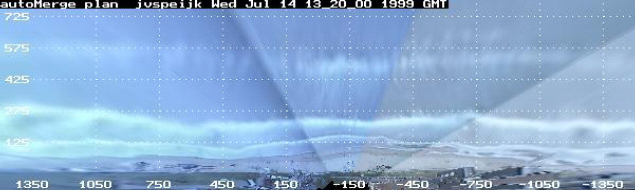
| 15:01, 4 April 2007 | MergeEgmond.png (file) |  |
122 KB | Cohen | Argus merged image of Egmond aan Zee | 1 |
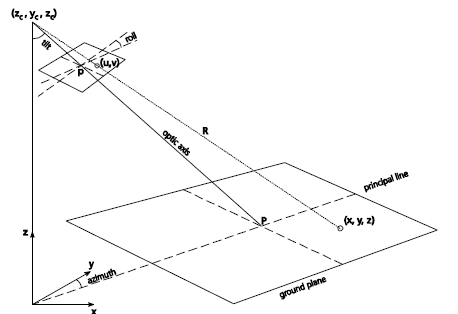
| 14:55, 4 April 2007 | ImageVSrealworld.png (file) |  |
20 KB | Cohen | Relation between image (u,v) and real world (x,y,z) co-ordinates | 1 |
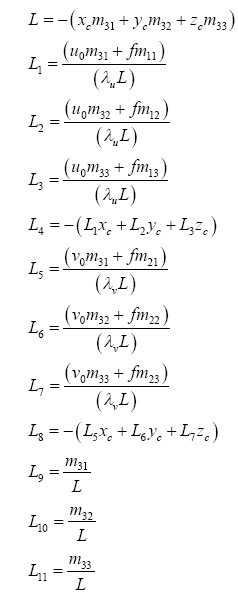
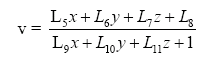
| 14:55, 4 April 2007 | Equation4.png (file) |  |
12 KB | Cohen | Argus Equation4 | 1 |
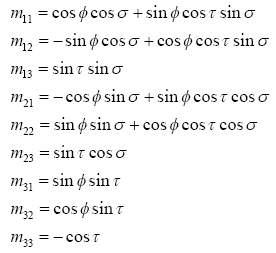
| 14:55, 4 April 2007 | Equation3.png (file) |  |
23 KB | Cohen | Argus Equation3 | 1 |
| 14:54, 4 April 2007 | Equation2.png (file) |  |
3 KB | Cohen | Argus Equation2 | 1 |
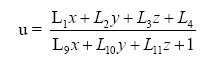
| 14:54, 4 April 2007 | Equation1.png (file) |  |
3 KB | Cohen | Argus Equation1 | 1 |
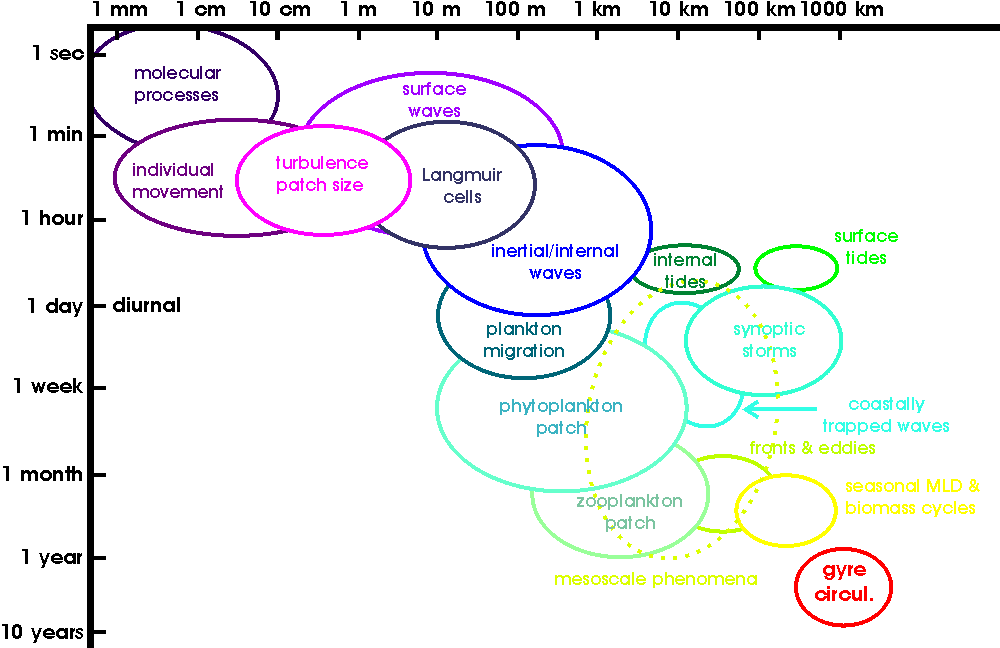
| 14:39, 4 April 2007 | Scales.png (file) |  |
15 KB | Ralfprien | Temporal and spatial scales of ocean processes. Modified after Dickey (2001). | 1 |
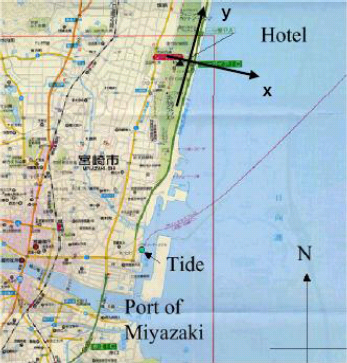
| 14:34, 4 April 2007 | CoordinateSystem.png (file) |  |
165 KB | Cohen | Argus co-ordinate system at Miyazaki, Japan | 2 |
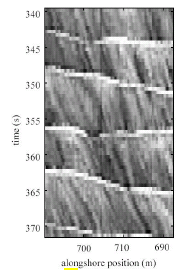
| 14:19, 4 April 2007 | Timestack4.png (file) |  |
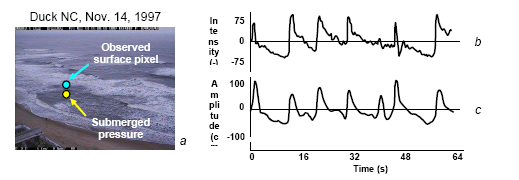
35 KB | Cohen | A time stack, collected at Duck NC. The time stack reveals the bright horizontal bands of passing breaking waves and the oblique traces of foam patches drifting with the prevailing longshore current. | 1 |
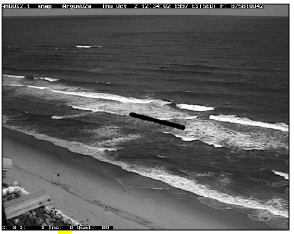
| 14:17, 4 April 2007 | Timestack3.png (file) |  |
66 KB | Cohen | Argus snapshot of the surf zone at Duck NC. The line indicates the location of the alongshore pixel array where the video record was taken. | 1 |
| 14:14, 4 April 2007 | Timestack2.png (file) | 63 KB | Cohen | An Argus time stack image collected along a cross-shore array at Duck, USA | 1 | |
| 14:11, 4 April 2007 | Timestack1.png (file) |  |
45 KB | Cohen | Argus timestack image | 1 |
| 14:02, 4 April 2007 | EgmondVar.jpg (file) |  |
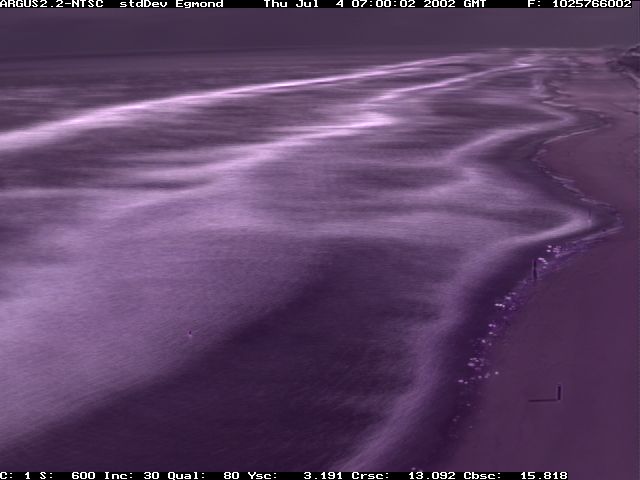
33 KB | Cohen | Argus variance image Egmond aan Zee | 1 |
| 14:01, 4 April 2007 | EgmondTimex.jpg (file) |  |
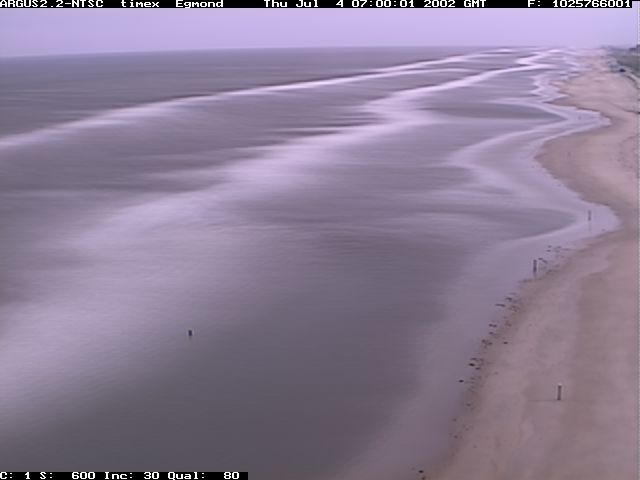
24 KB | Cohen | Argus time exposure image Egmond aan Zee | 1 |
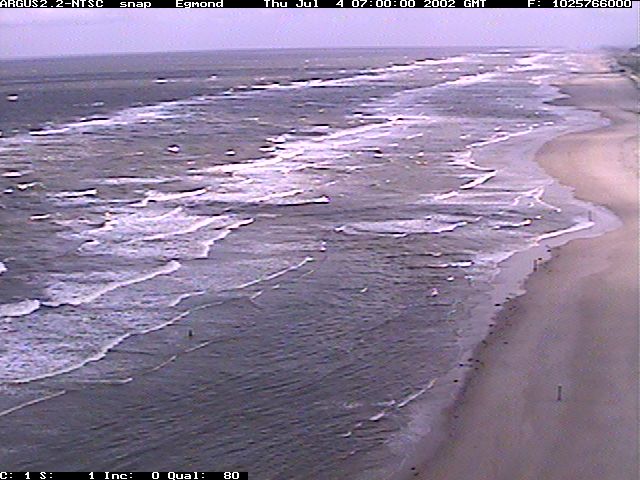
| 14:00, 4 April 2007 | EgmondSnap.jpg (file) |  |
64 KB | Cohen | Argus snapshot image Egmond aan Zee | 1 |
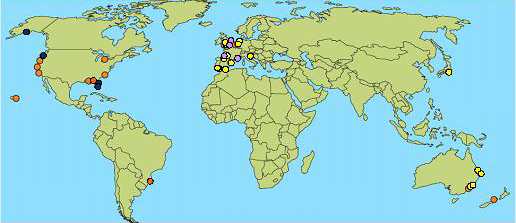
| 13:53, 4 April 2007 | ArgusWorld.png (file) |  |
136 KB | Cohen | Argus map of the world | 1 |
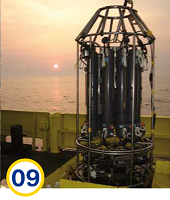
| 10:20, 4 April 2007 | Theme9.png (file) |  |
77 KB | Cliviahaese | 1 | |
| 10:14, 4 April 2007 | Theme9.PNG (file) |  |
77 KB | Cliviahaese | 1 | |
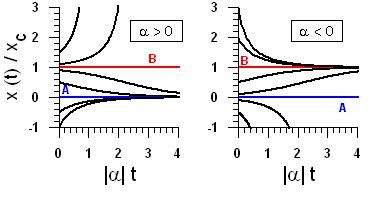
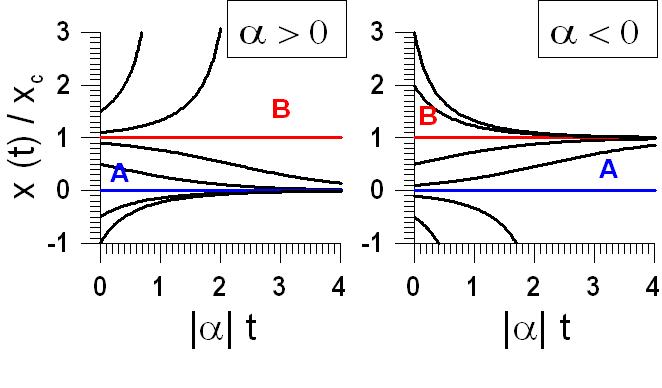
| 12:58, 3 April 2007 | Stability1.jpg (file) |  |
16 KB | Falques | 1 | |
| 12:28, 3 April 2007 | Stability1.JPG (file) |  |
16 KB | Falques | 2 | |
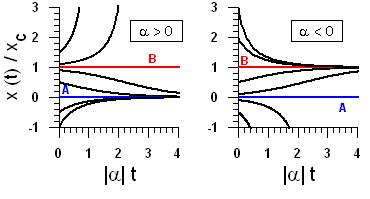
| 12:23, 3 April 2007 | Stability.JPG (file) |  |
16 KB | Falques | 2 | |
| 11:58, 3 April 2007 | Stability.jpg (file) |  |
36 KB | Falques | 1 | |
| 15:53, 2 April 2007 | Caixa1.jpg (file) |  |
71 KB | Falques | 1 | |
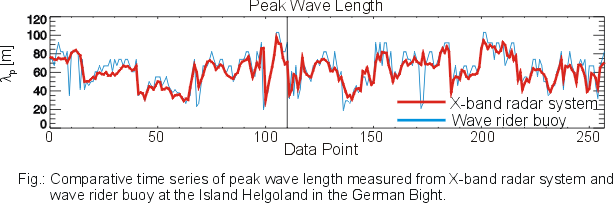
| 15:53, 2 April 2007 | HEL Lp time.png (file) |  |
35 KB | InaTrankmann | Fig.: Comparative time series of peak wave length measured from X-band radar system and wave rider buoy at the Island Helgoland in the German Bight. | 1 |
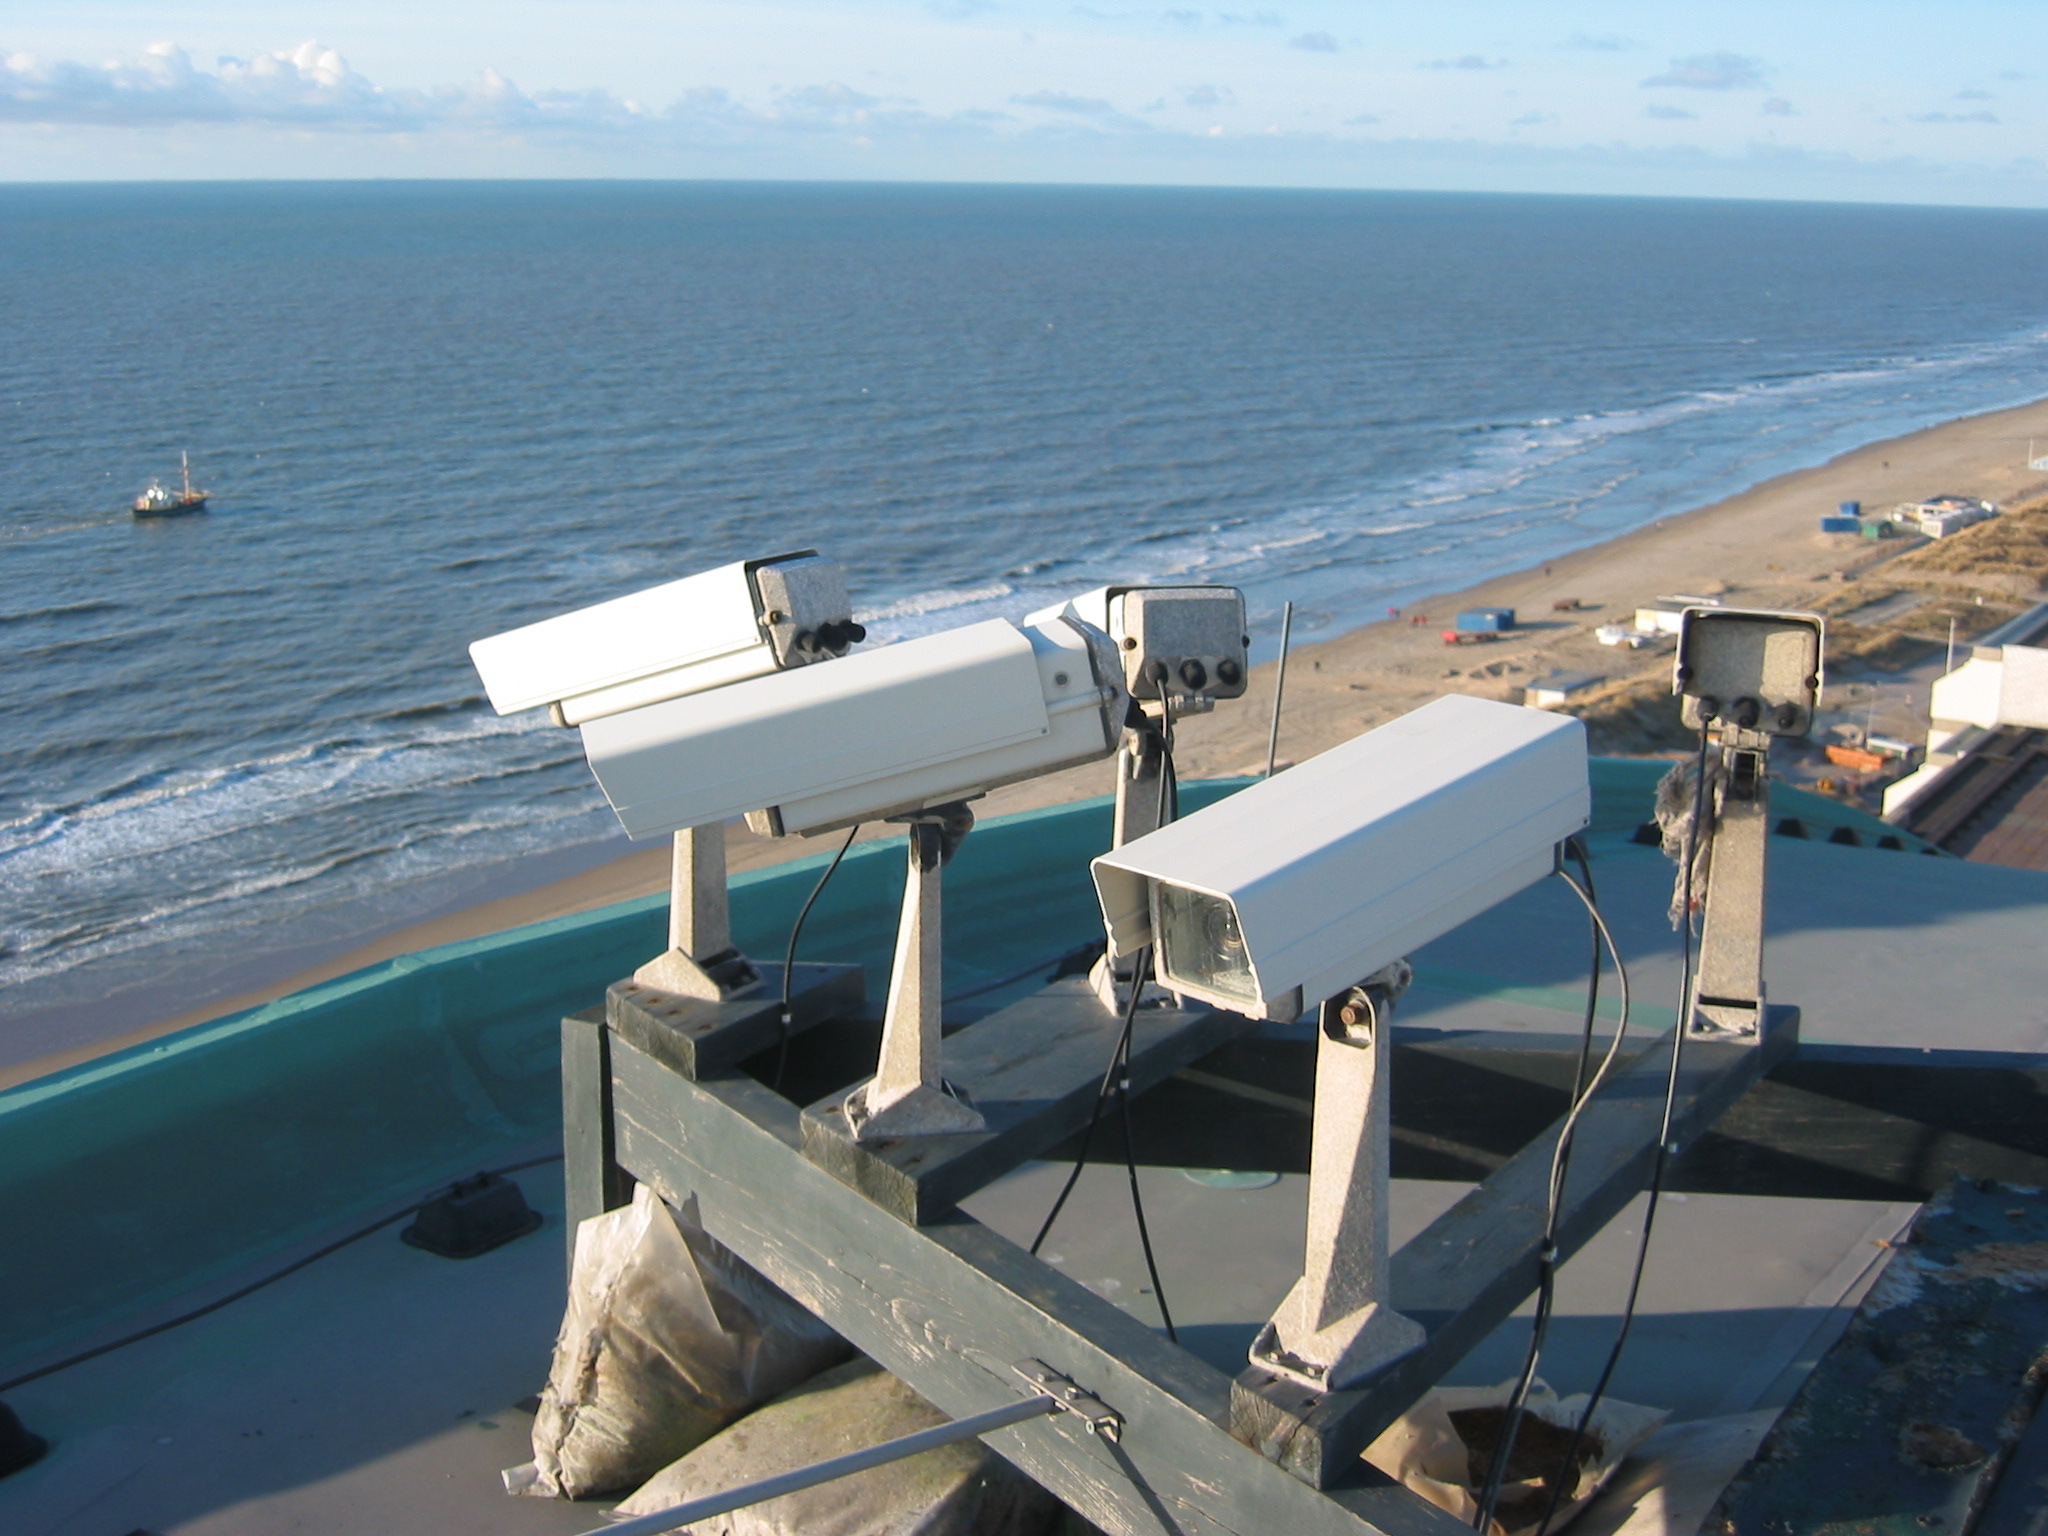
| 11:45, 2 April 2007 | CameraNoordwijk.JPG (file) |  |
648 KB | Cohen | Argus video cameras in Noordwijk aan Zee | 1 |
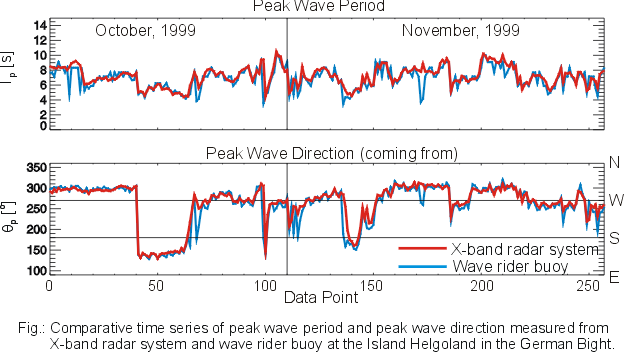
| 11:27, 1 April 2007 | HEL Tp Dir time.png (file) |  |
59 KB | InaTrankmann | Comparative time series of peak wave period and peak wave direction measured from X-band radar system and wave rider buoy at the Island Helgoland in the German Bight. | 1 |
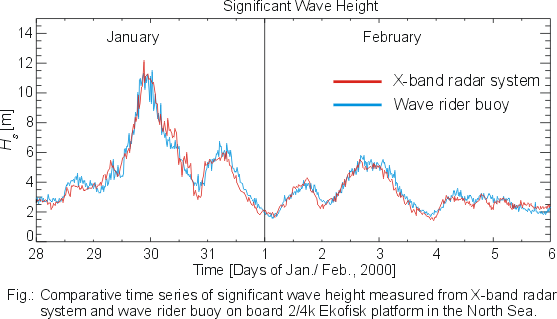
| 11:05, 1 April 2007 | EKF Hs 2000.png (file) |  |
34 KB | InaTrankmann | Comparative time series of significant wave height measured from X-band radar system and wave rider buoy on board 2/4k Ekofisk platform in the North Sea. | 1 |
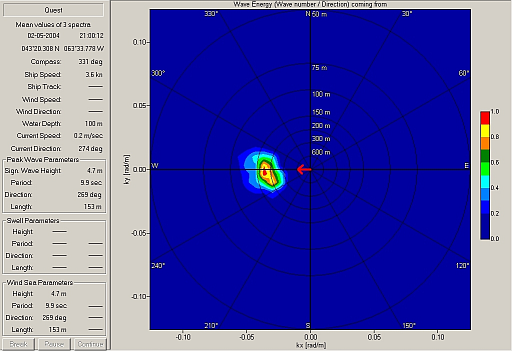
| 10:39, 1 April 2007 | QST 02052100 D2S.png (file) |  |
122 KB | InaTrankmann | 2-Dimensional Frequency-Direction Spectrum obtained by a X-band radar system on board a vessel. | 1 |
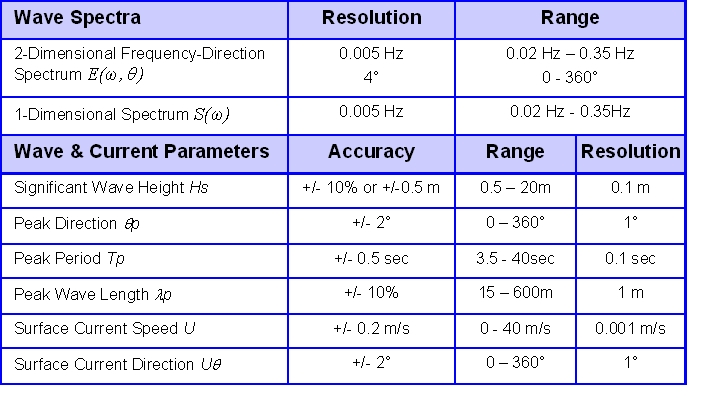
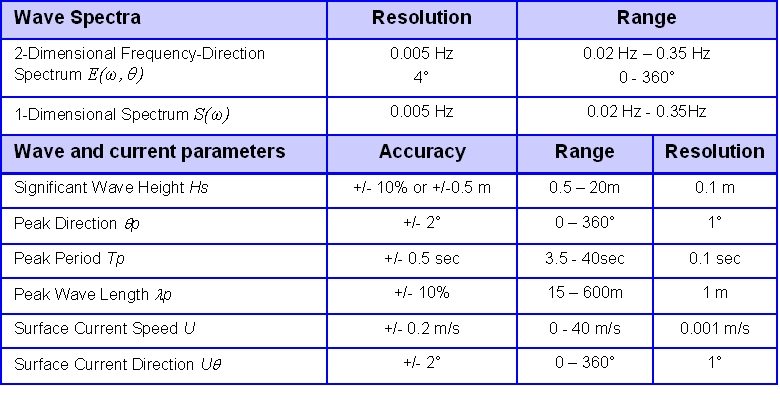
| 10:27, 1 April 2007 | Accuracy.png (file) |  |
43 KB | InaTrankmann | Standard output parameters of a X-dand radar system with corresponding resolutions, ranges, and accuracy. | 2 |
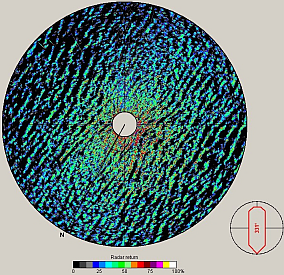
| 10:24, 1 April 2007 | QST 02052100pol.png (file) |  |
148 KB | InaTrankmann | Example of a radar image obtained on board a vessel. | 1 |
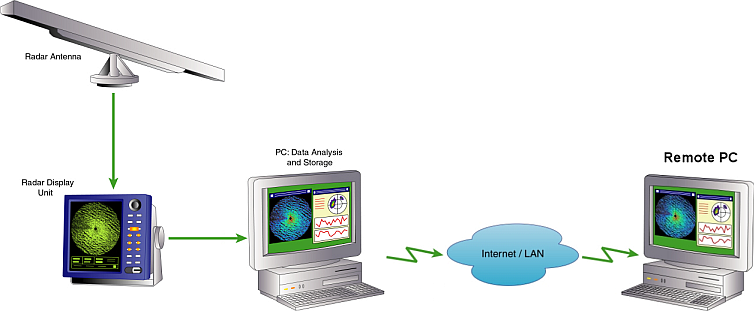
| 10:18, 1 April 2007 | Radar system.png (file) |  |
107 KB | InaTrankmann | Components of a X-band radar system | 1 |
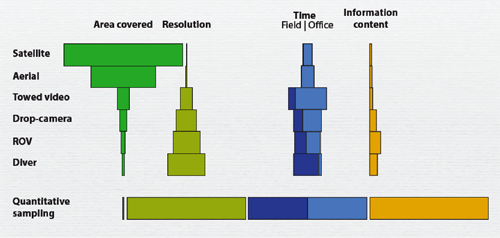
| 17:52, 31 March 2007 | UWVideo Fig1.png (file) |  |
101 KB | Pjo | Figure 1 in Underwater Video, showing relations between different mapping methods. | 1 |
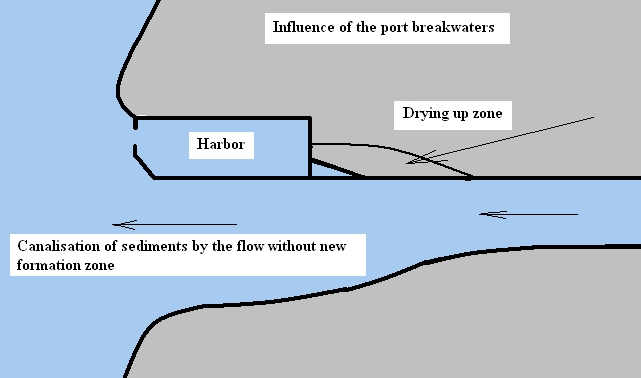
| 15:13, 31 March 2007 | Figure 3.JPG (file) |  |
57 KB | BELORGEY Michel | 1 | |
| 14:01, 31 March 2007 | Accuracy3.jpg (file) |  |
121 KB | InaTrankmann | 1 | |
| 13:49, 31 March 2007 | Accuracy.jpg (file) |  |
121 KB | InaTrankmann | 1 |