File list
This special page shows all uploaded files.
| Date | Name | Thumbnail | Size | Description | Versions |
|---|---|---|---|---|---|
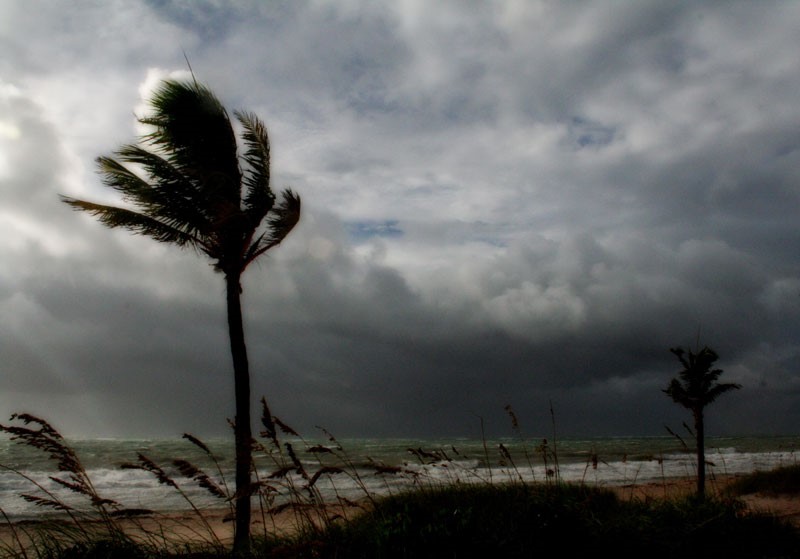
| 09:34, 5 November 2016 | PrinosFig1.1.jpg (file) |  |
66 KB | Strong winds generating large waves and storm surge in Ft. Lauderdale, FL, during Hurricane Ernesto in 2006. | 1 |
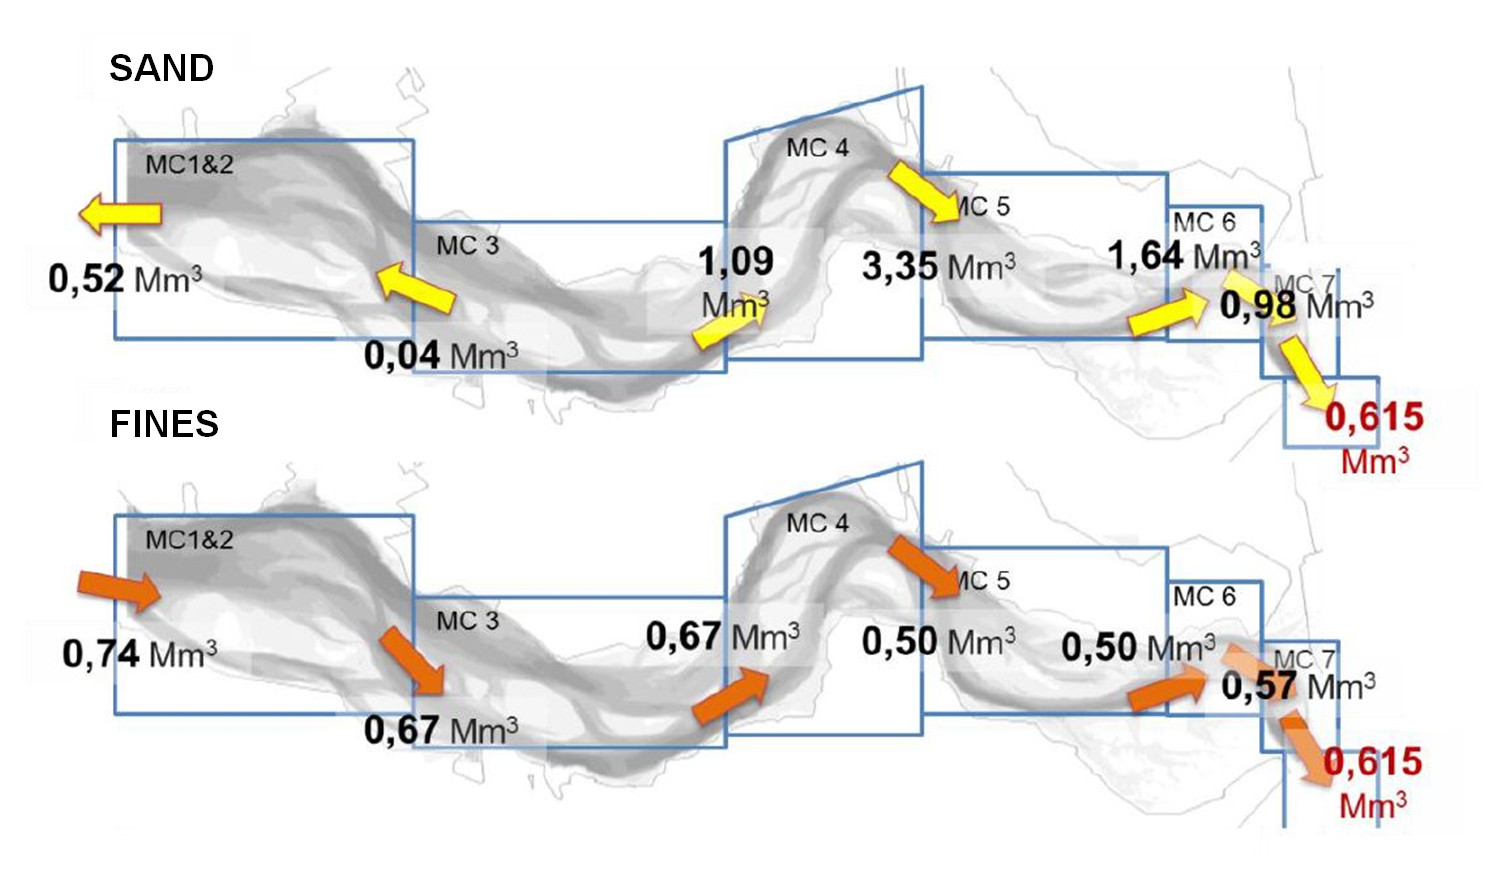
| 17:48, 2 November 2016 | FigHuib13.jpg (file) |  |
168 KB | Sediment balance Westerschelde. | 1 |
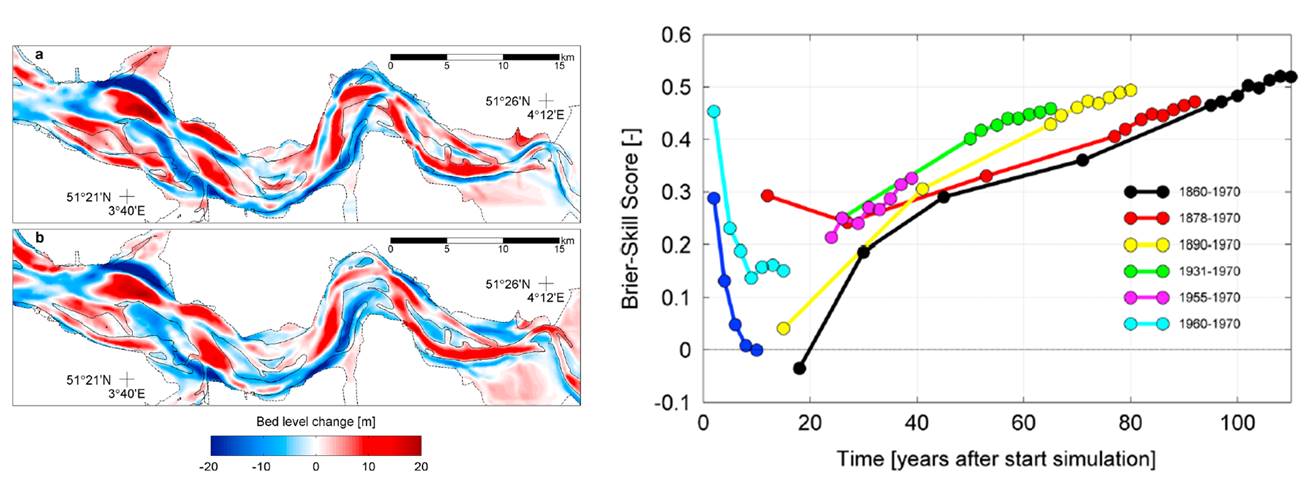
| 17:47, 2 November 2016 | FigHuib12.jpg (file) |  |
82 KB | Brier Skill Score of the FINEL-model. | 1 |
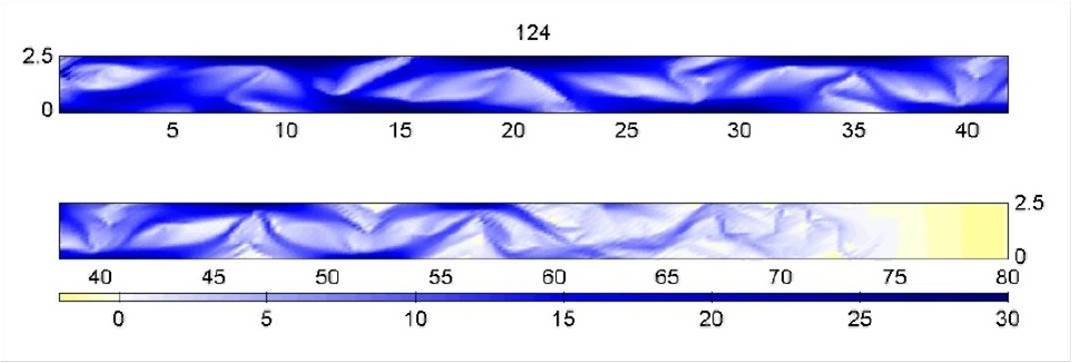
| 17:47, 2 November 2016 | FigHuib11.jpg (file) |  |
184 KB | Morphological evolution of the Westerschelde. | 1 |
| 17:46, 2 November 2016 | FigHuib10.jpg (file) |  |
38 KB | Morphological evolution in a hypothetical estuary of constant width. | 1 |
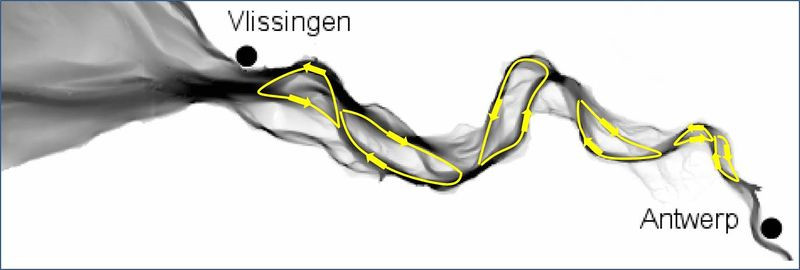
| 17:45, 2 November 2016 | FigHuib9.jpg (file) |  |
32 KB | Residual circulation cells Westerschelde. | 1 |
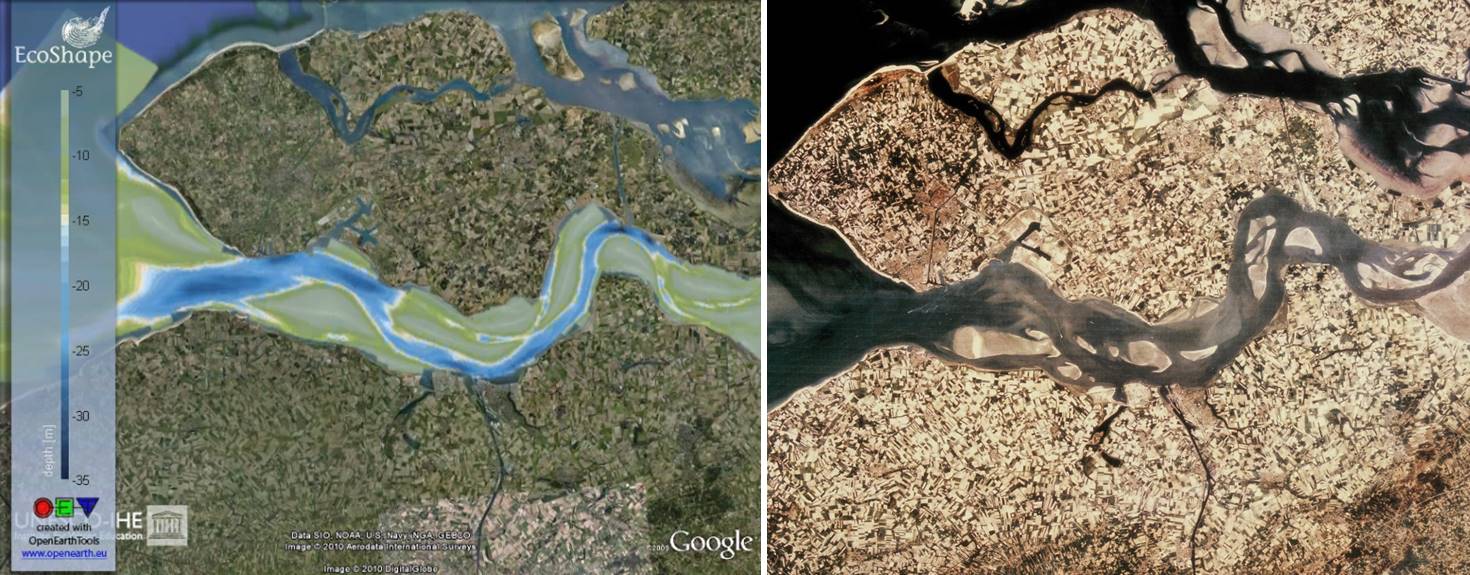
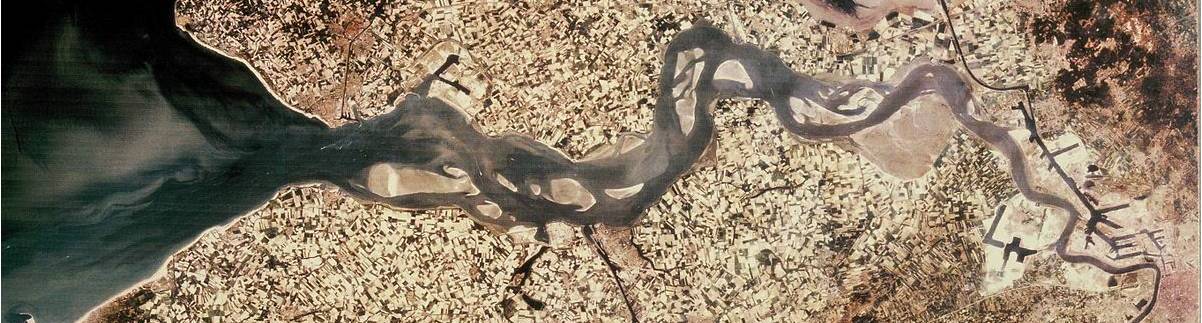
| 17:44, 2 November 2016 | FigHuib8.jpg (file) | 116 KB | Westerschelde. | 1 | |
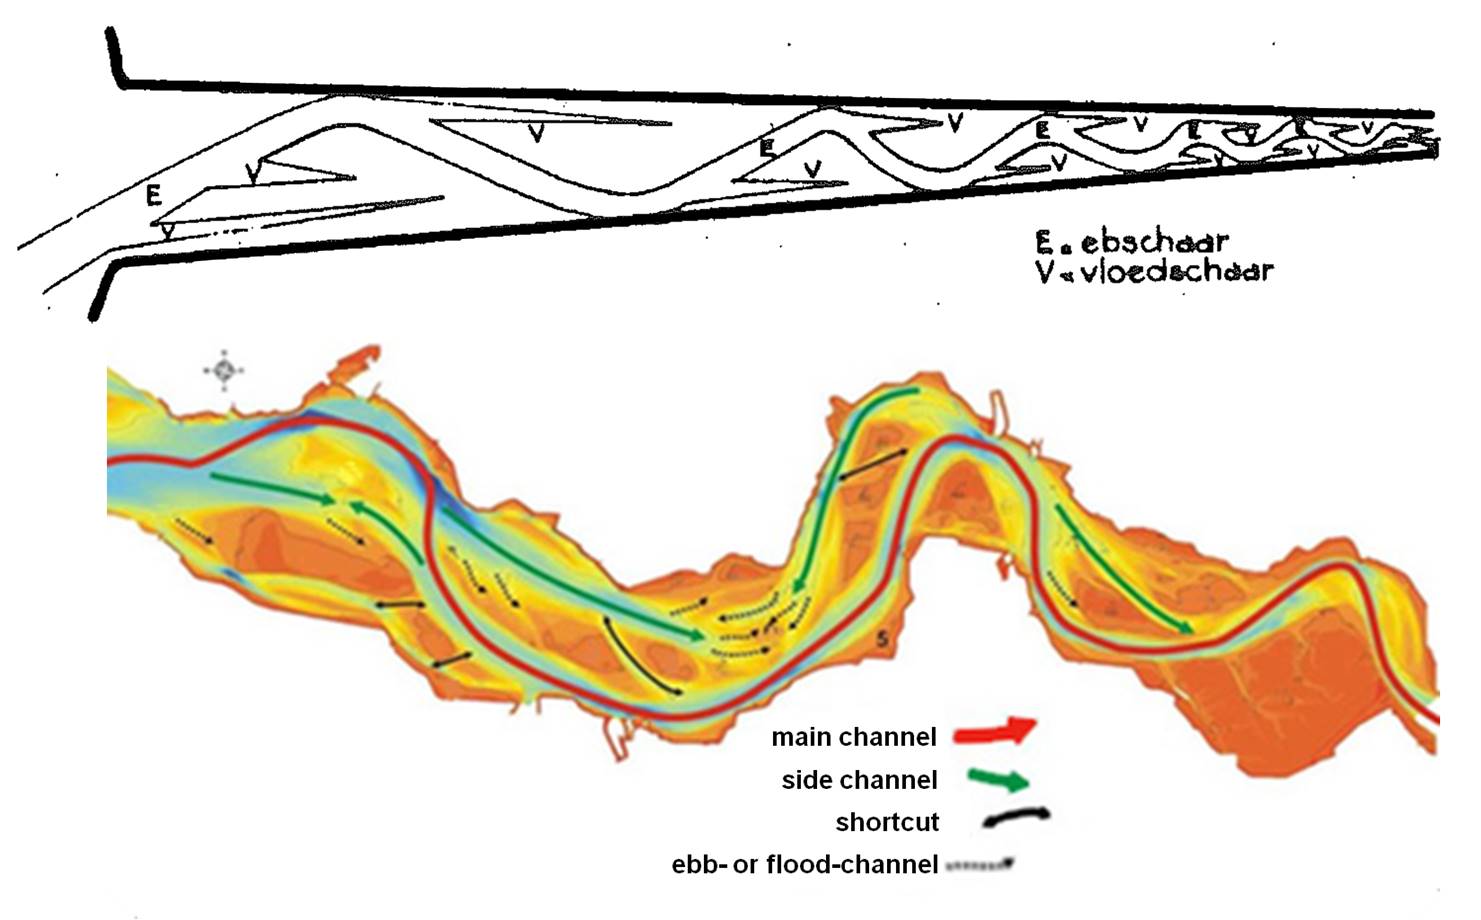
| 17:43, 2 November 2016 | FigHuib7.jpg (file) |  |
105 KB | Poplar tree channel network structure. | 1 |
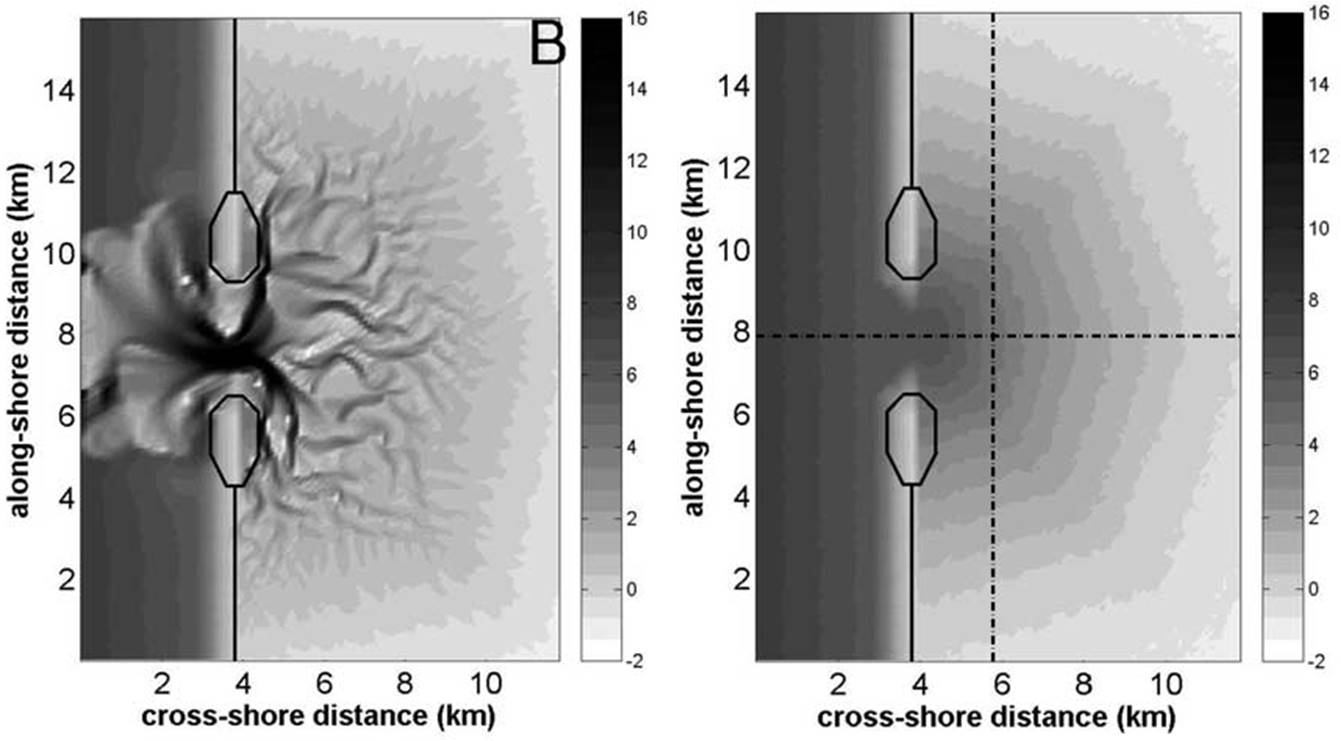
| 17:42, 2 November 2016 | FigHuib6.jpg (file) |  |
72 KB | Delft3D set-up and result. | 1 |
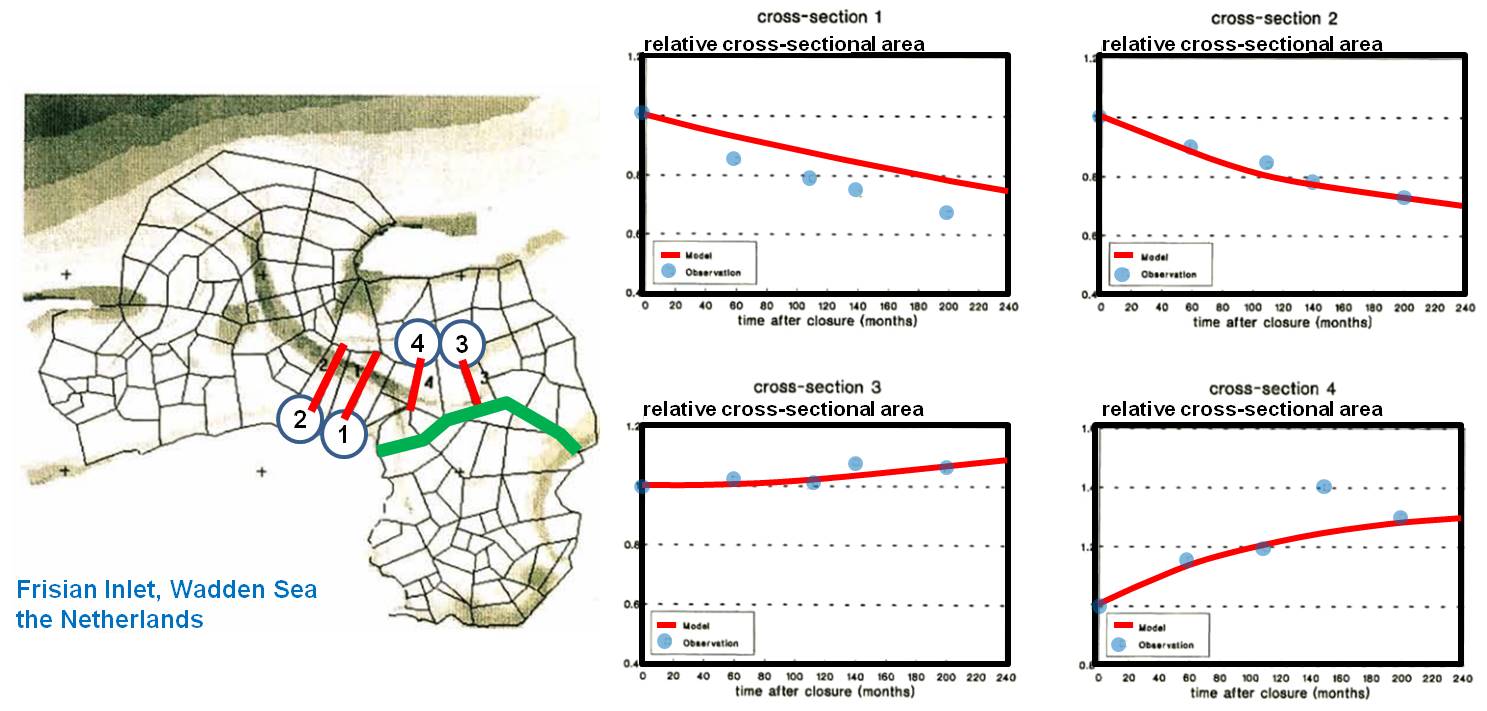
| 17:41, 2 November 2016 | FigHuib5.jpg (file) |  |
126 KB | ESTMORF set-up and Frisian Inlet result. | 1 |
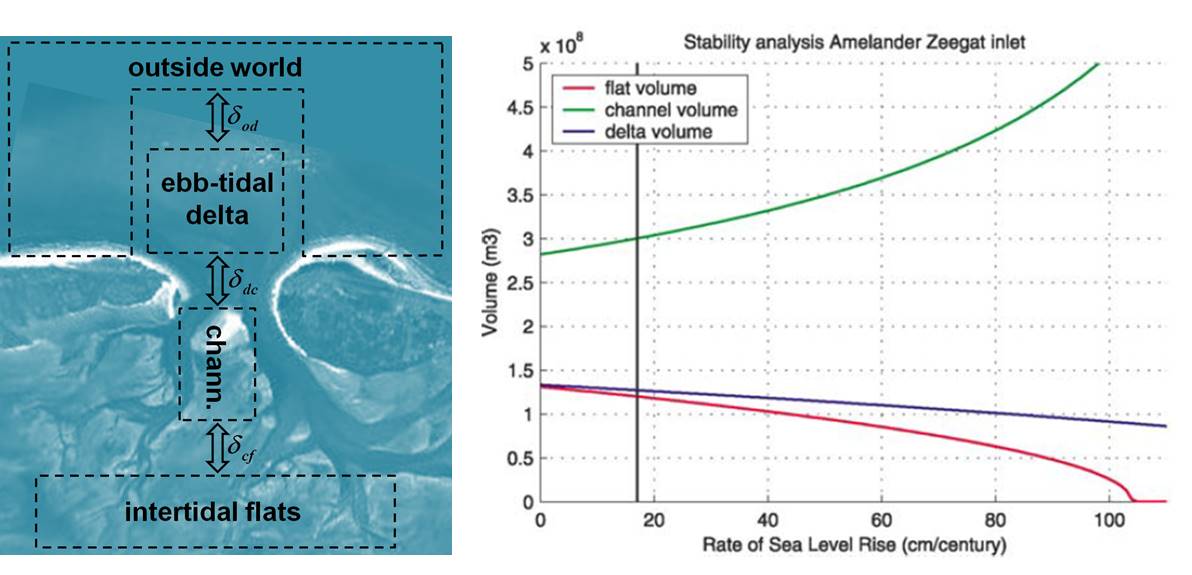
| 17:40, 2 November 2016 | FigHuib4.jpg (file) |  |
71 KB | ASMITA set-up and Wadden Sea result. | 1 |
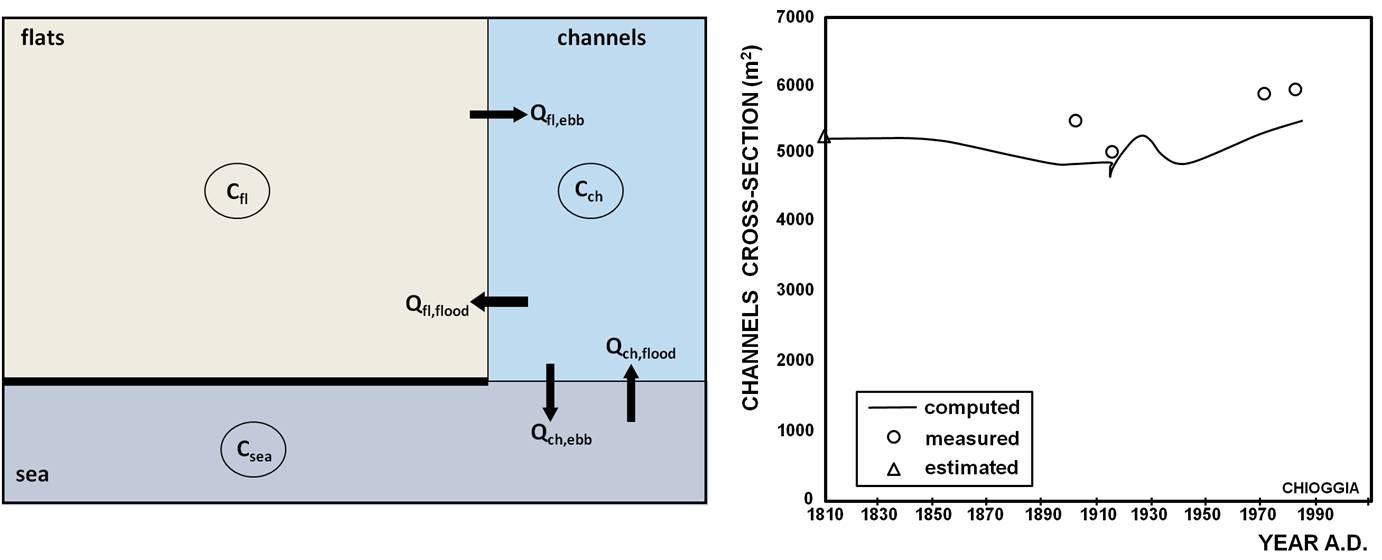
| 17:39, 2 November 2016 | FigHuib3.jpg (file) |  |
52 KB | Model set-up Venice lagoon and result. | 1 |
| 17:35, 2 November 2016 | FigHuib2.jpg (file) |  |
119 KB | Apple tree channel network structure. | 1 |
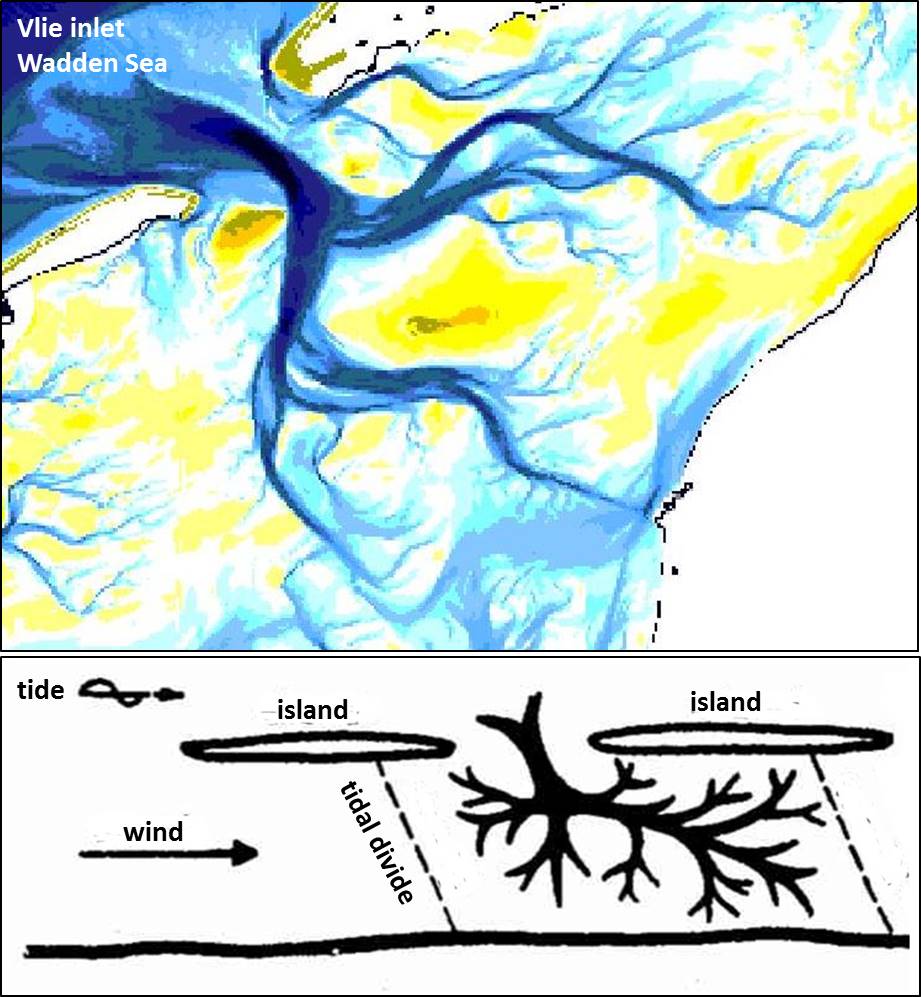
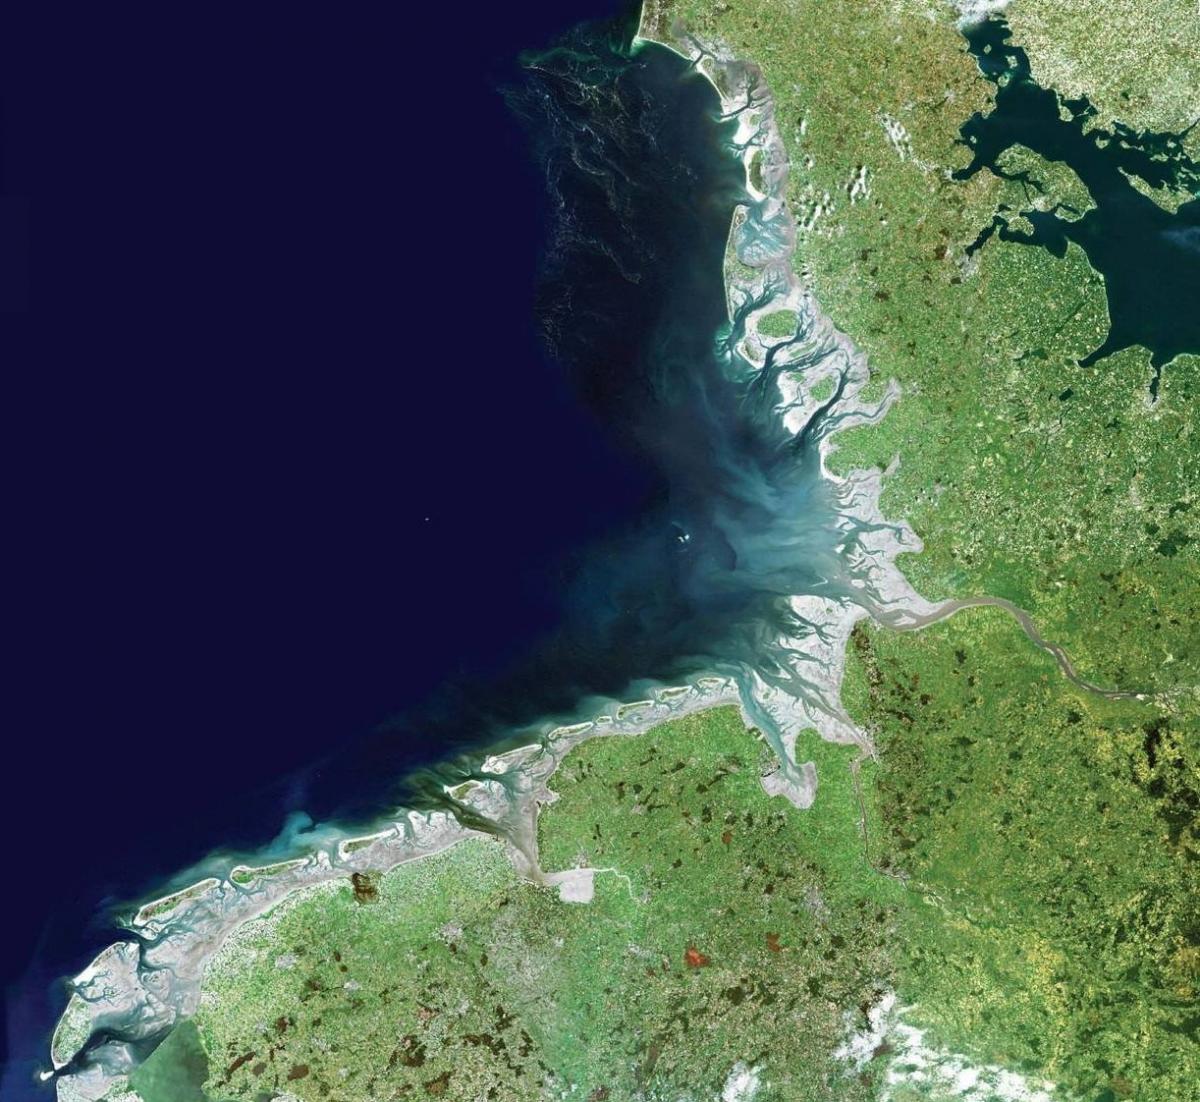
| 17:33, 2 November 2016 | FigHuib1.jpg (file) |  |
209 KB | Northwest European Wadden Sea. | 1 |
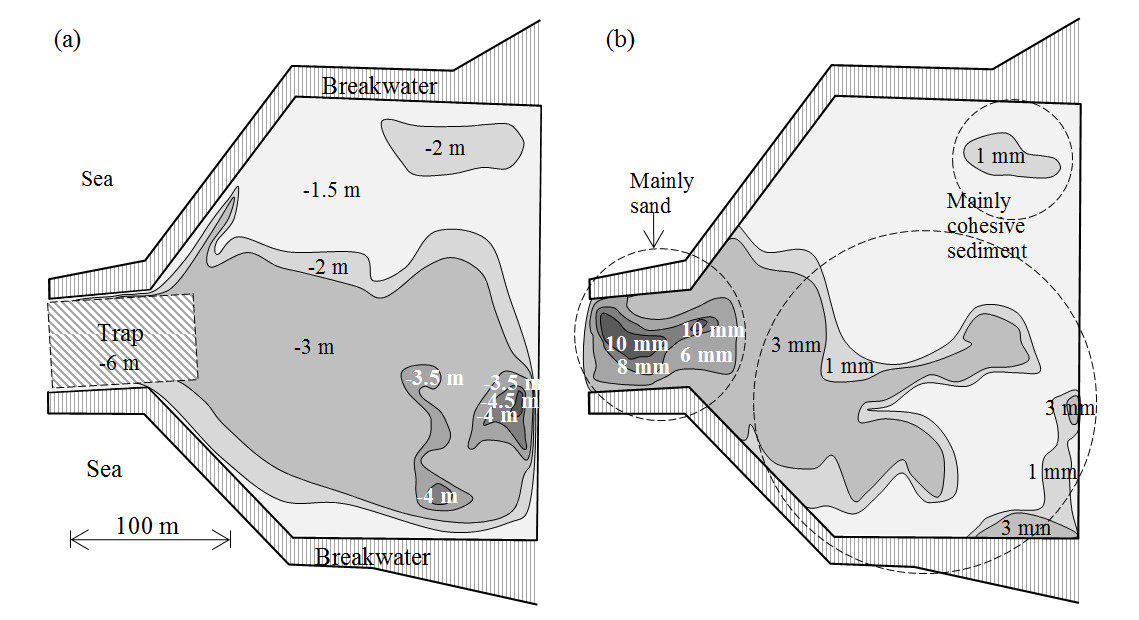
| 10:34, 17 October 2016 | MehtaFig16.jpg (file) |  |
130 KB | Sedimentation in a boat basin: (a) Depths in the basin relative to MSL, (b) simulated sediment influx over 30 days. | 1 |
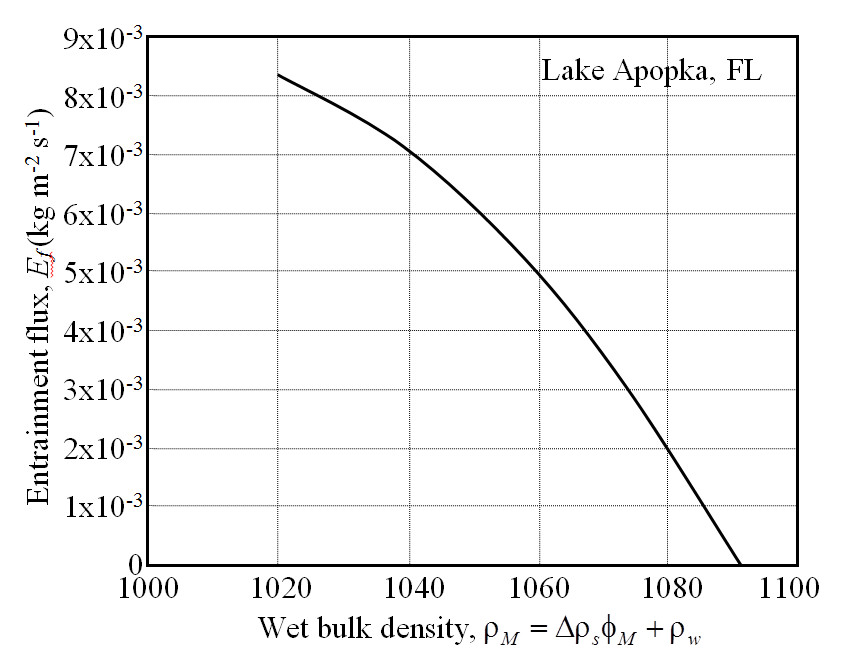
| 10:32, 17 October 2016 | MehtaFig15.jpg (file) |  |
79 KB | Dependence of fluid mud entrainment flux on wet bulk density. | 1 |
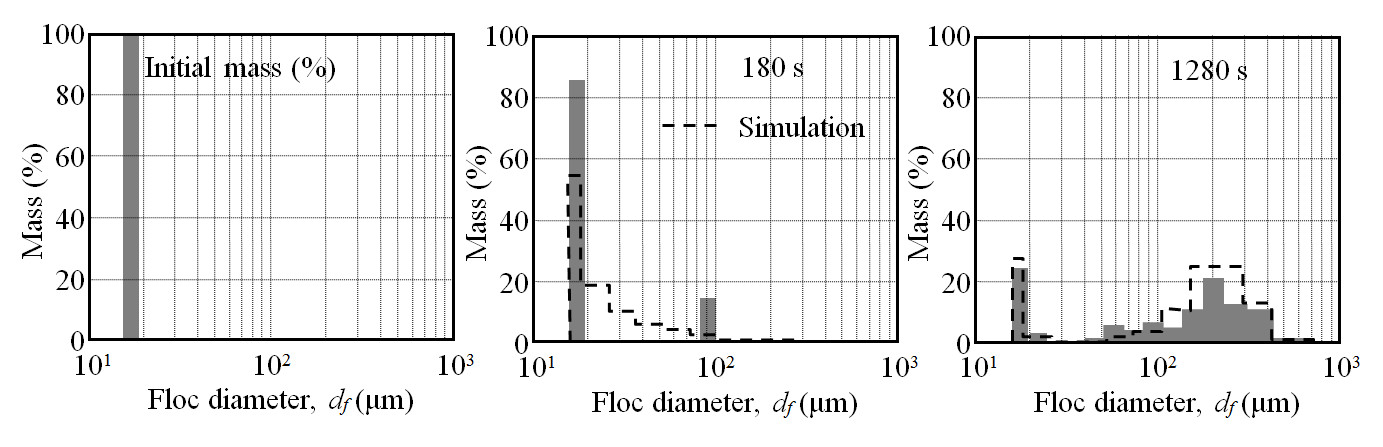
| 10:29, 17 October 2016 | MehtaFig14.jpg (file) |  |
132 KB | Development of bimodal macrofloc diameter distribution from uniform microflocs. | 1 |
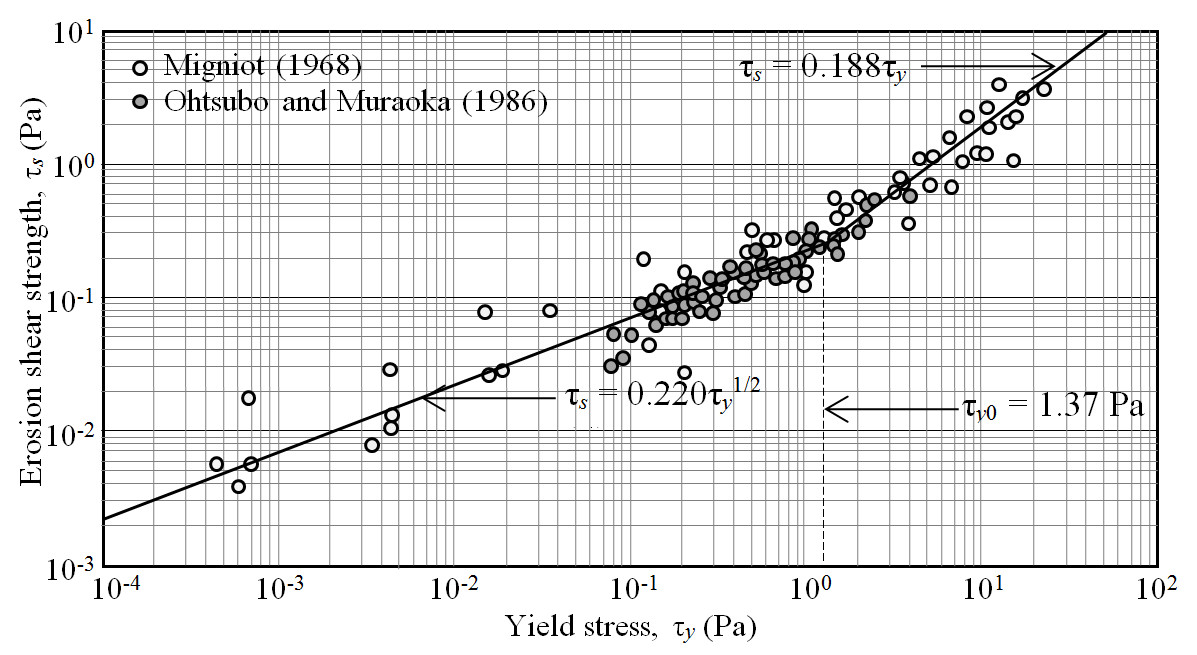
| 10:26, 17 October 2016 | MehtaFig13.jpg (file) |  |
122 KB | Relationship between bed floc erosion shear strength and viscoplastic yield stress. | 1 |
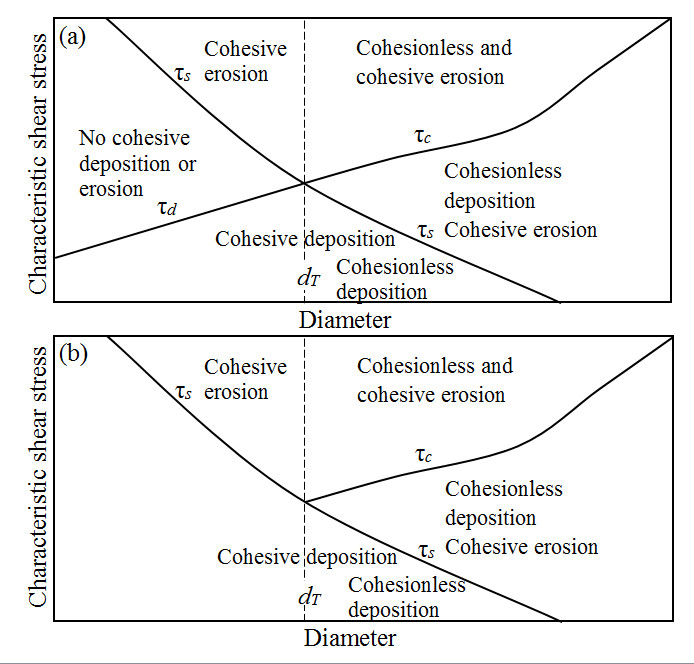
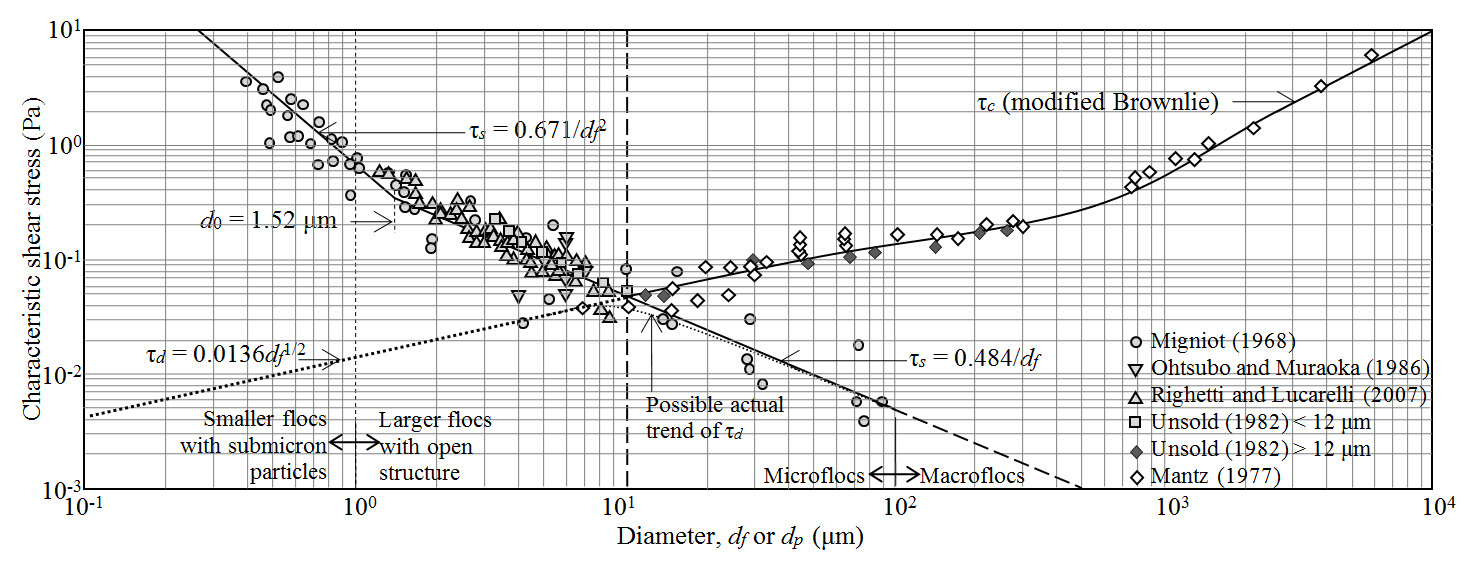
| 10:24, 17 October 2016 | MehtaFig12.jpg (file) |  |
243 KB | Characteristic shear stresses defined by their relationship to floc/particle diameter. | 1 |
| 10:21, 17 October 2016 | MehtaFig11.jpg (file) |  |
178 KB | Relationship between bed floc erosion shear strength and viscoplastic yield stress. | 1 |
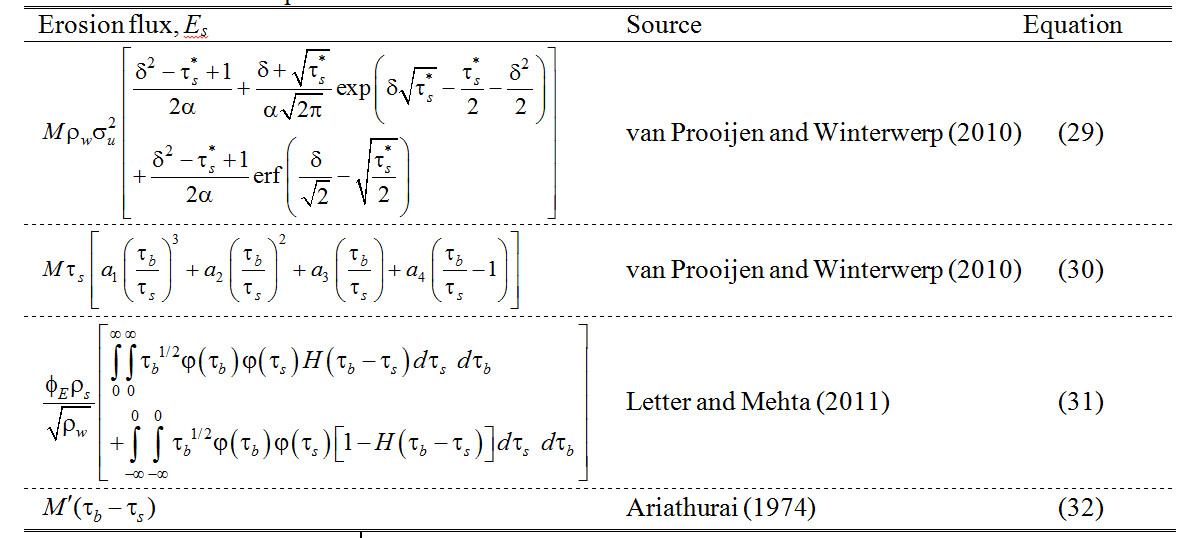
| 10:17, 17 October 2016 | MehtaTable2.jpg (file) |  |
149 KB | Erosion flux equations. | 1 |
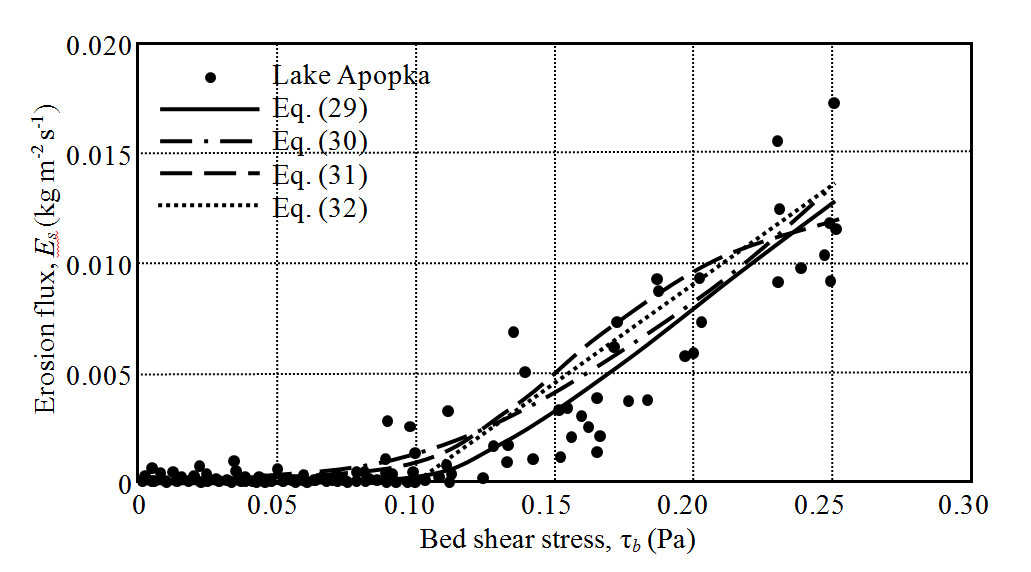
| 10:13, 17 October 2016 | MehtaFig10.jpg (file) |  |
107 KB | Erosion flux against bed shear stress. | 1 |
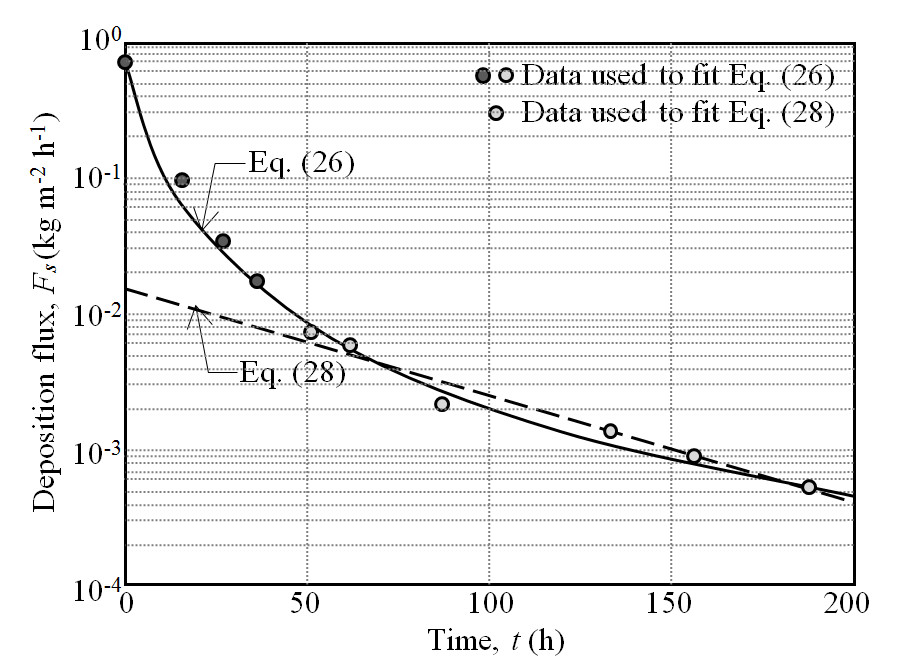
| 10:09, 17 October 2016 | MehtaFig9.jpg (file) |  |
136 KB | Deposition flux of flocculated sediment from the San Francisco Bay tested in a flume. | 1 |
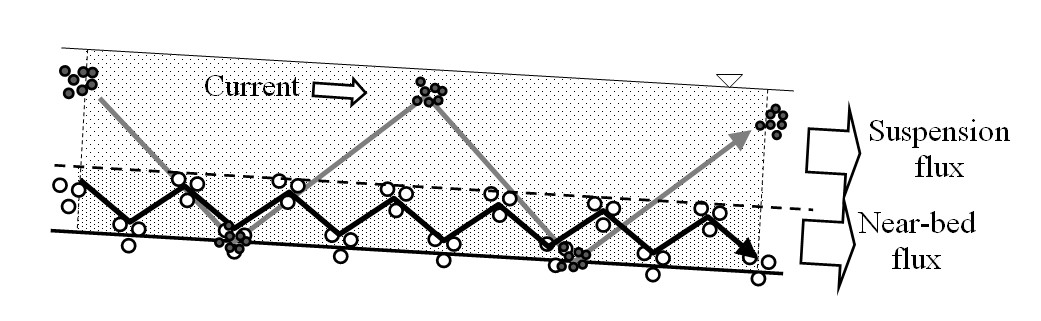
| 10:07, 17 October 2016 | MehtaFig8.jpg (file) |  |
97 KB | Schematic of transport of cohesionless bed material in turbulent flow along a channel reach. | 1 |
| 10:05, 17 October 2016 | MehtaFig7.jpg (file) |  |
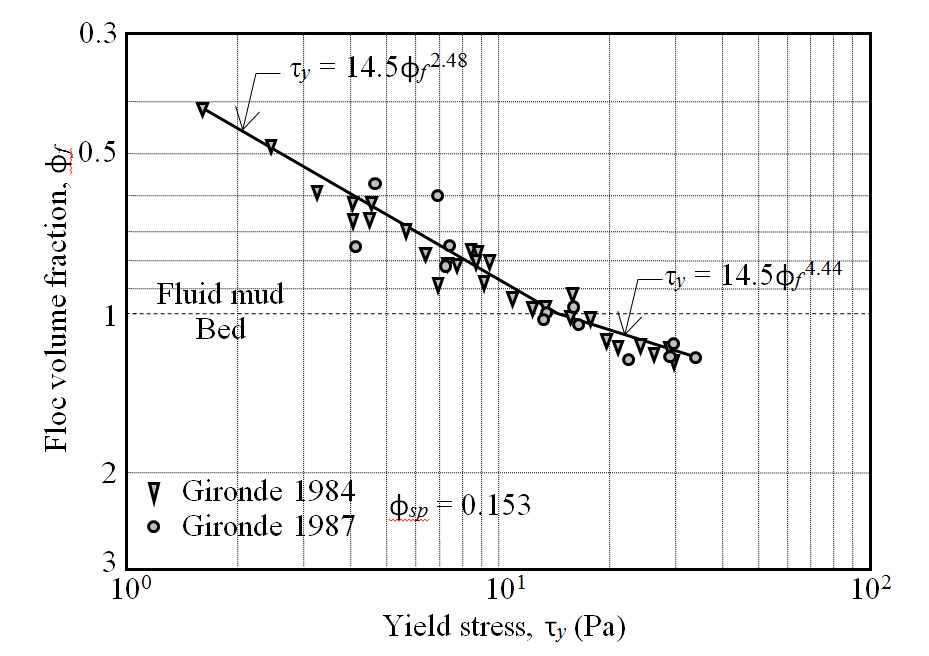
109 KB | Yield stress variation with floc volume fraction for the Gironde sediment. | 1 |
| 10:03, 17 October 2016 | MehtaFig6.jpg (file) |  |
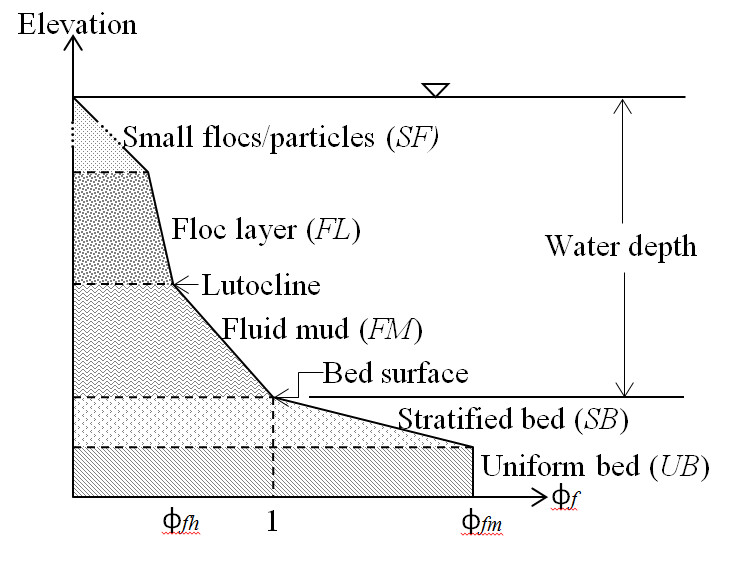
73 KB | Layered structure of flocculated sediment in water and in the bed. | 1 |
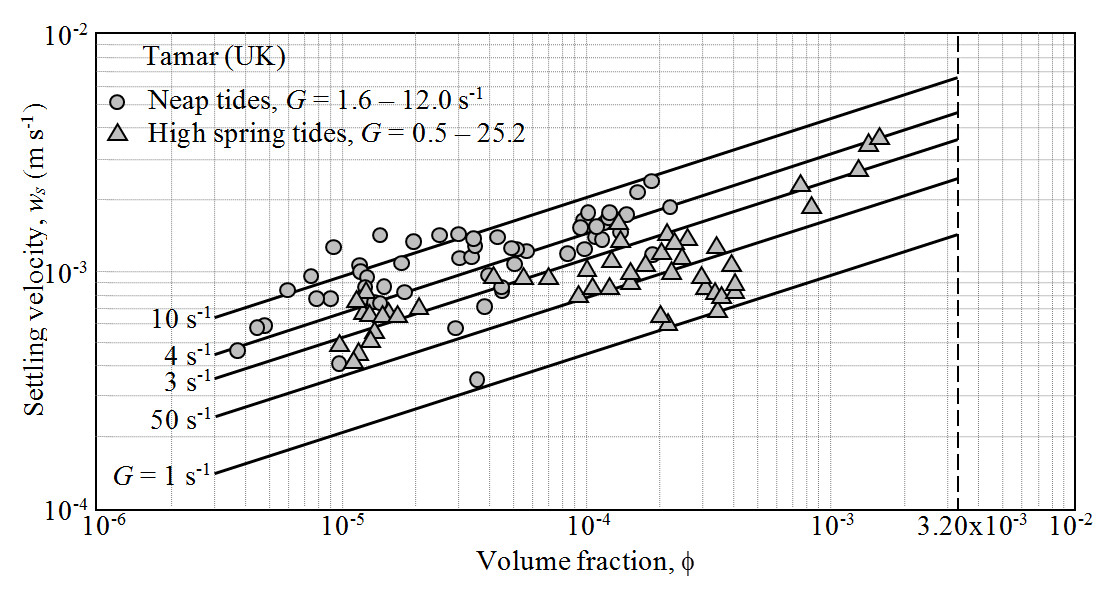
| 10:01, 17 October 2016 | MehtaFig5.jpg (file) |  |
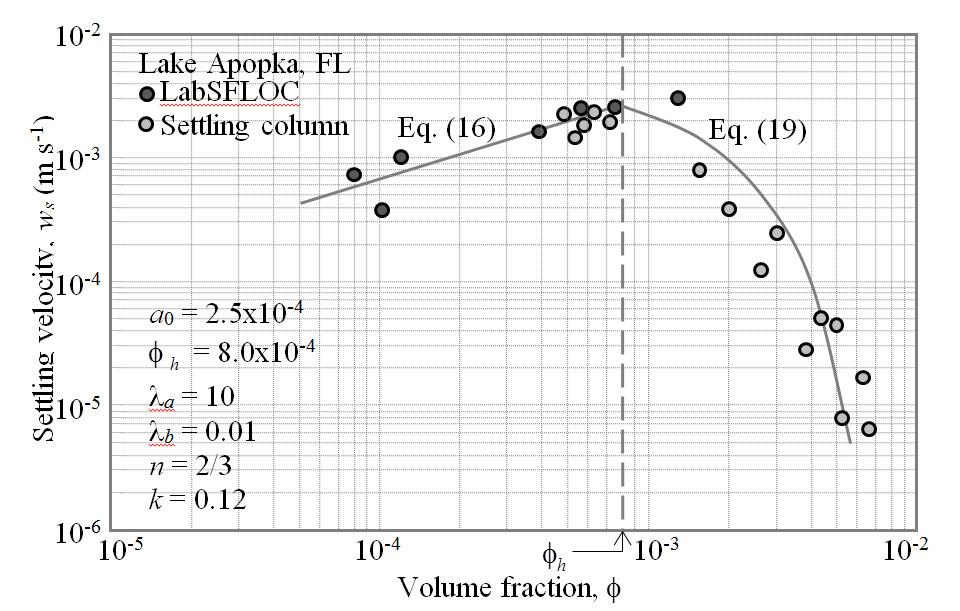
155 KB | Settling velocity as a function of volume fraction. | 1 |
| 09:59, 17 October 2016 | MehtaFig4.jpg (file) |  |
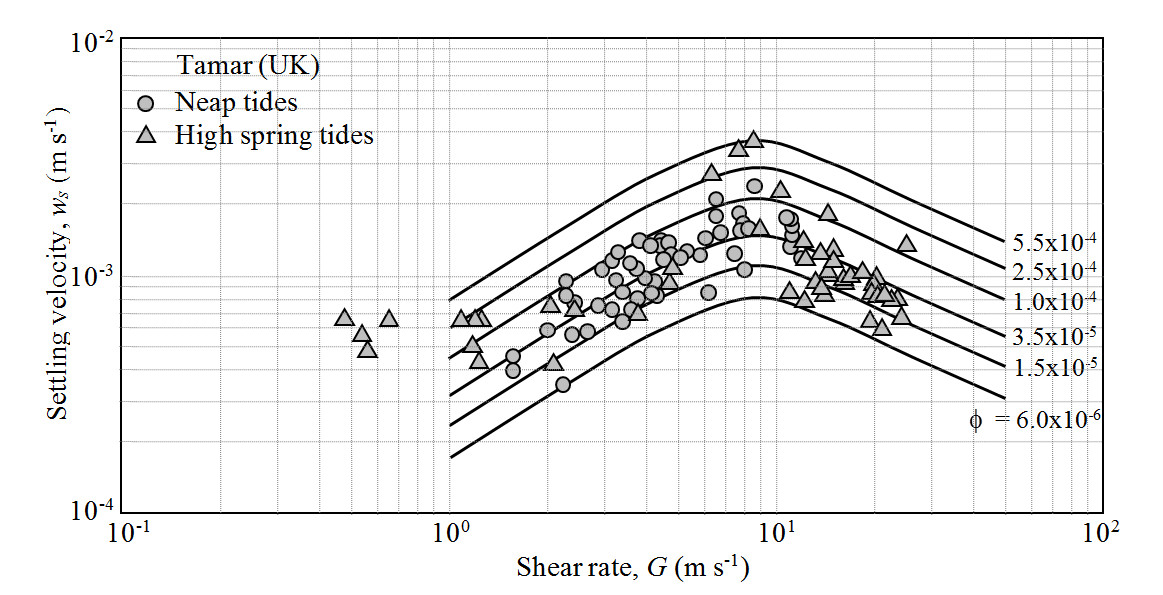
166 KB | Variation of floc settling velocity with shear rate and volume fraction. | 1 |
| 09:55, 17 October 2016 | MehtaFig3.jpg (file) |  |
188 KB | Variation of floc settling velocity with volume fraction and shear rate. | 1 |
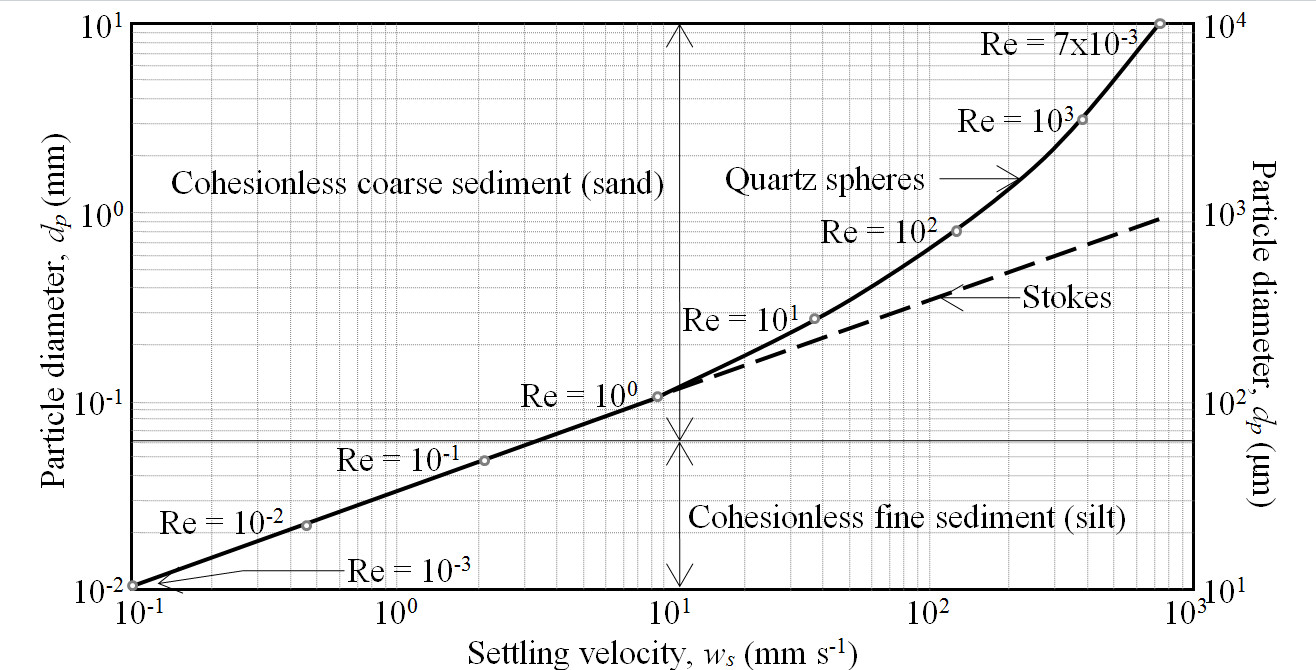
| 09:48, 17 October 2016 | MehtaFig1.jpg (file) |  |
213 KB | Particle diameter as a function of settling velocity. | 1 |
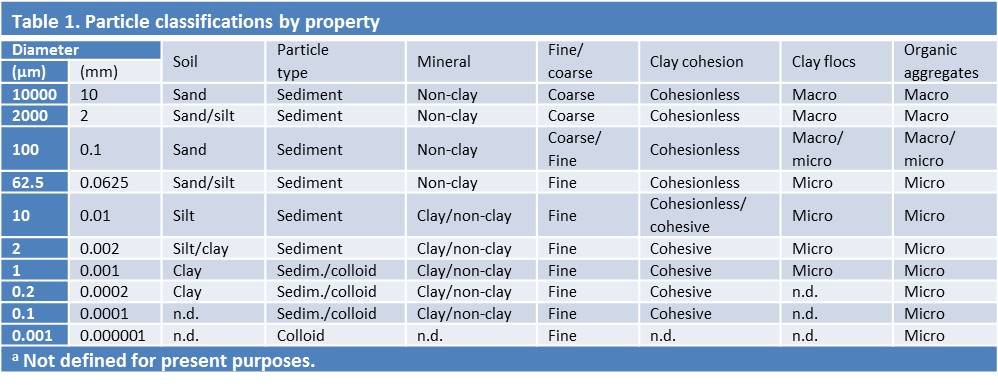
| 09:44, 17 October 2016 | MehtaTable1.jpg (file) |  |
74 KB | Particle classifications by property. | 1 |
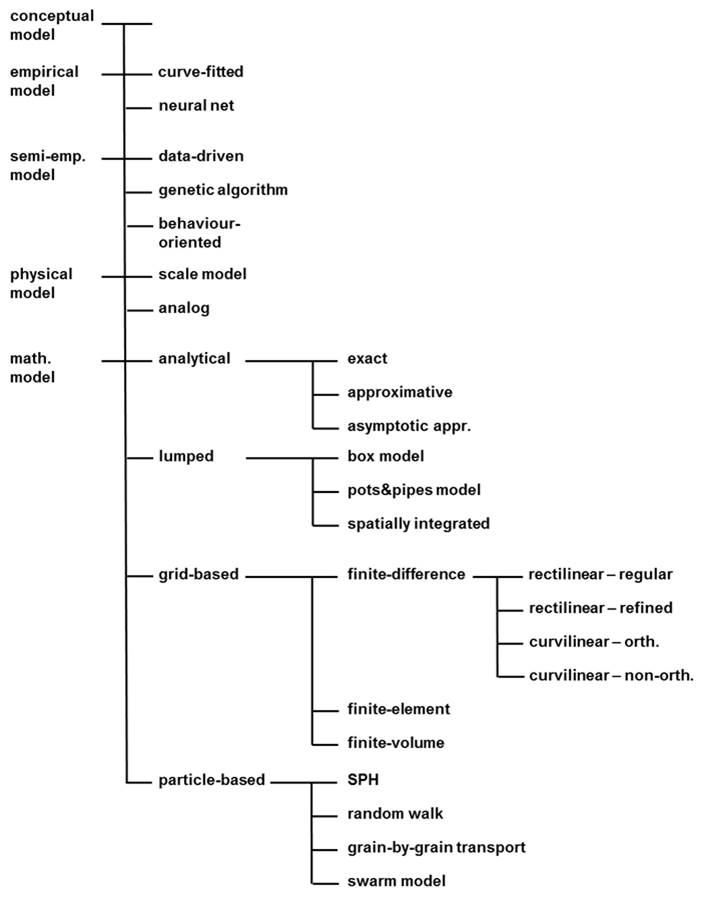
| 21:28, 15 October 2016 | HuibScheme.jpg (file) |  |
38 KB | Model tree. | 2 |
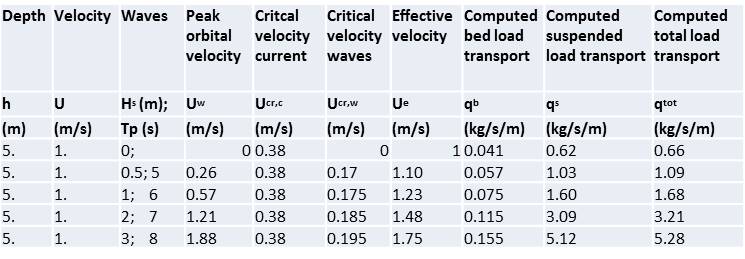
| 10:23, 11 October 2016 | VanRijnTable1.jpg (file) |  |
38 KB | Computed sand transport rates. | 1 |
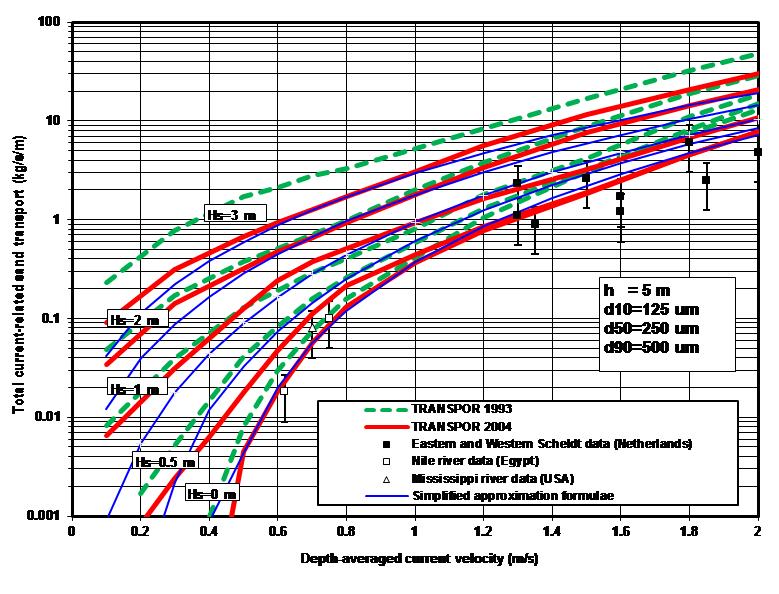
| 10:09, 11 October 2016 | VanRijnFig8.jpg (file) |  |
119 KB | Total sand transport for combined wave plus current conditions. | 1 |
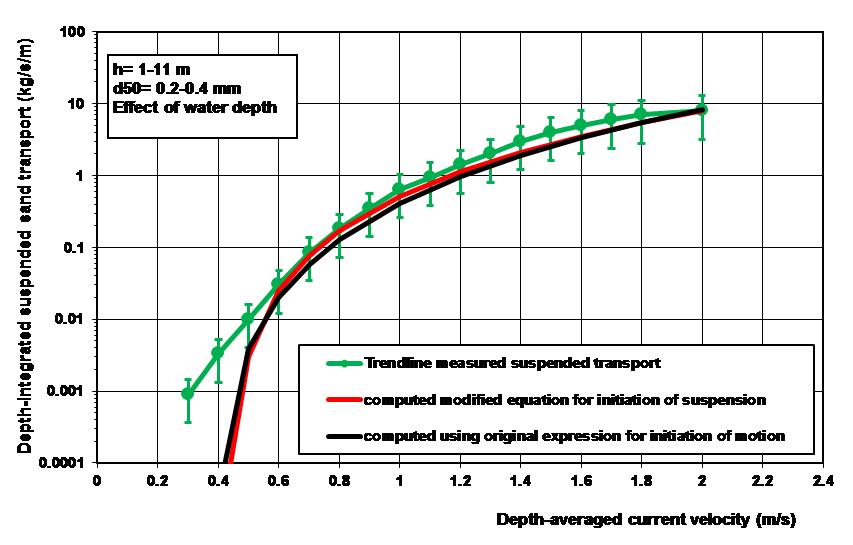
| 10:07, 11 October 2016 | VanRijnFig7.jpg (file) |  |
67 KB | Suspended transport as function of depth-averaged velocity. | 1 |
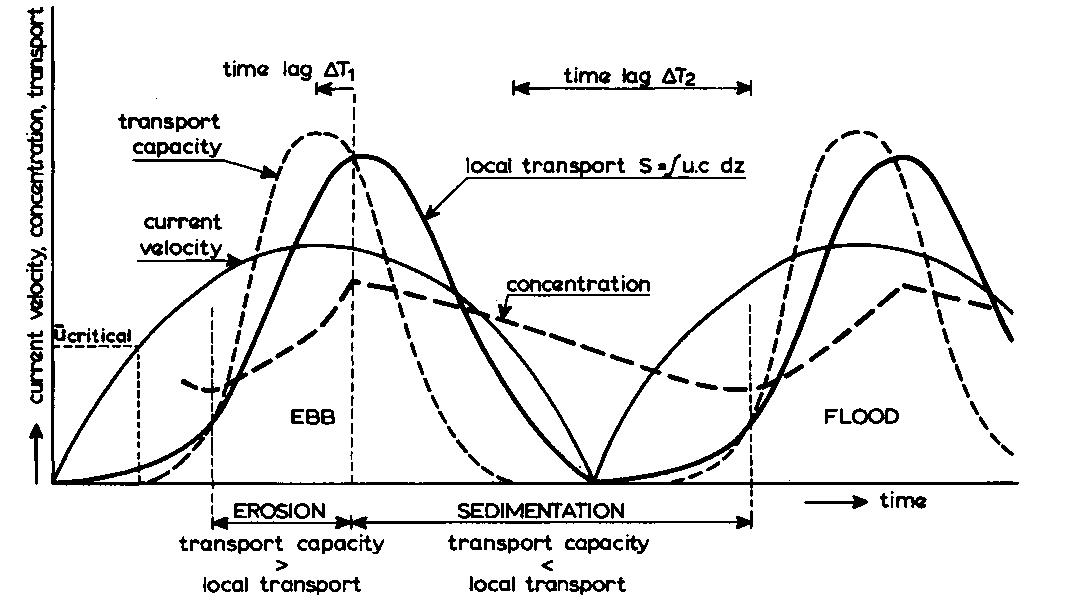
| 10:05, 11 October 2016 | VanRijnFig6.jpg (file) |  |
89 KB | Time lag of suspended sediment concentration in tidal flow. | 1 |
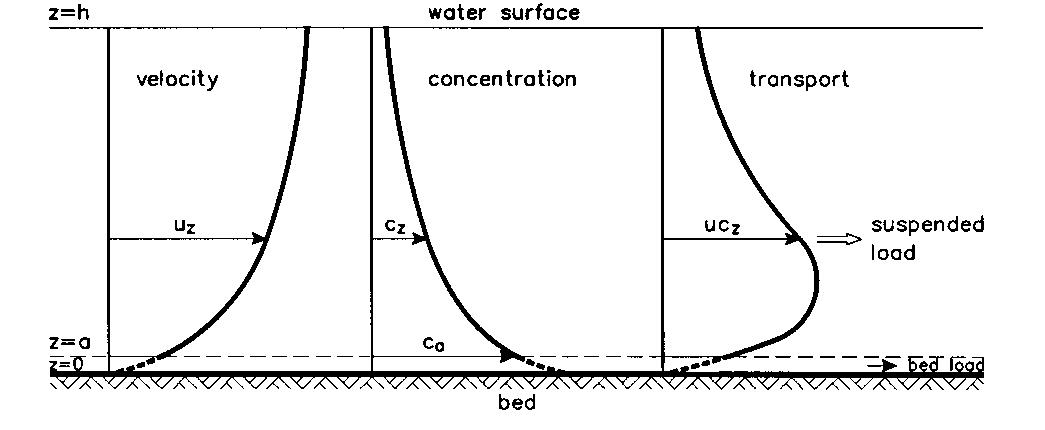
| 10:03, 11 October 2016 | VanRijnFig5.jpg (file) |  |
46 KB | Definition sketch of suspended sediment transport. | 1 |
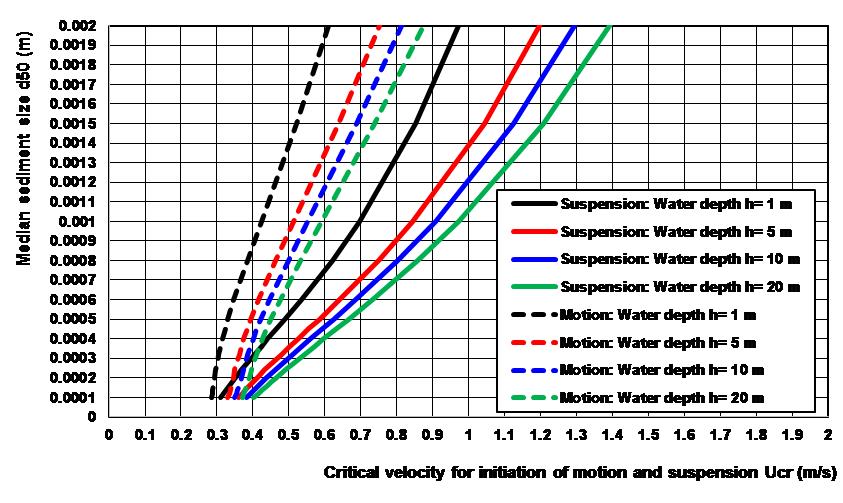
| 10:02, 11 October 2016 | VanRijnFig3.jpg (file) |  |
99 KB | Depth-averaged velocity at initiation of motion and suspension. | 1 |
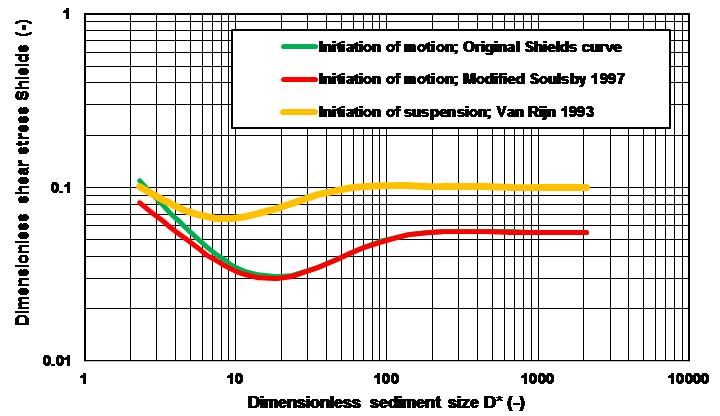
| 10:01, 11 October 2016 | VanRijnFig2.jpg (file) |  |
64 KB | Initiation of motion and suspension as function of dimensionless sediment size. | 1 |
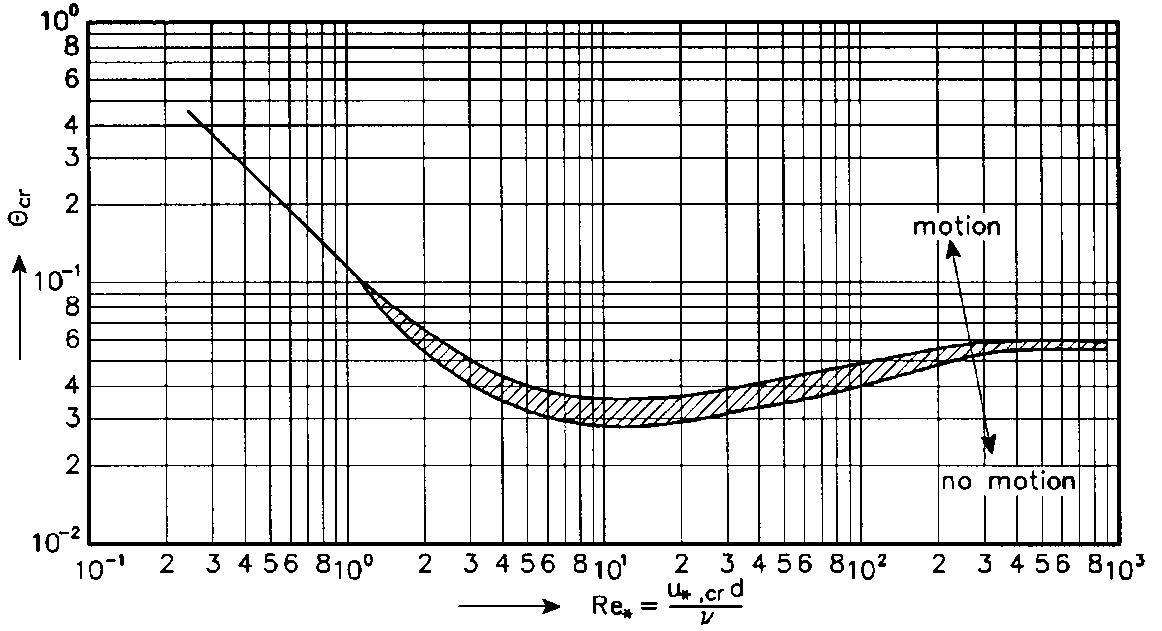
| 10:00, 11 October 2016 | VanRijnFig1.jpg (file) |  |
144 KB | Initiation of motion as function of Reynolds number. | 1 |
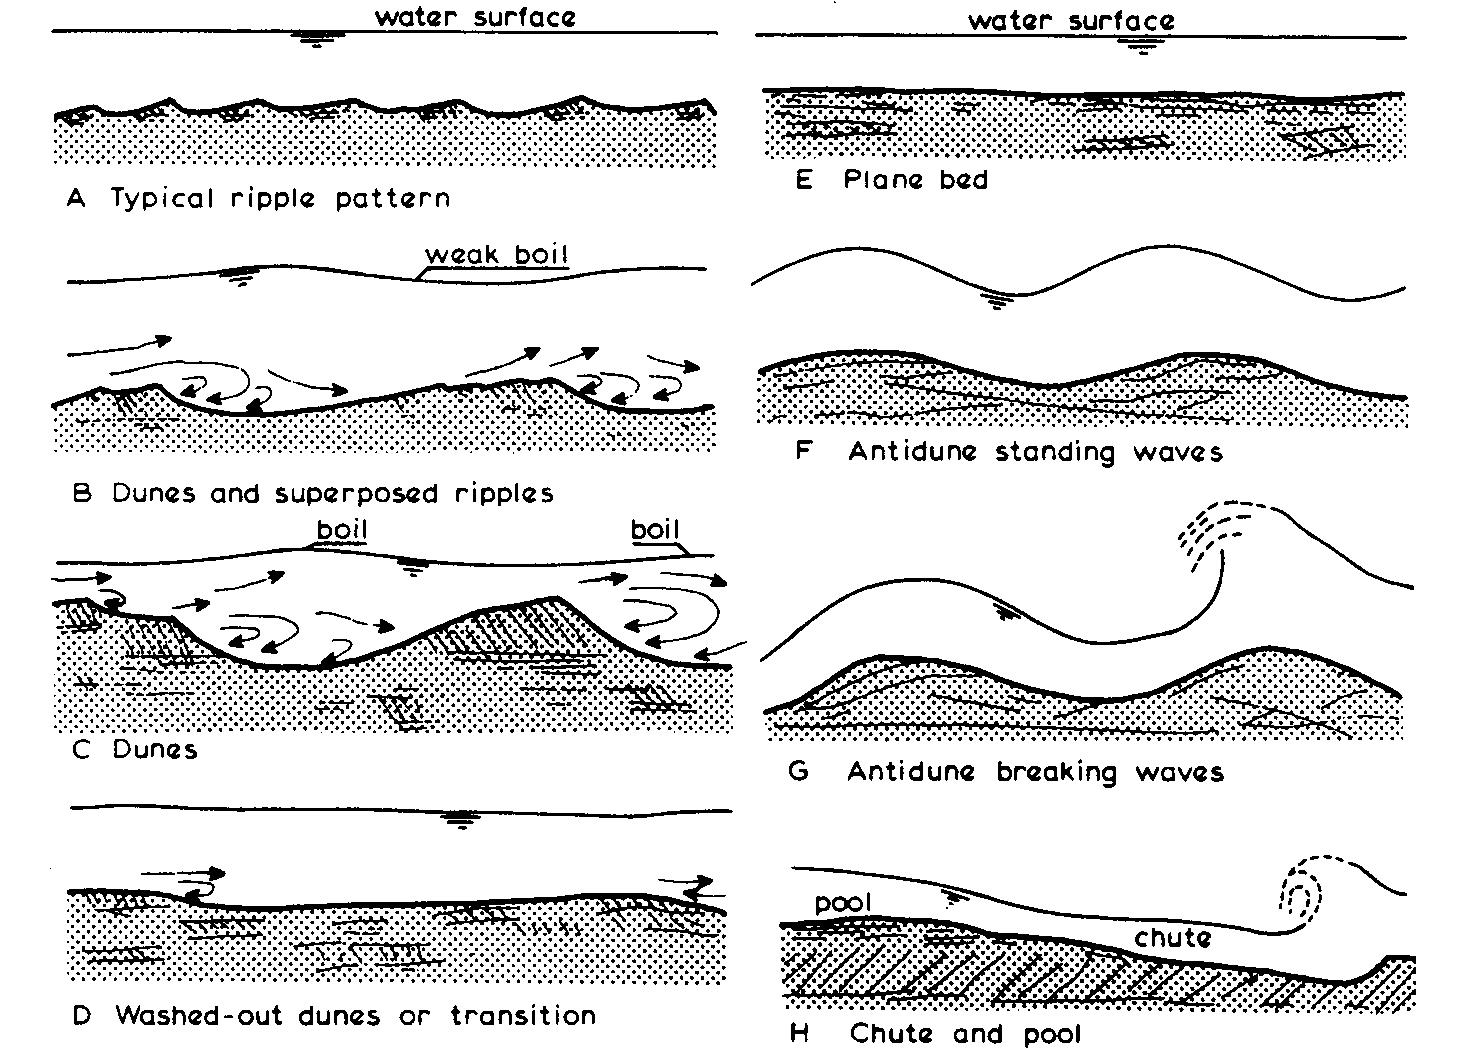
| 10:21, 10 October 2016 | VanRijnFig4.jpg (file) |  |
337 KB | Bed forms in steady flows (rivers). | 1 |
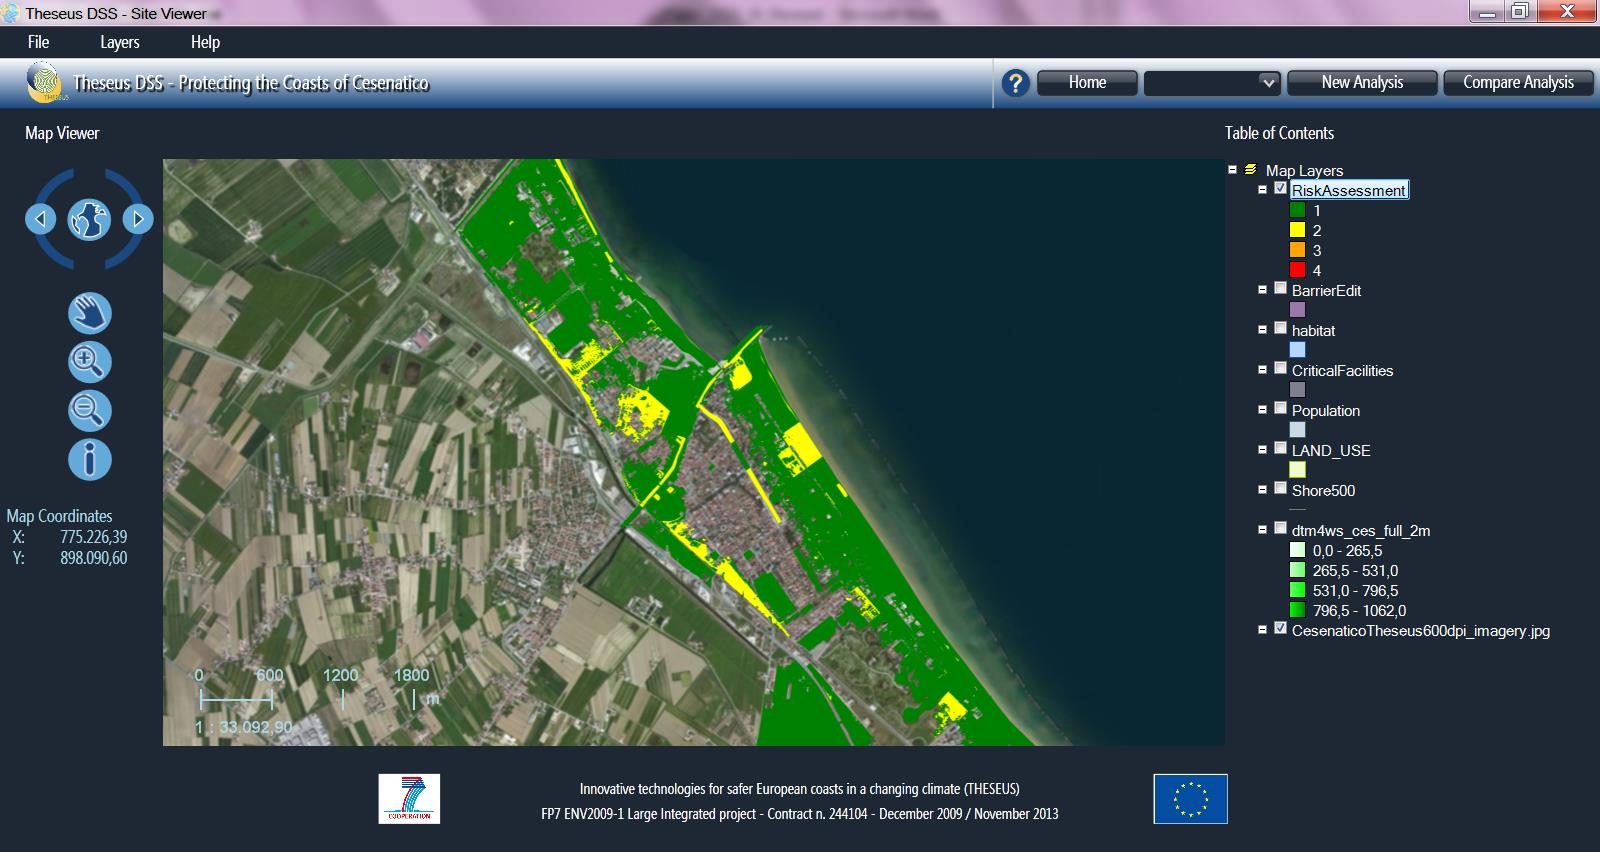
| 16:57, 26 September 2016 | BaZaFig7.jpg (file) |  |
151 KB | Example of integrated risk map, scale from 1 to 4 (from low to very high impact). | 1 |
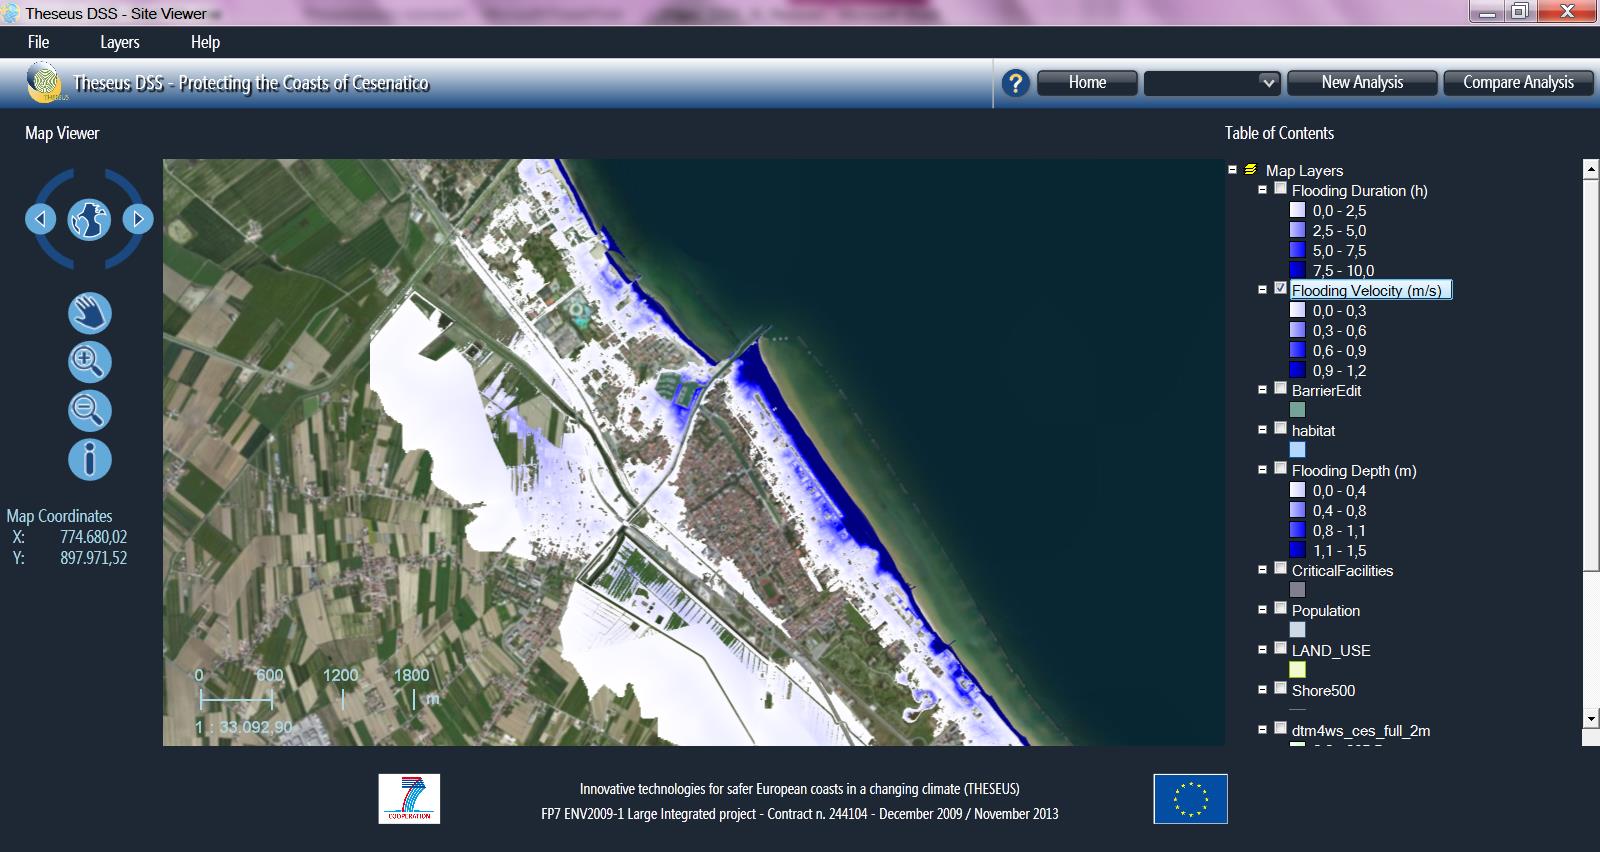
| 16:55, 26 September 2016 | BaZaFig6.jpg (file) |  |
163 KB | Example map of flooding velocities derived from the modified watershed segmentation algorithm. | 1 |
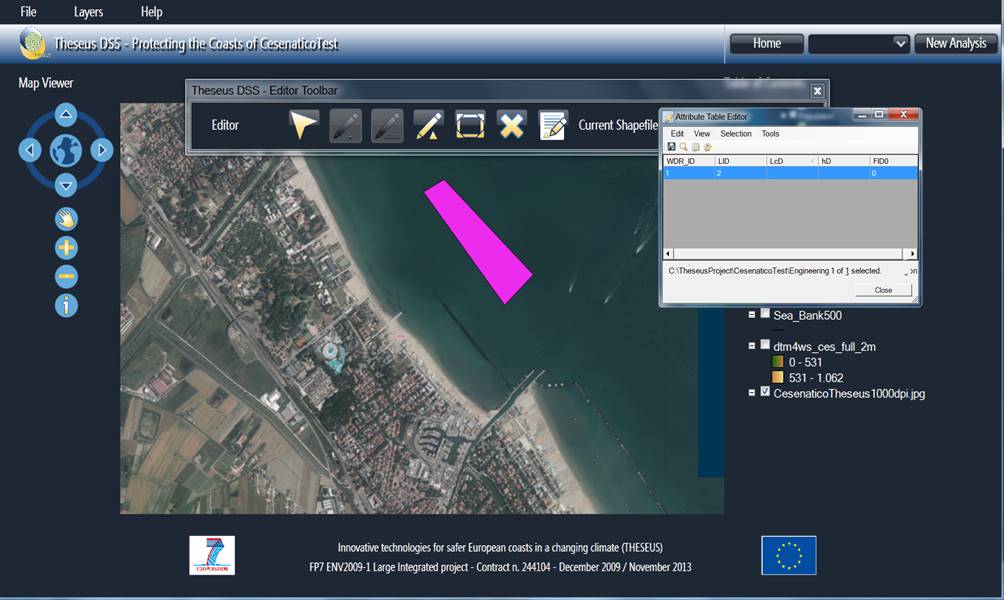
| 16:50, 26 September 2016 | BaZaFig5.jpg (file) |  |
74 KB | Editing a mitigation option in front of Cesenatico. | 1 |
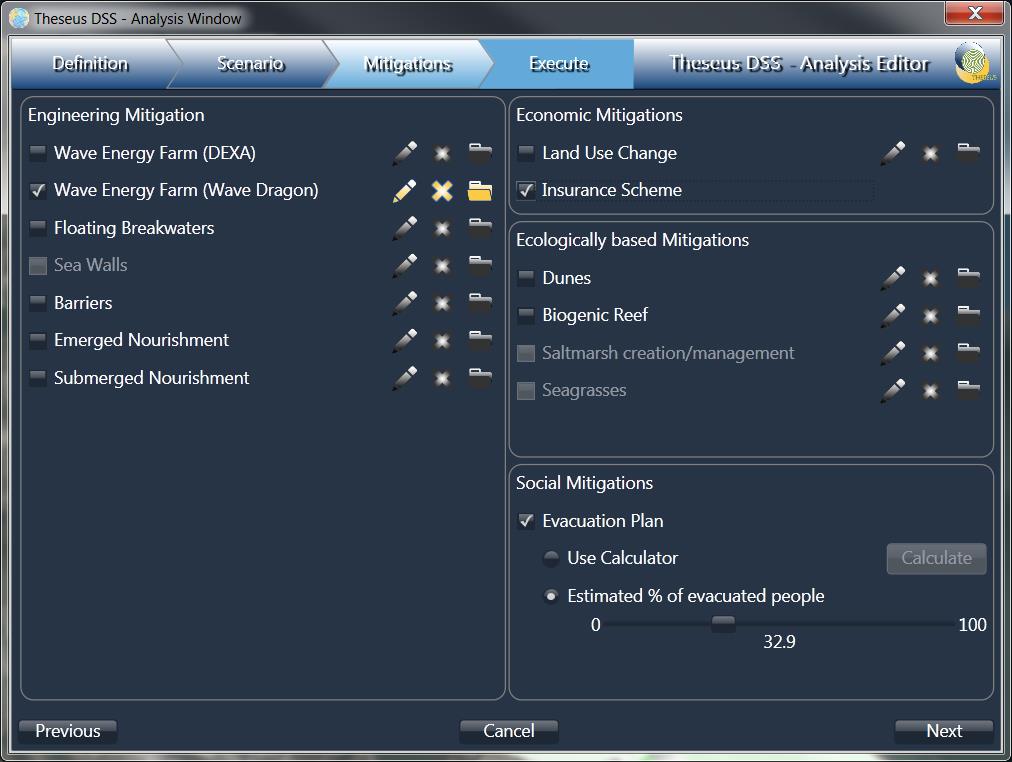
| 16:49, 26 September 2016 | BaZaFig4.jpg (file) |  |
85 KB | Mitigation screen. | 1 |
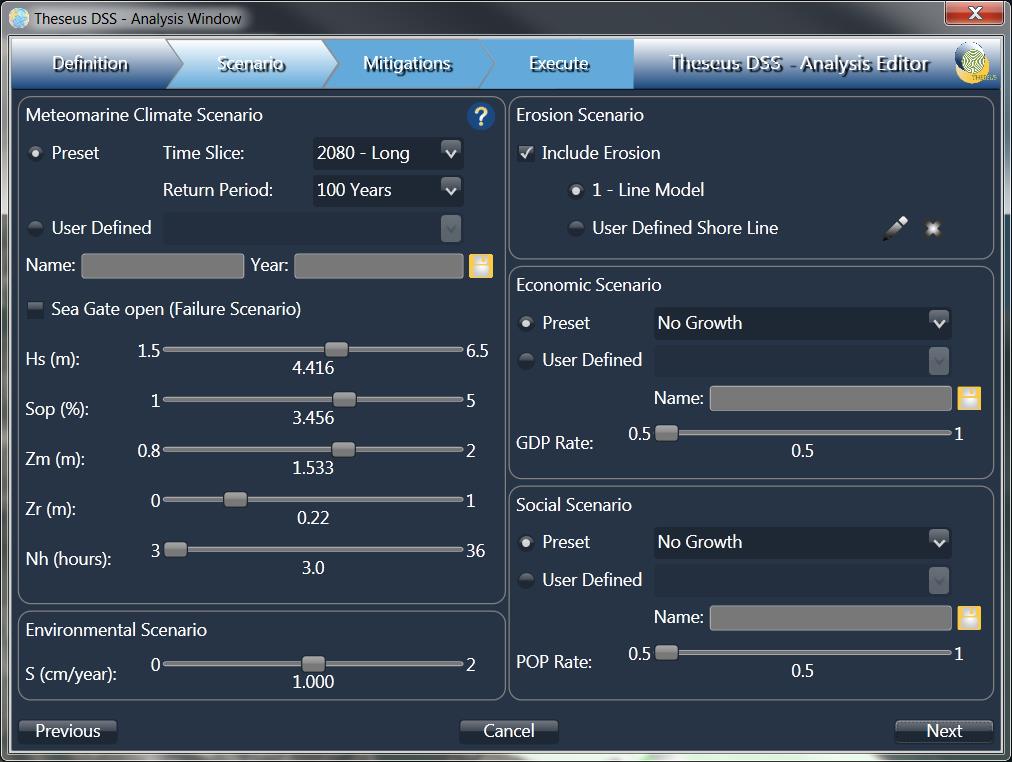
| 16:49, 26 September 2016 | BaZaFig3.jpg (file) |  |
100 KB | Scenarios screen. | 1 |
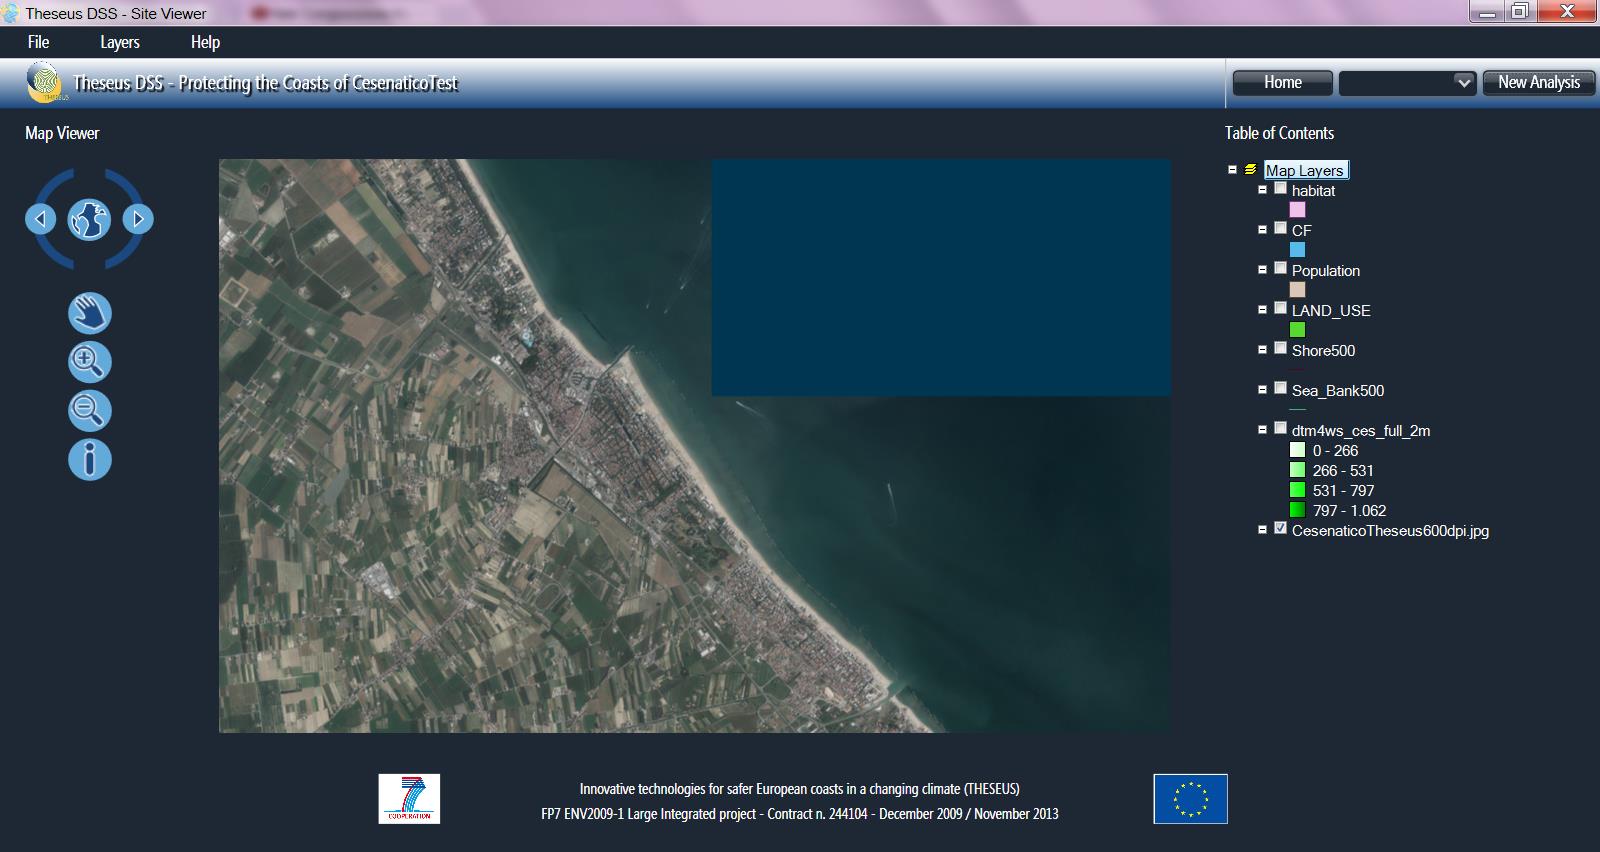
| 16:48, 26 September 2016 | BaZaFig2.jpg (file) |  |
121 KB | The viewer at the start-up. | 1 |
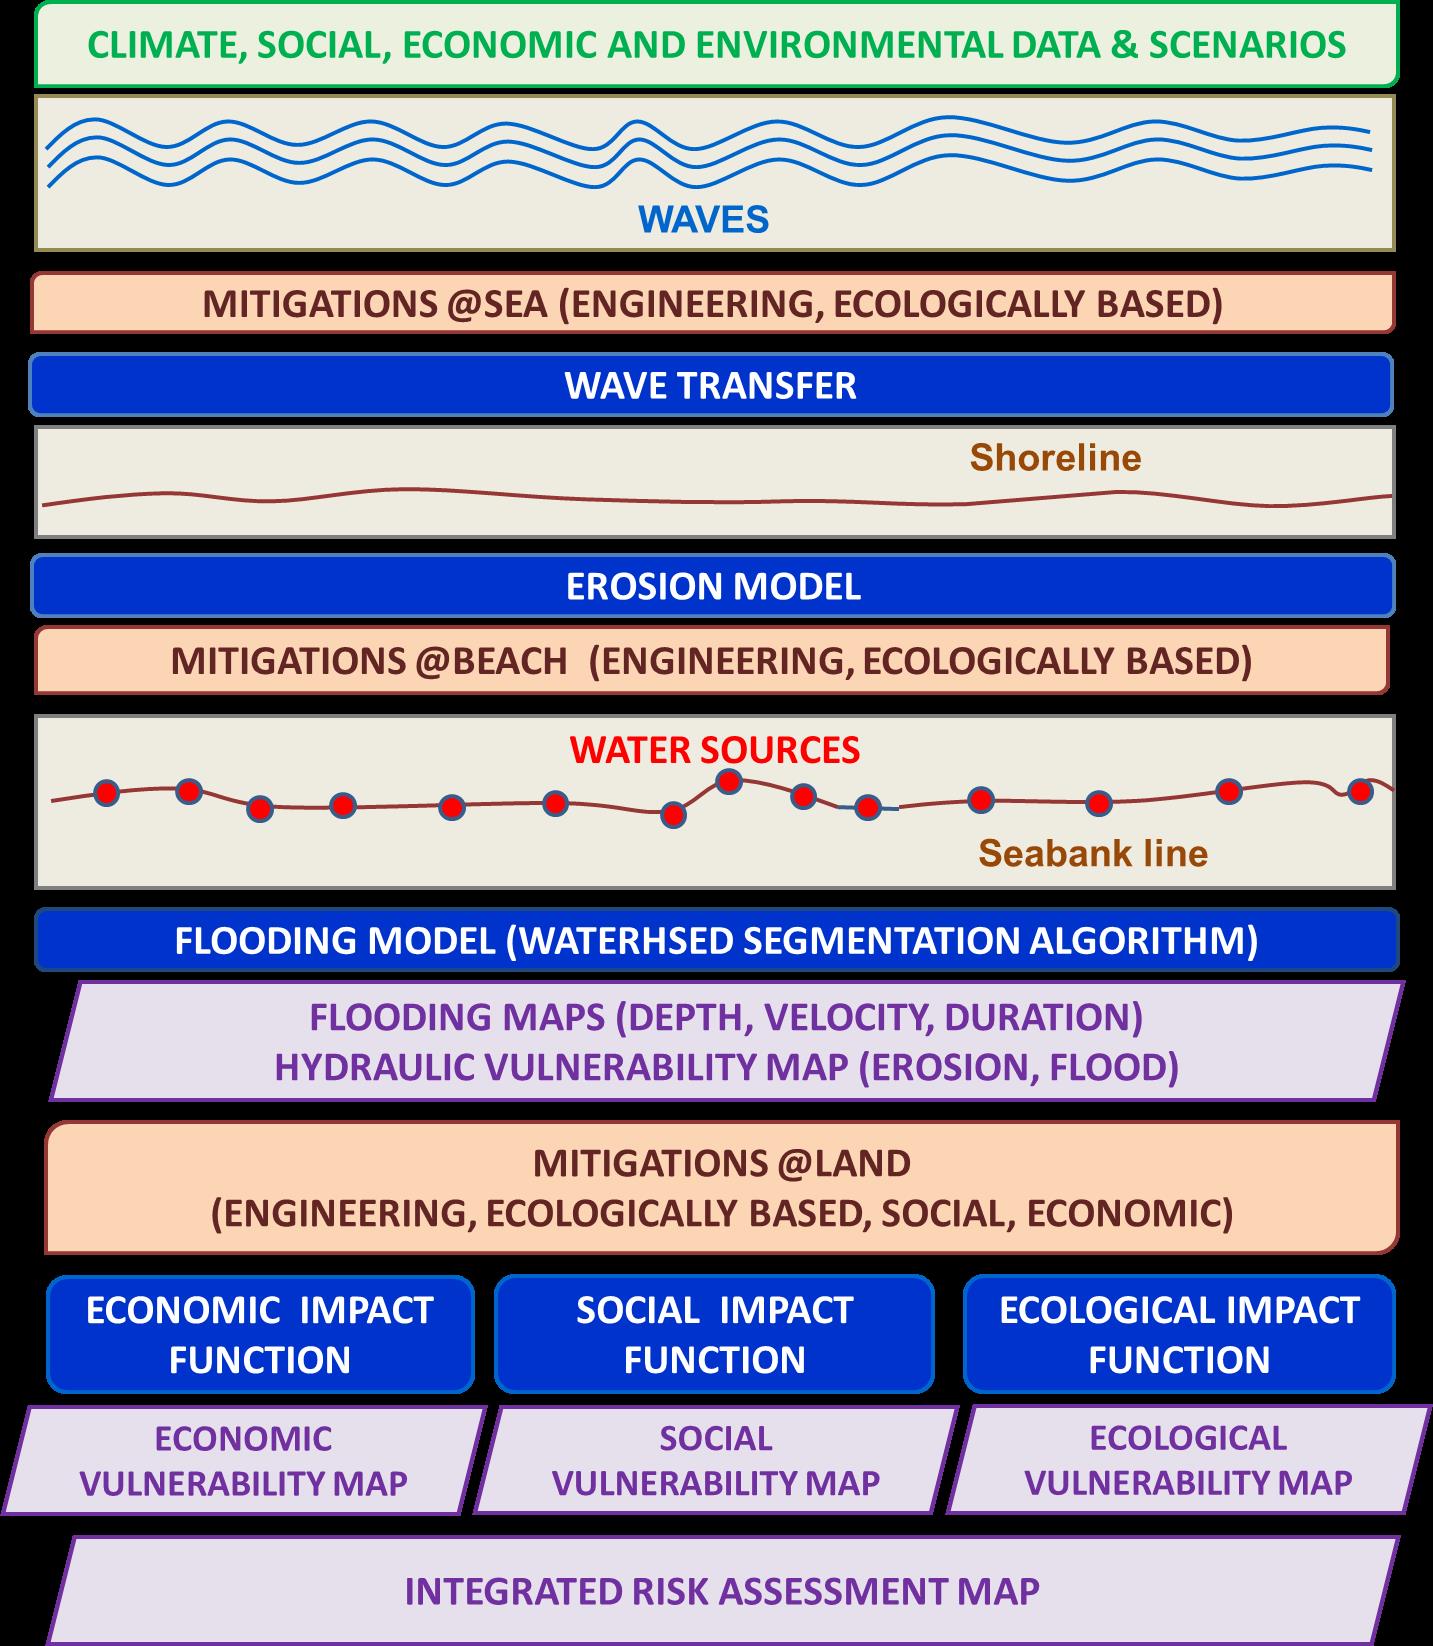
| 16:47, 26 September 2016 | BaZaFig1.jpg (file) |  |
334 KB | Key elements and the flow of information within THESEUS DSS. | 1 |
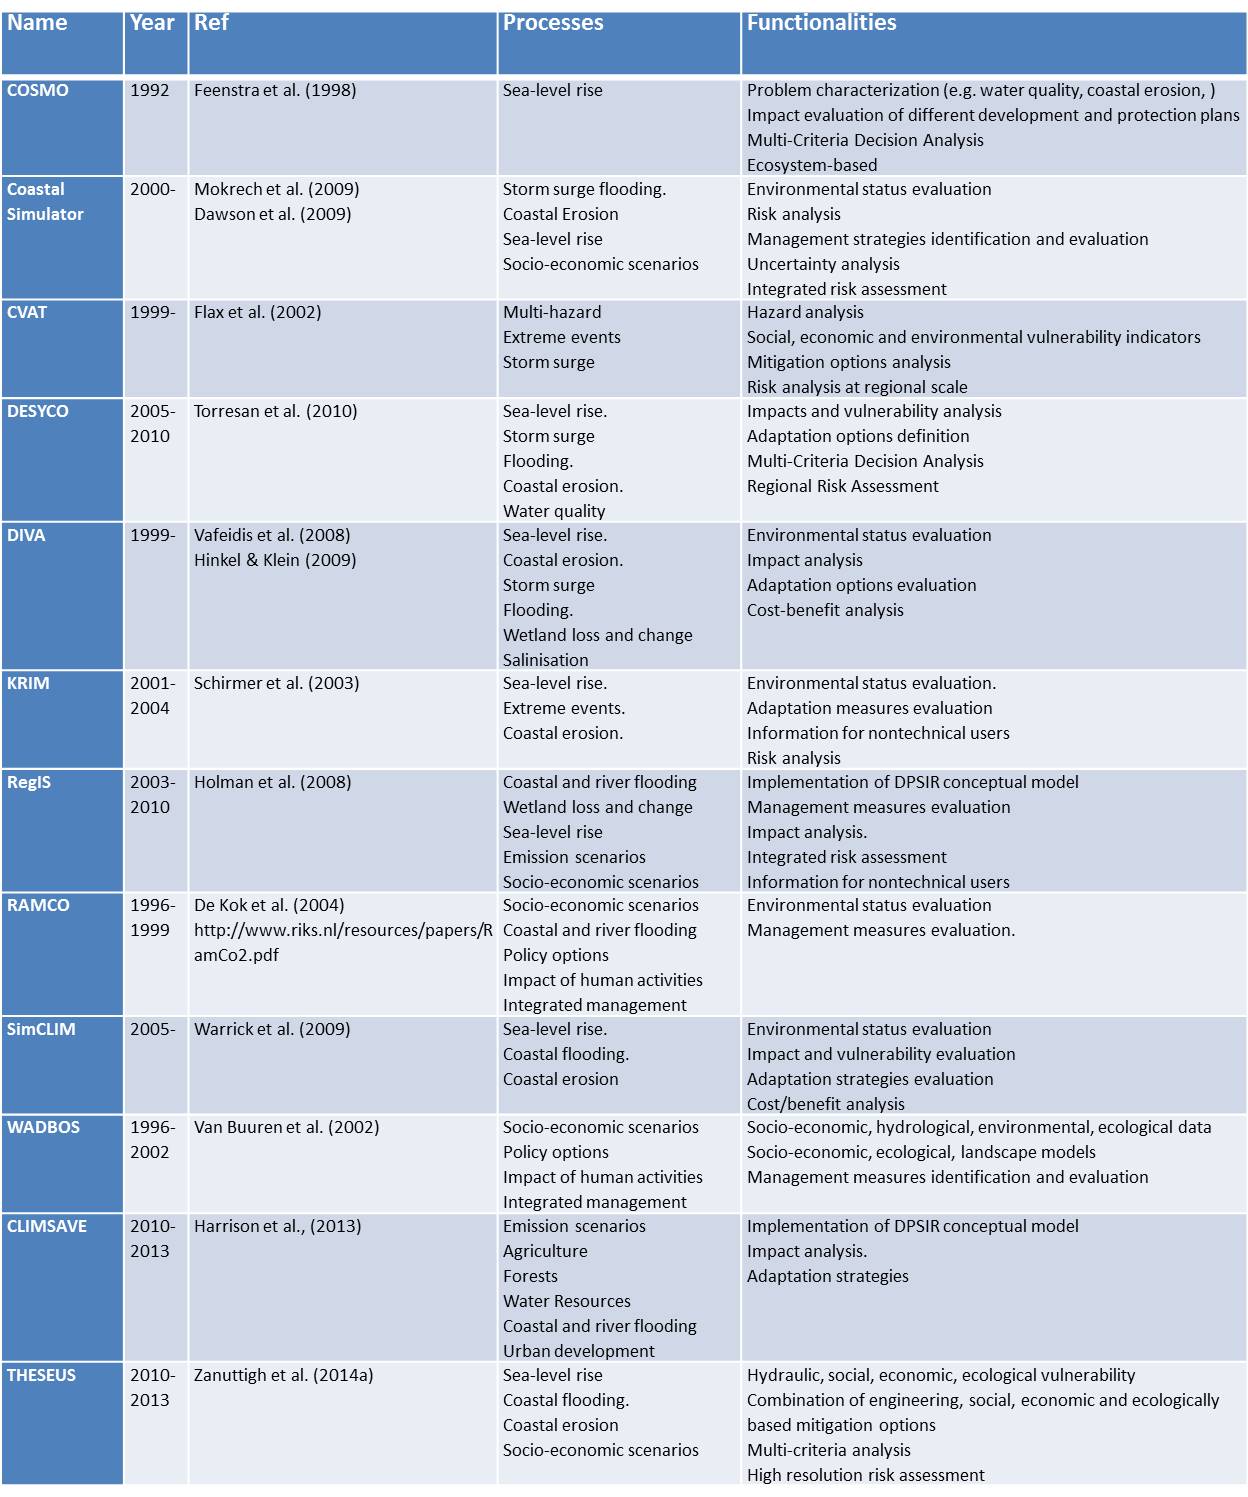
| 16:46, 26 September 2016 | BaZaTable1.jpg (file) |  |
241 KB | Review of existing exploratory tools that can be used for supporting decisions applied to coastal areas. These GIS-based tools perform scenario construction and analysis. | 1 |
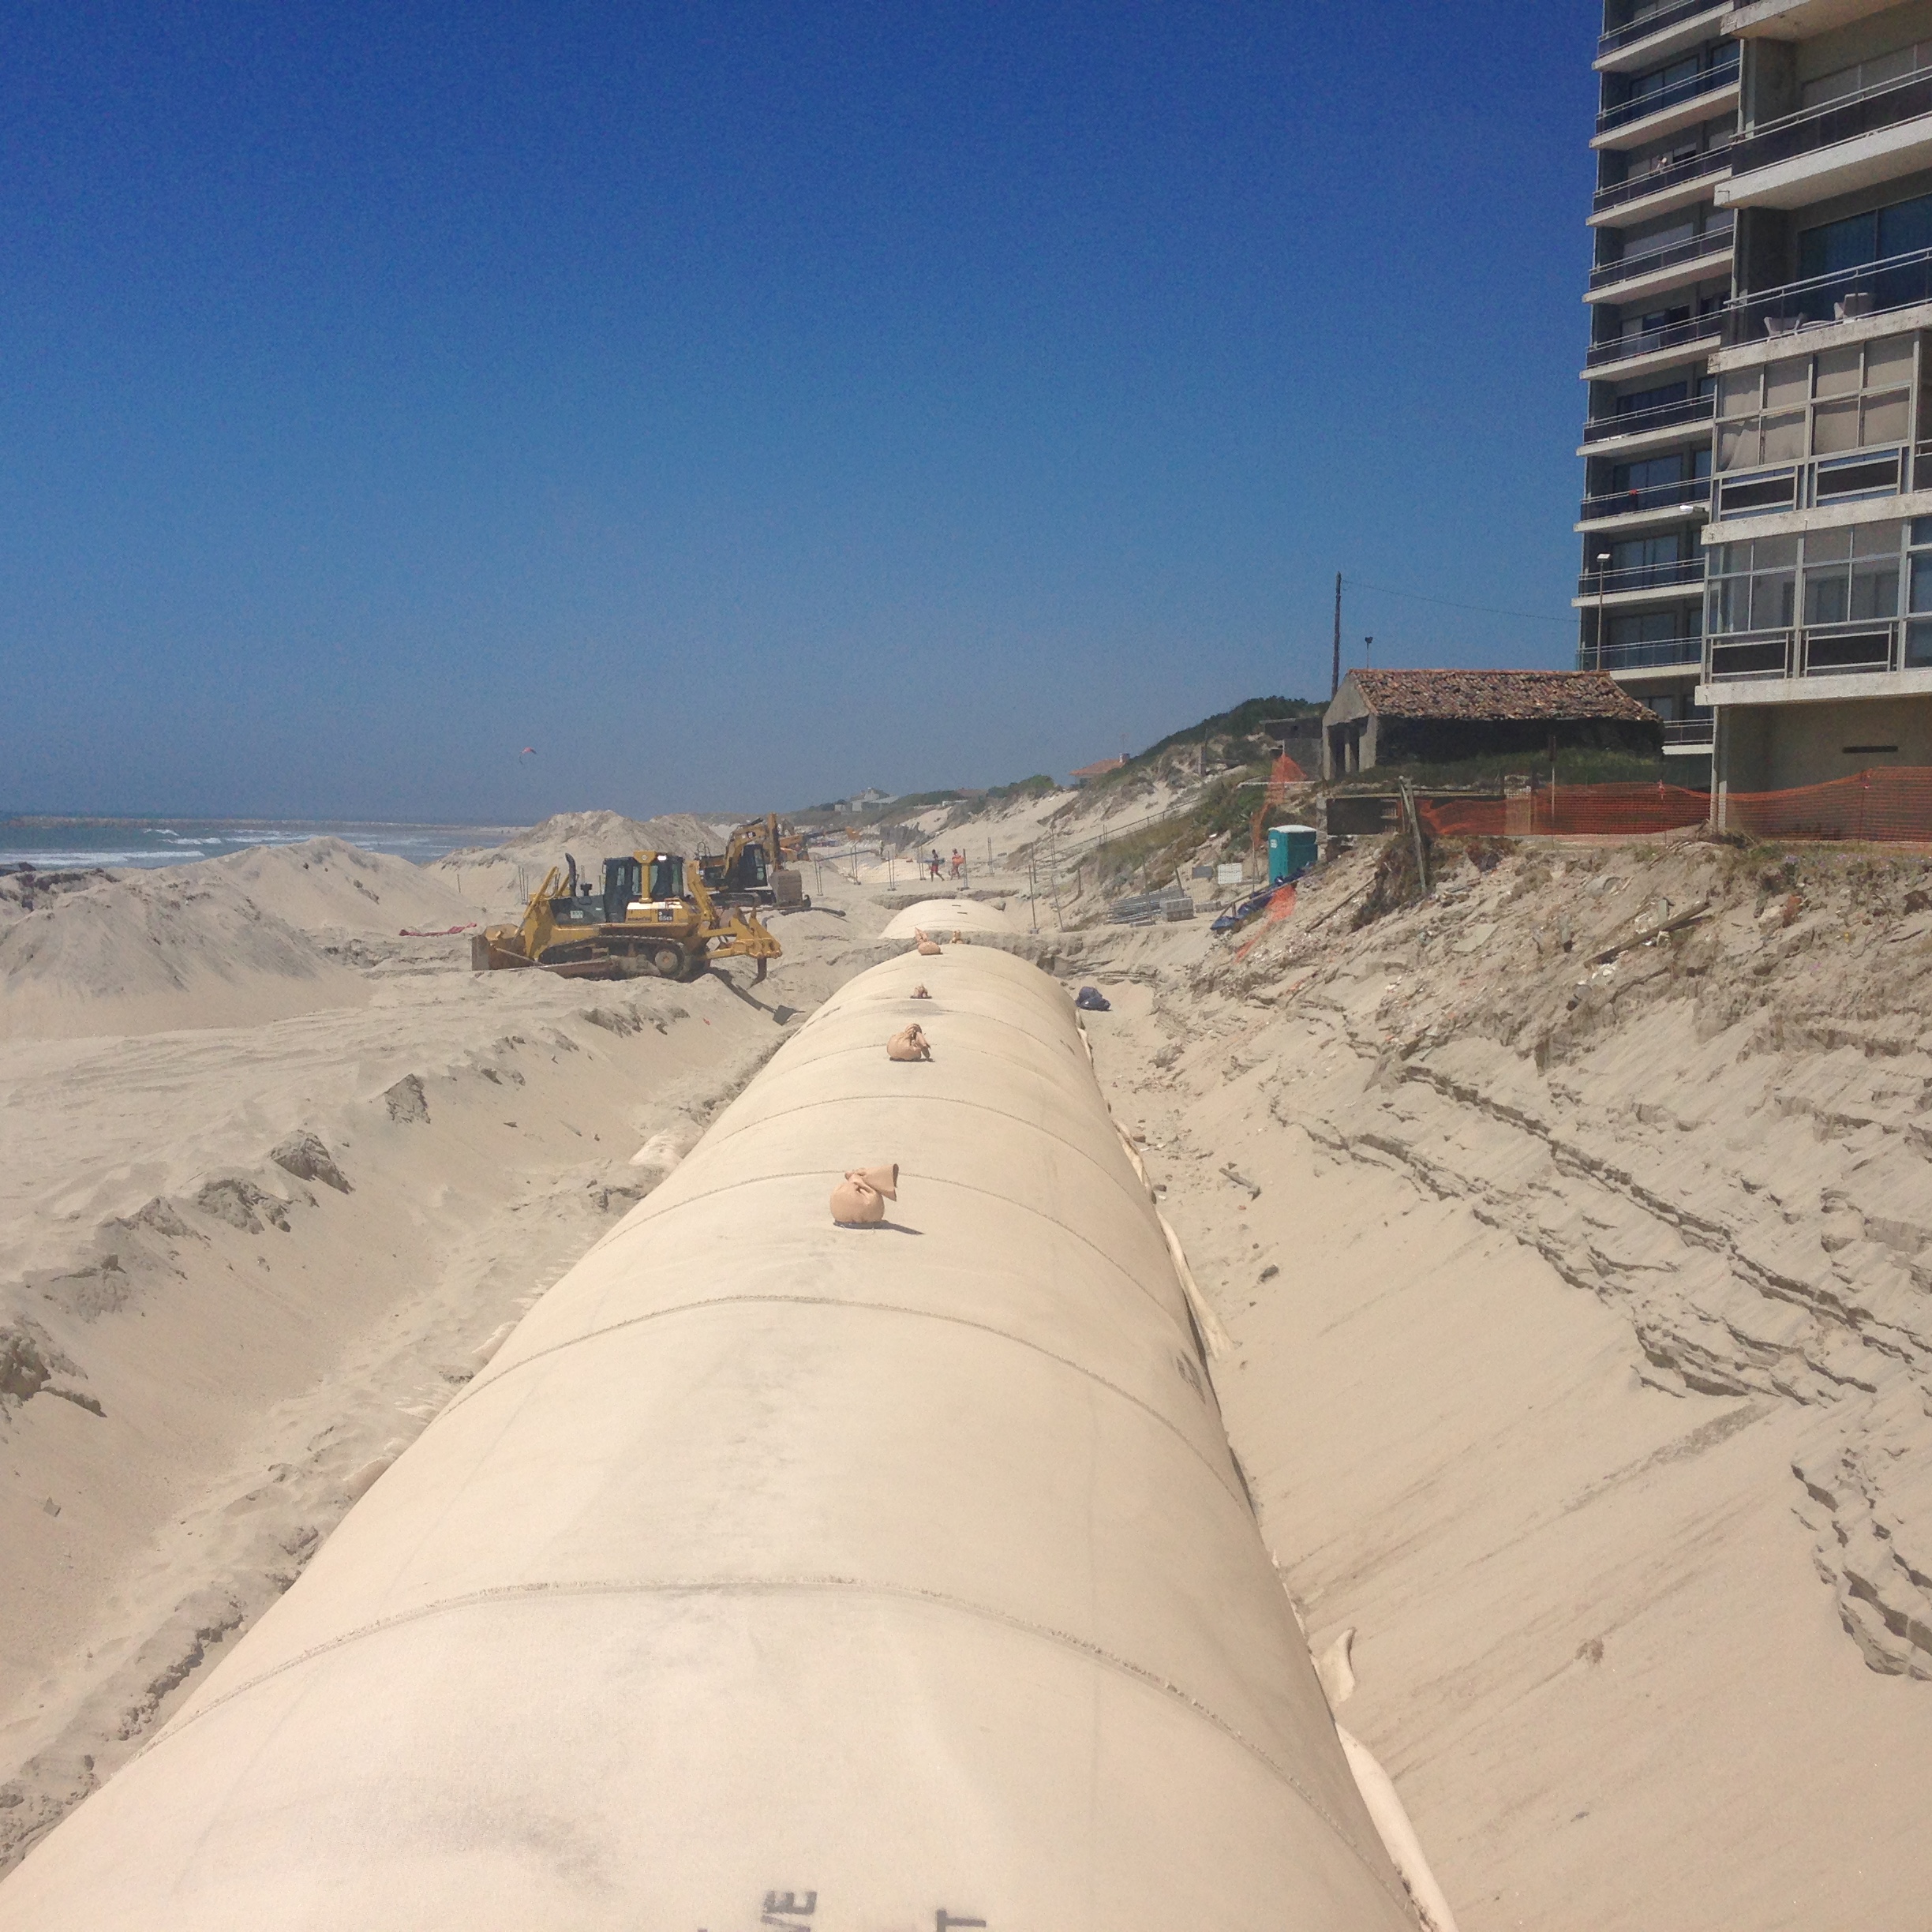
| 09:06, 19 September 2016 | LucianaFig.jpg (file) |  |
1.64 MB | Geotextile tube application at the beach of Ofir, Esposende, Portugal. | 1 |