File list
This special page shows all uploaded files.
| Date | Name | Thumbnail | Size | Description | Versions |
|---|---|---|---|---|---|
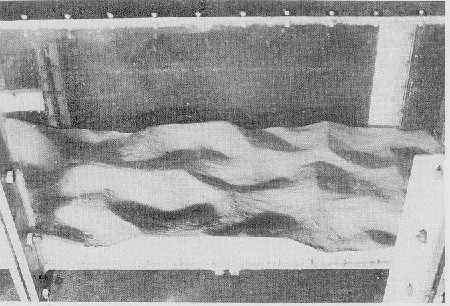
| 09:48, 3 July 2017 | WaveRippleFormationFig4a.jpg (file) |  |
48 KB | Rolling-grain ripples (courtesy of John F.A. Sleath). | 1 |
| 09:47, 3 July 2017 | WaveRippleFormationFig4.jpg (file) |  |
47 KB | Visualization of the sediments picked-up from the bed and carried into suspension by the vortices shed at the crests of large amplitudes ripples in an oscillatory flow (courtesy of Dr. Megale). | 1 |
| 09:46, 3 July 2017 | WaveRippleFormationFig3.jpg (file) |  |
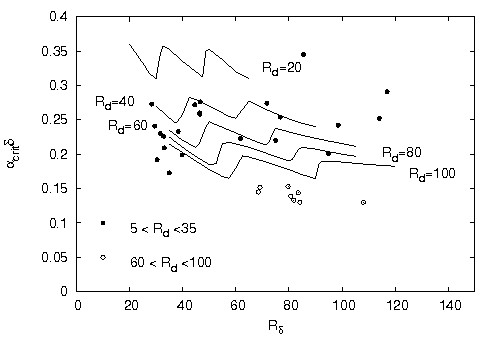
25 KB | Critical value <math>\alpha_{crit}</math> of <math>\alpha</math> plotted versus the flow Reynolds number <math>R_\delta</math> for <math>s=2.65, \mu=0.15, n=0.4</math> and different values of <math>R_d=R_p\sqrt{\psi_d}</math>. | 1 |
| 09:44, 3 July 2017 | WaveRippleFormationFig2.jpg (file) |  |
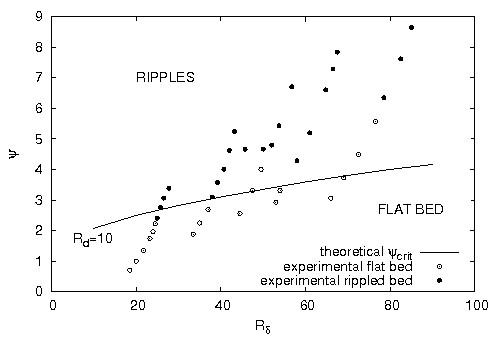
21 KB | Region of existence of ripples and flat beds (adapted from Blondeaux 1990). | 1 |
| 09:43, 3 July 2017 | WaveRippleFormationFig1.jpg (file) |  |
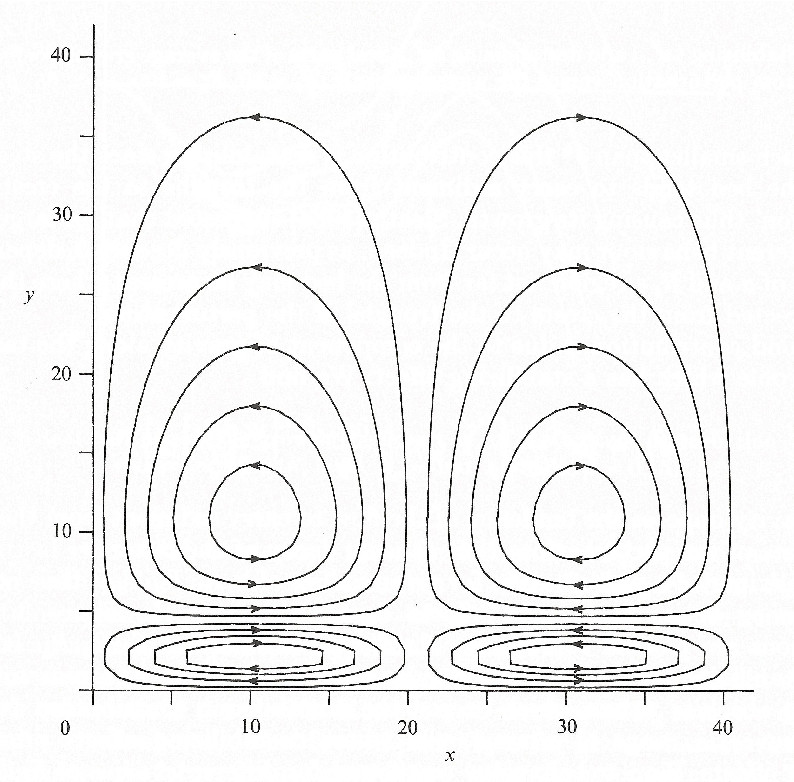
125 KB | Steady streaming generated by an oscillatory flow over a wavy wall (adapted from Blondeaux 1990). | 1 |
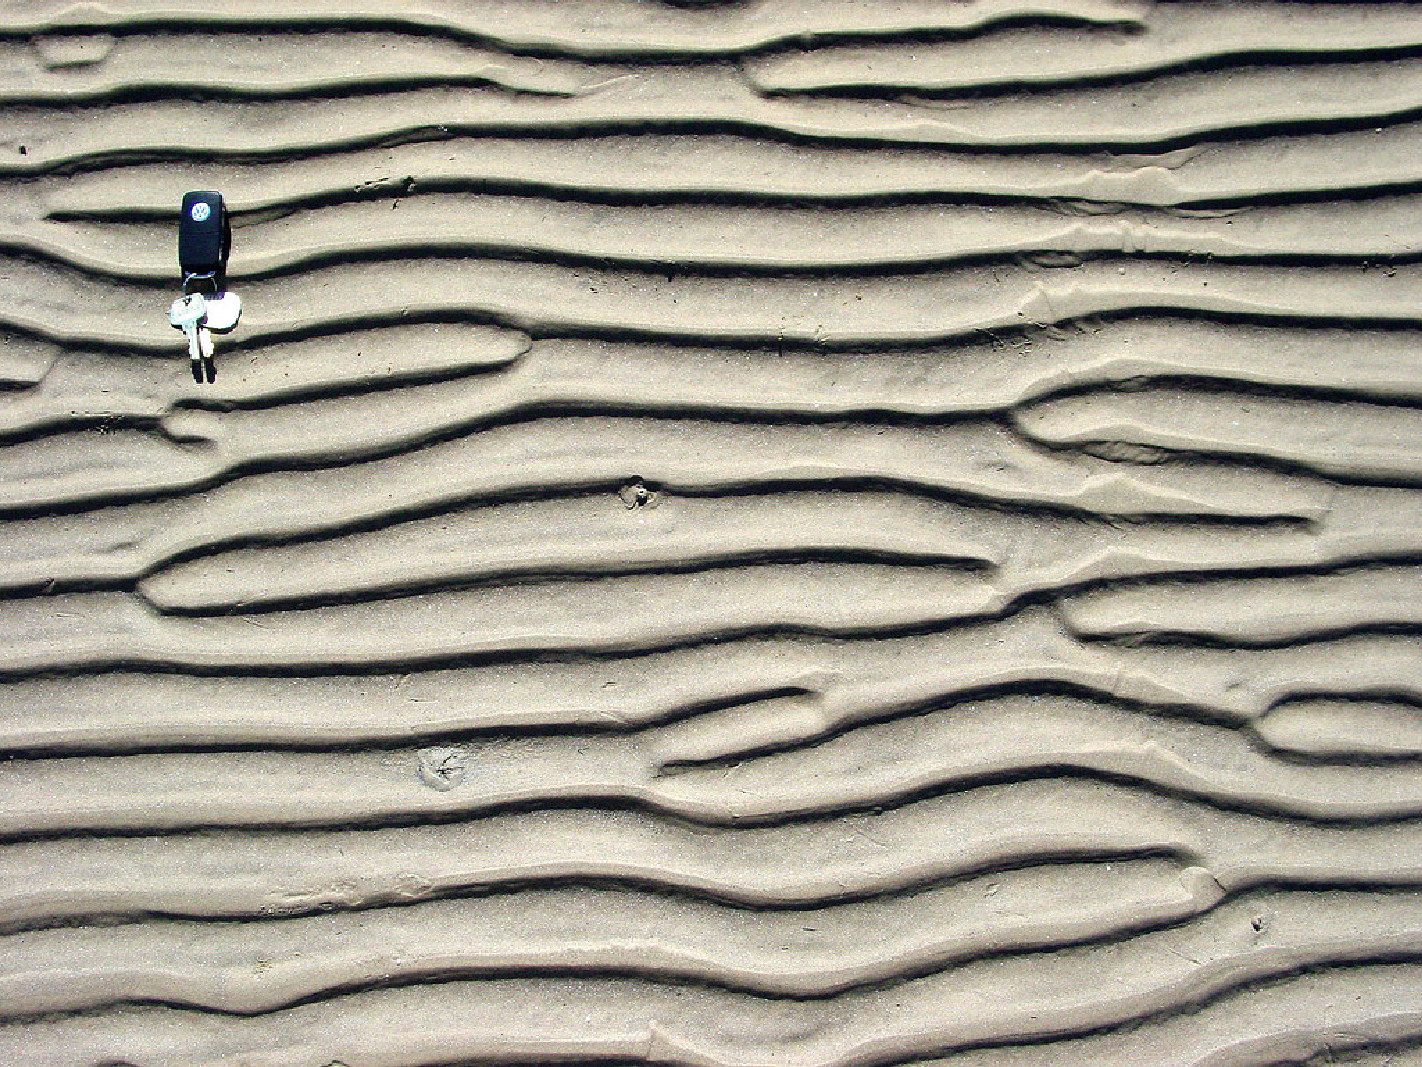
| 09:40, 3 July 2017 | WaveRippleFormationFig0.jpg (file) |  |
678 KB | Ripples observed at Sea Rim State Park, along the coast of east Texas close to the border with Louisiana (courtesy by Zoltan Sylvester). | 1 |
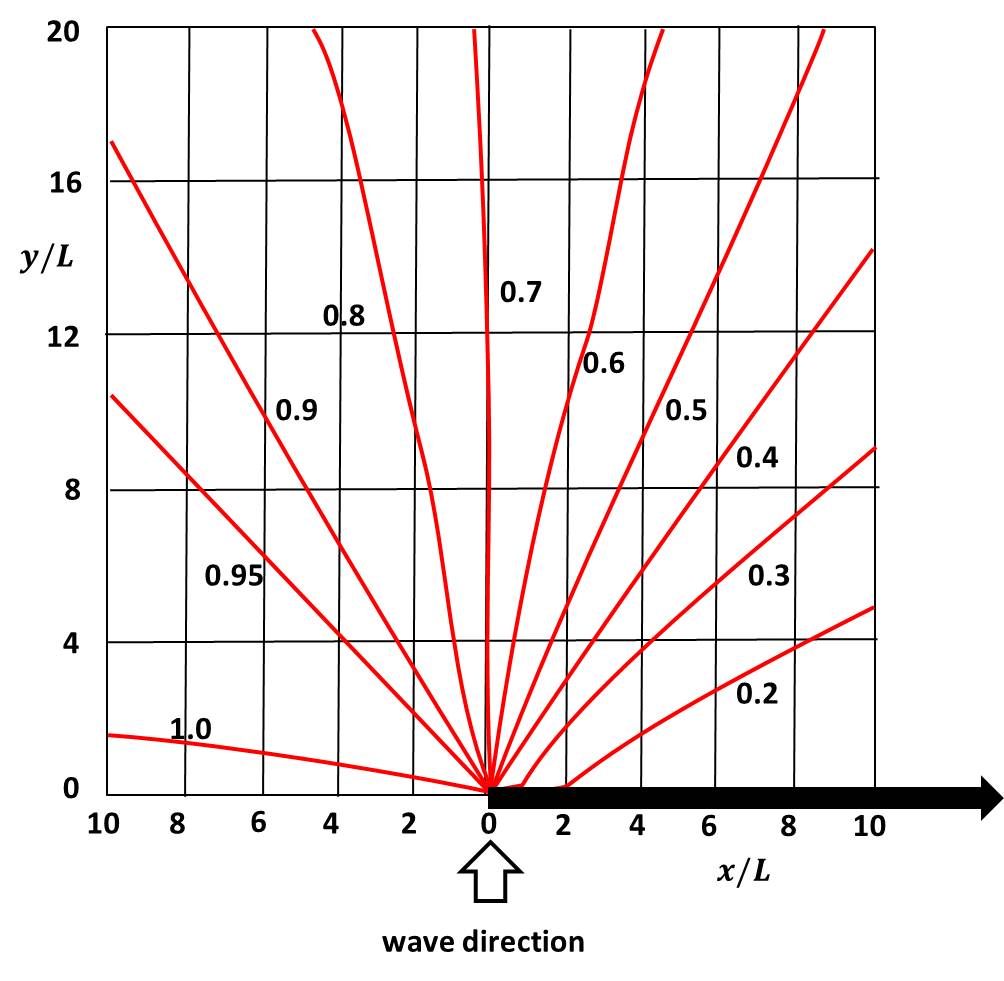
| 20:44, 30 June 2017 | ChadwickFig15f.jpg (file) |  |
111 KB | Diffraction (ratio of diffracted wave height and incident wave height) of a normally incident directional random sea state for a breakwater gap width of b=L. | 1 |
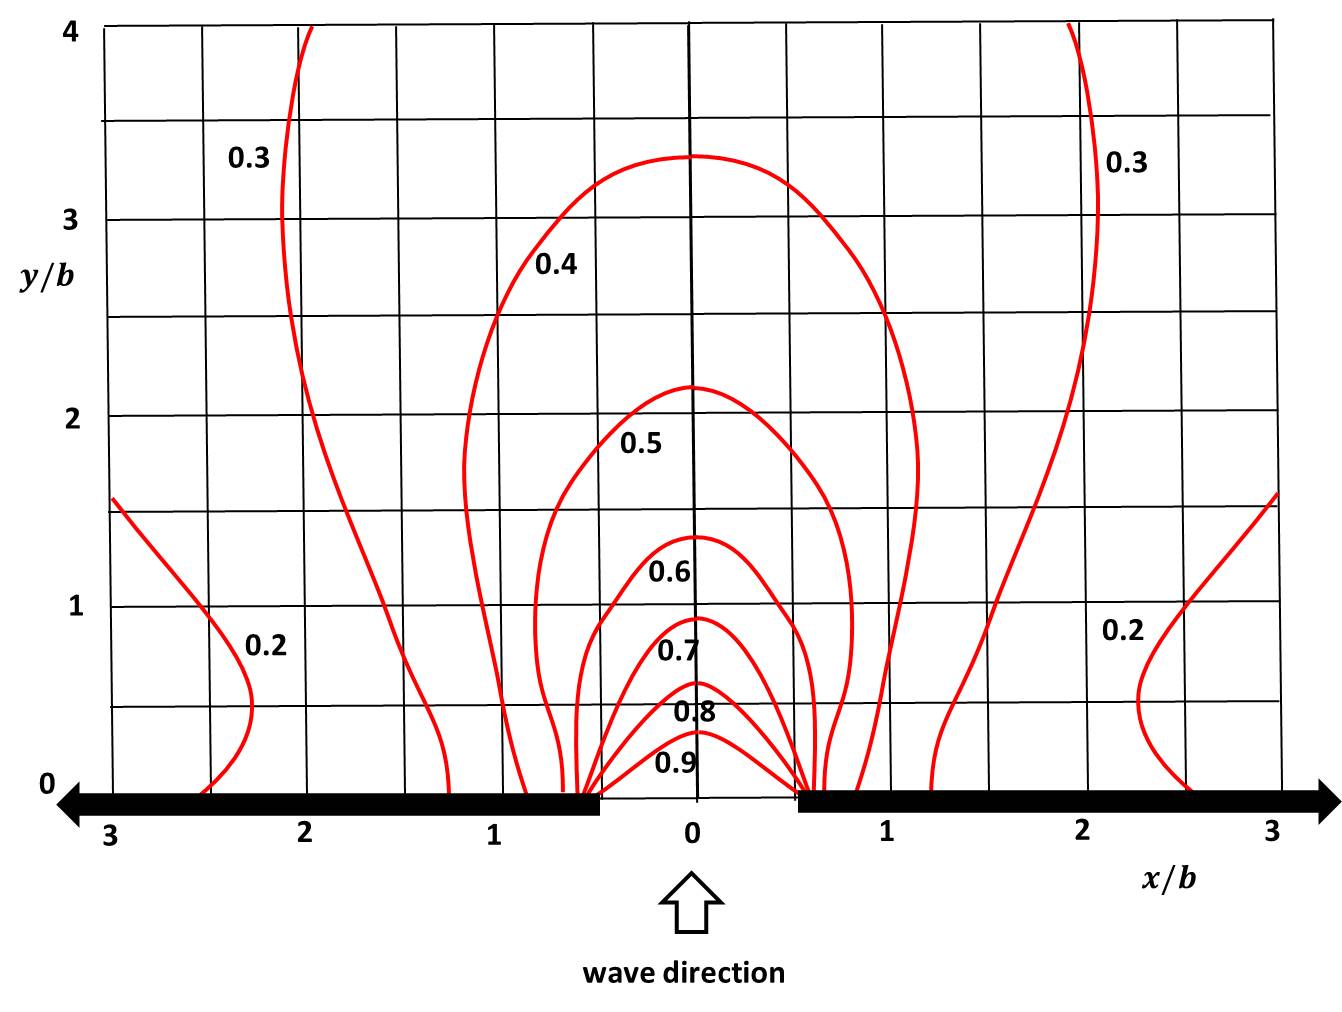
| 20:42, 30 June 2017 | ChadwickFig15e.jpg (file) |  |
89 KB | Diffraction (ratio of diffracted wave height and incident wave height) of a normally incident directional random sea state for a semi-infinite barrier. | 1 |
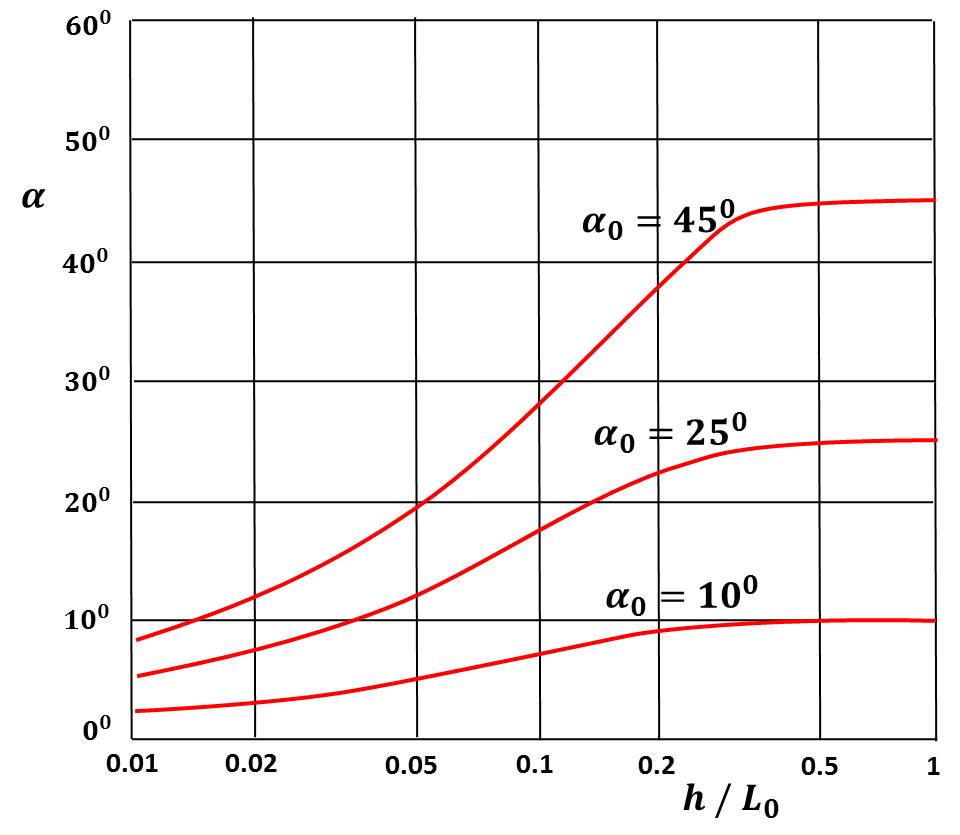
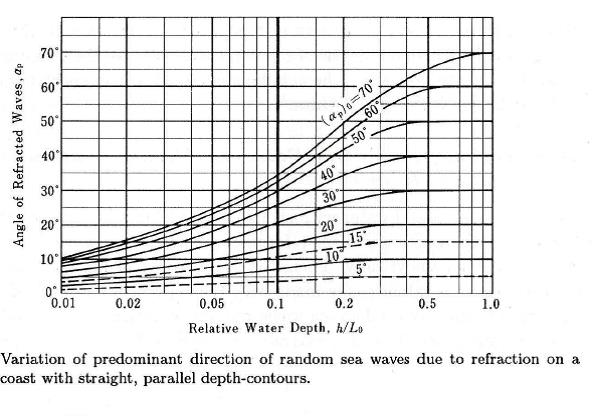
| 20:41, 30 June 2017 | ChadwickFig10NEW.jpg (file) |  |
58 KB | Some of Goda’s results for the predominant wave direction at a range of relative depths for a typical wind wave state and different predominant wave incident angles at deep water. | 1 |
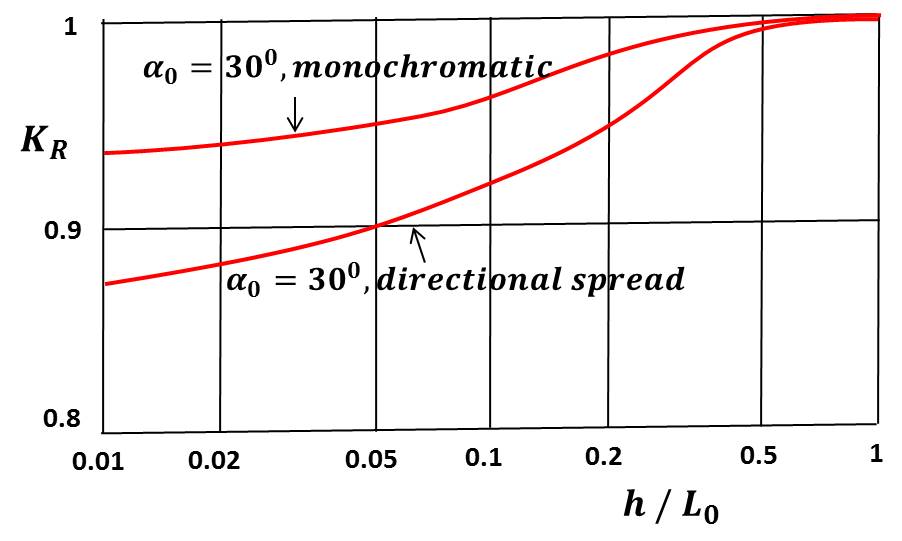
| 20:39, 30 June 2017 | ChadwickFig9b.jpg (file) |  |
42 KB | Comparison of results for the diffraction coefficient between a monochromatic wave and Goda’s result for a directional spectrum of a typical wind wave state. | 1 |
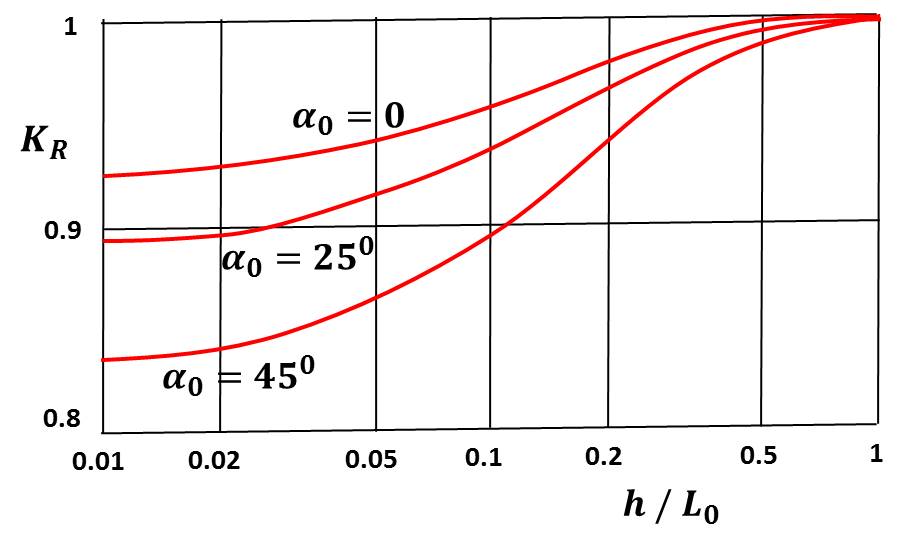
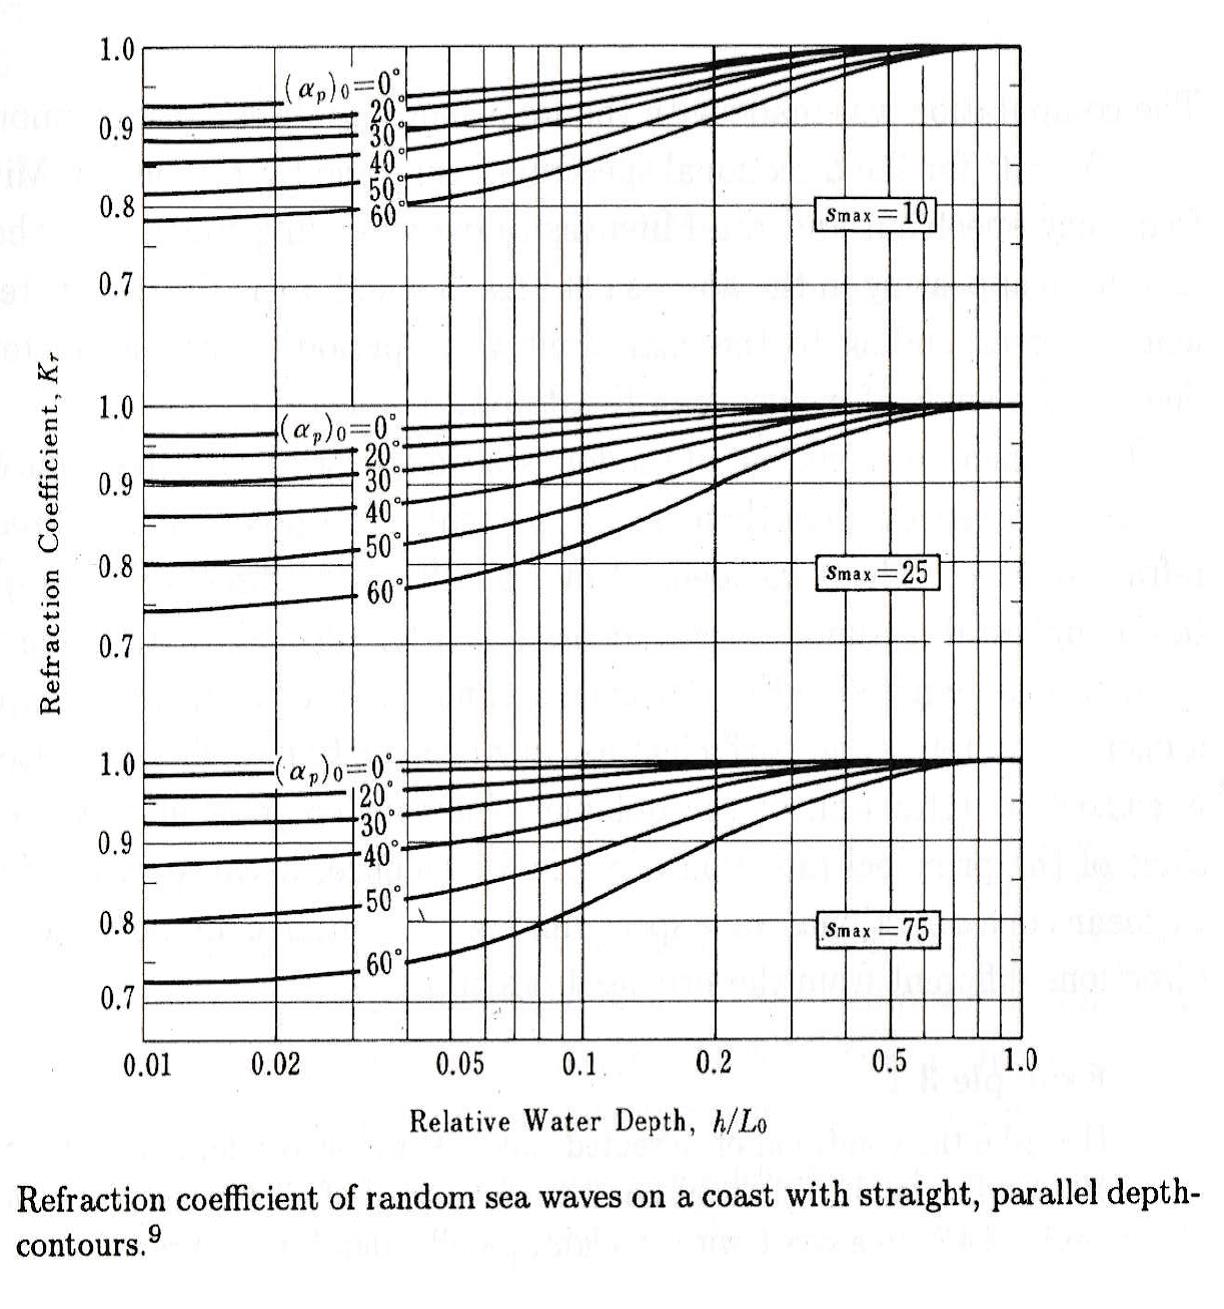
| 20:37, 30 June 2017 | ChadwickFig9a.jpg (file) |  |
41 KB | Some of Goda’s results for the diffraction coefficient as a function of relative depth for a typical wind wave state and different predominant wave incident angles at deep water. | 1 |
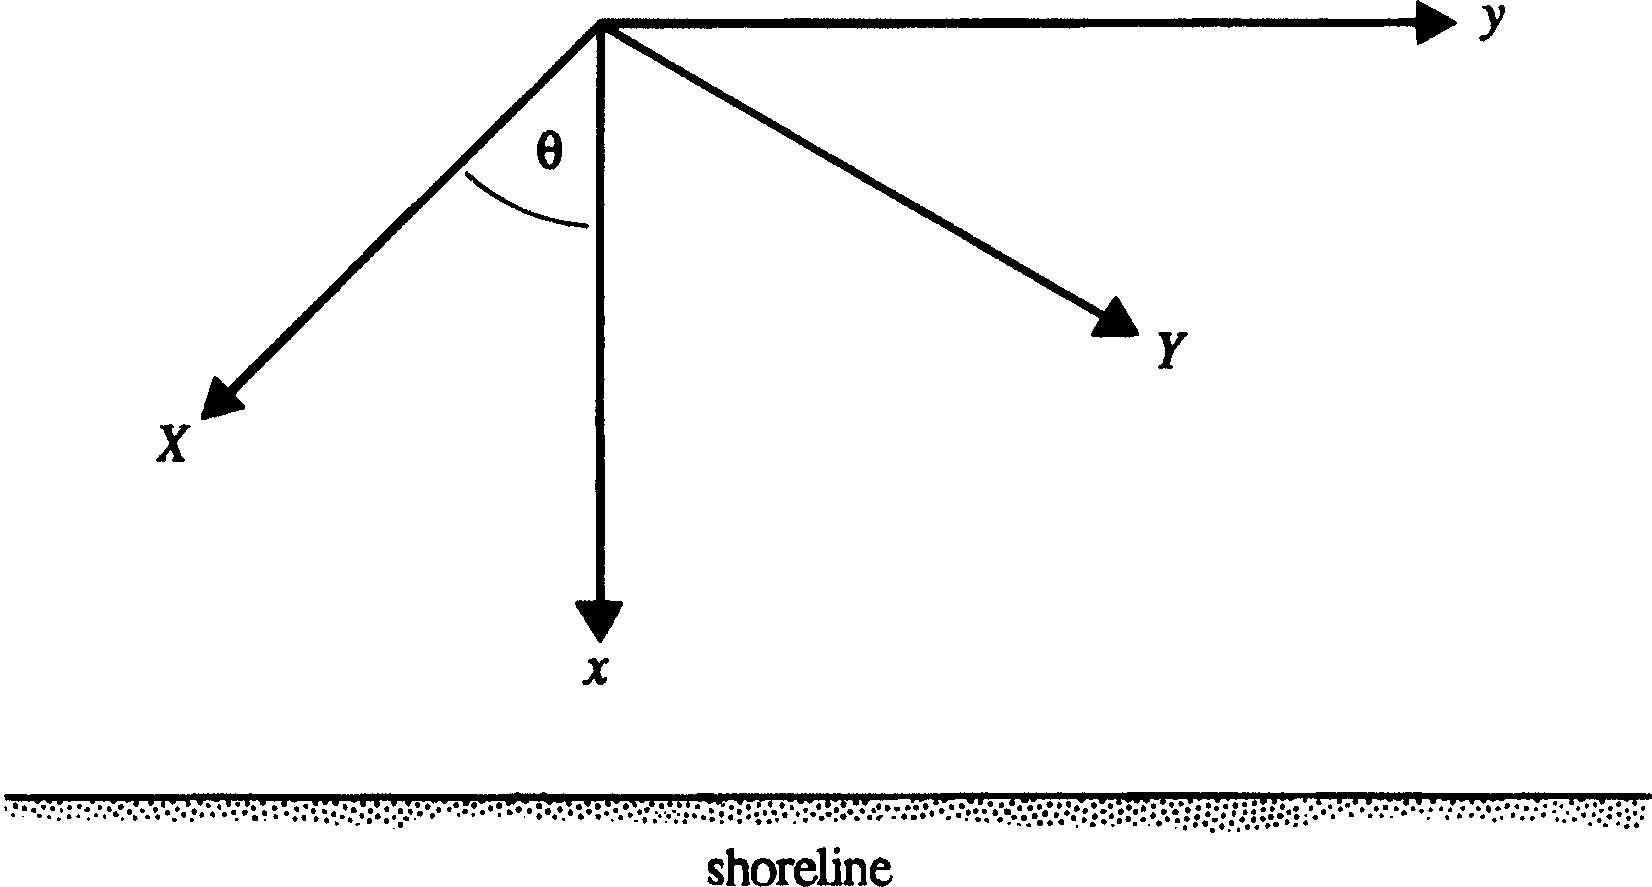
| 14:34, 6 June 2017 | ChadwickFig20NEW.jpg (file) |  |
19 KB | Relationships between principal axes and shoreline axes. | 1 |
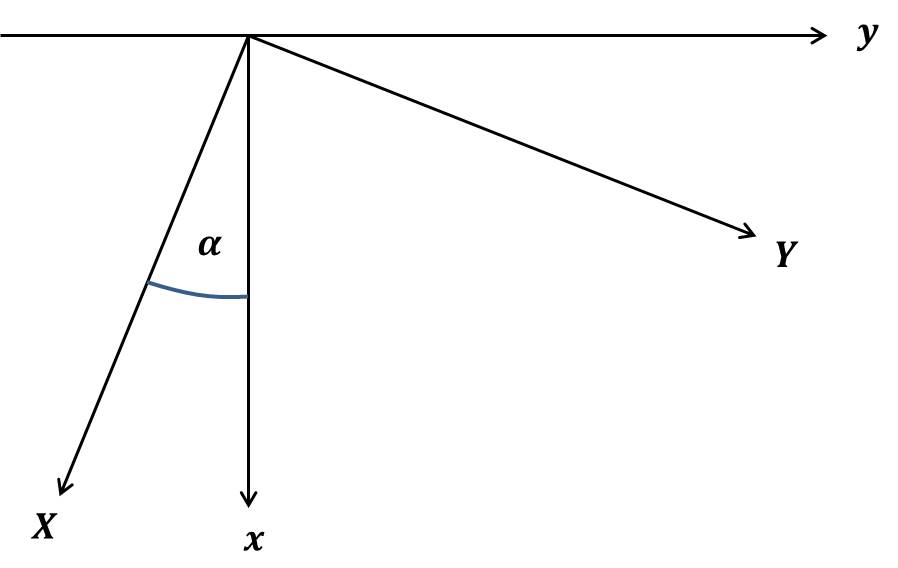
| 09:11, 6 June 2017 | ChadwickFig20.jpg (file) |  |
78 KB | Relationships between principal axes and shoreline axes. | 1 |
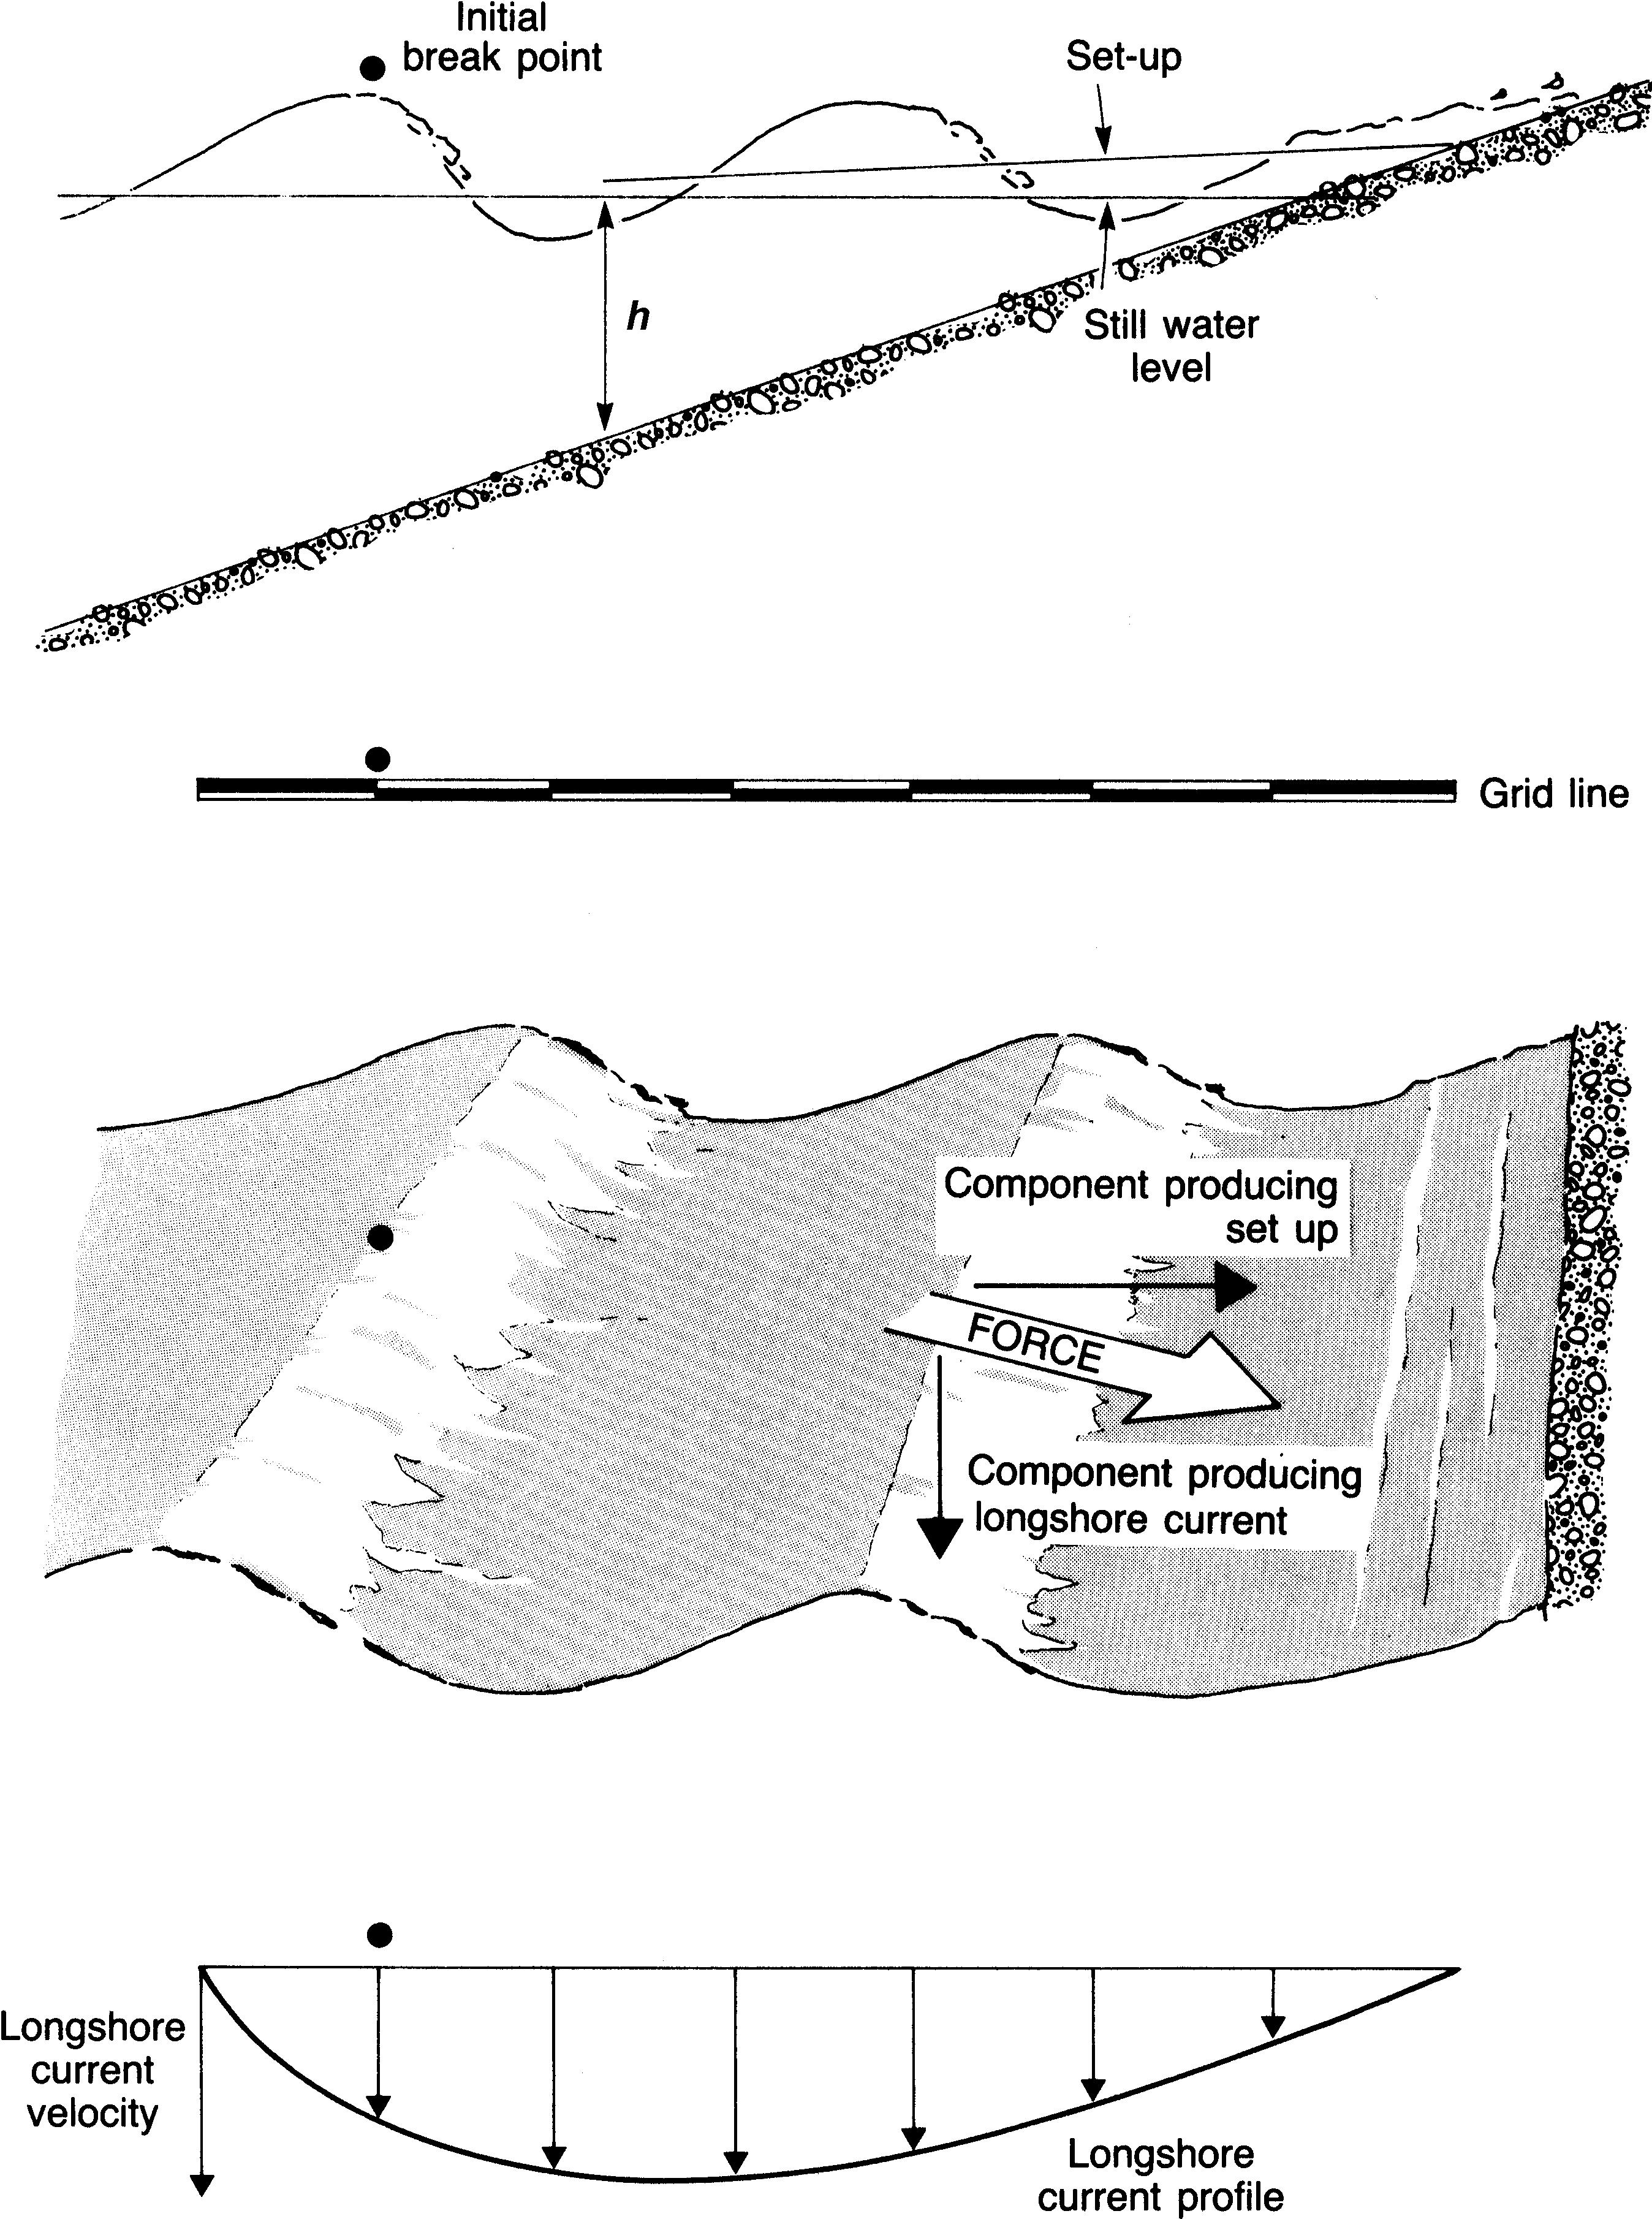
| 09:10, 6 June 2017 | ChadwickFig19.jpg (file) |  |
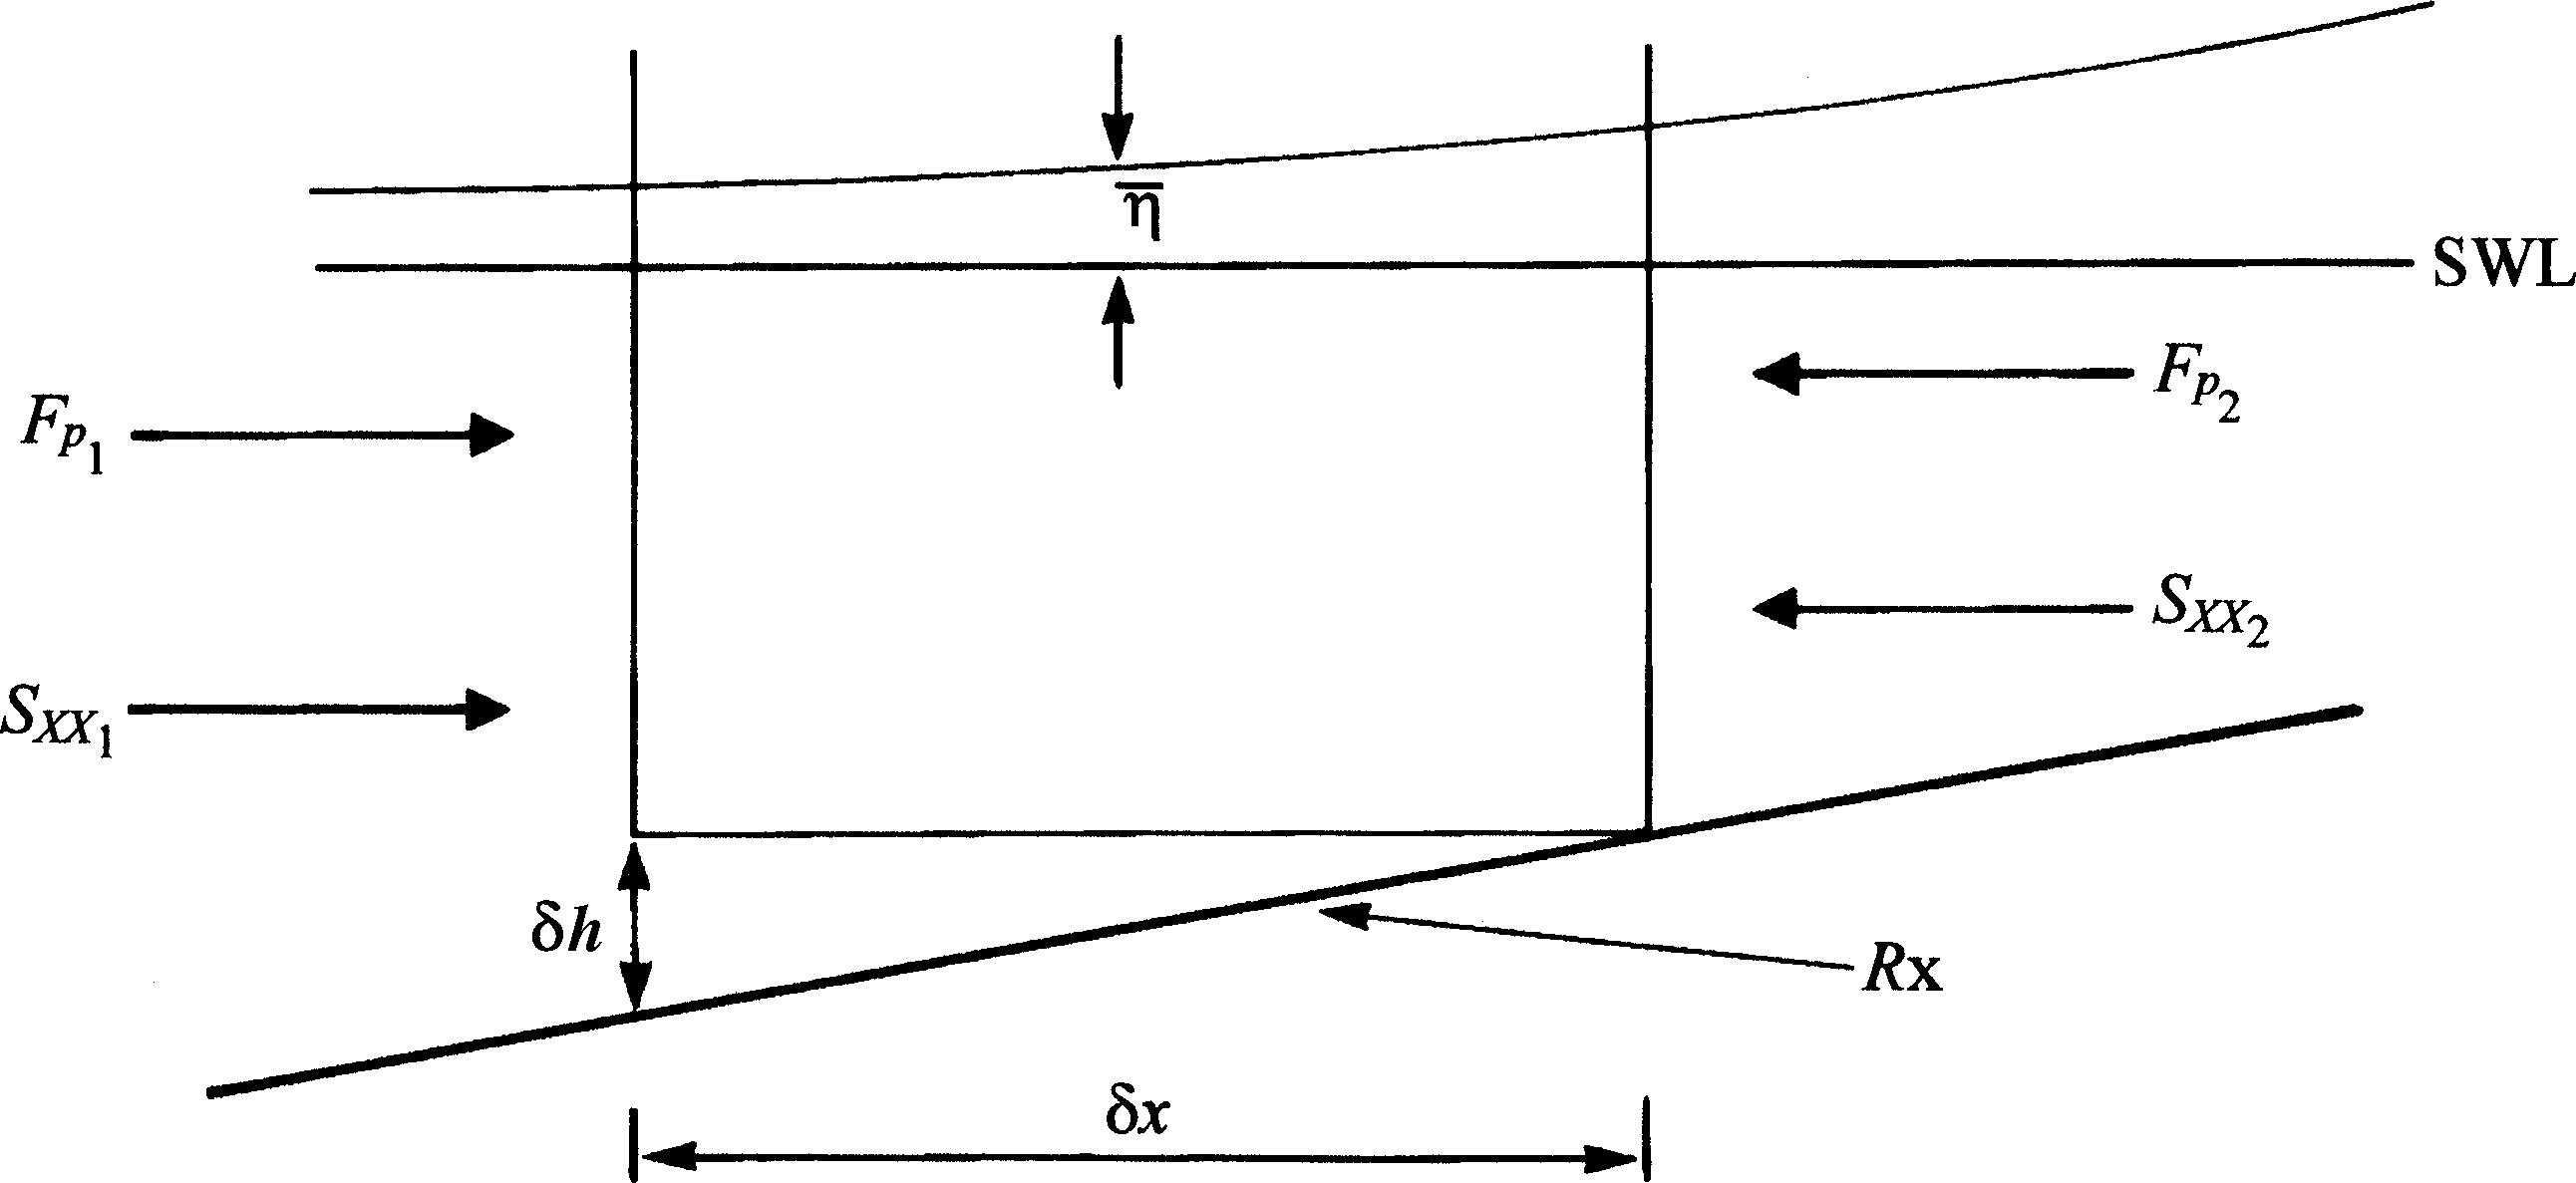
143 KB | Diagram for derivation of wave setdown/setup. | 1 |
| 09:08, 6 June 2017 | ChadwickFig18c.jpg (file) |  |
141 KB | Example of a plunging breaker. | 1 |
| 09:08, 6 June 2017 | ChadwickFig18b.jpg (file) |  |
174 KB | Example of a spilling breaker. | 1 |
| 09:07, 6 June 2017 | ChadwickFig18a.jpg (file) |  |
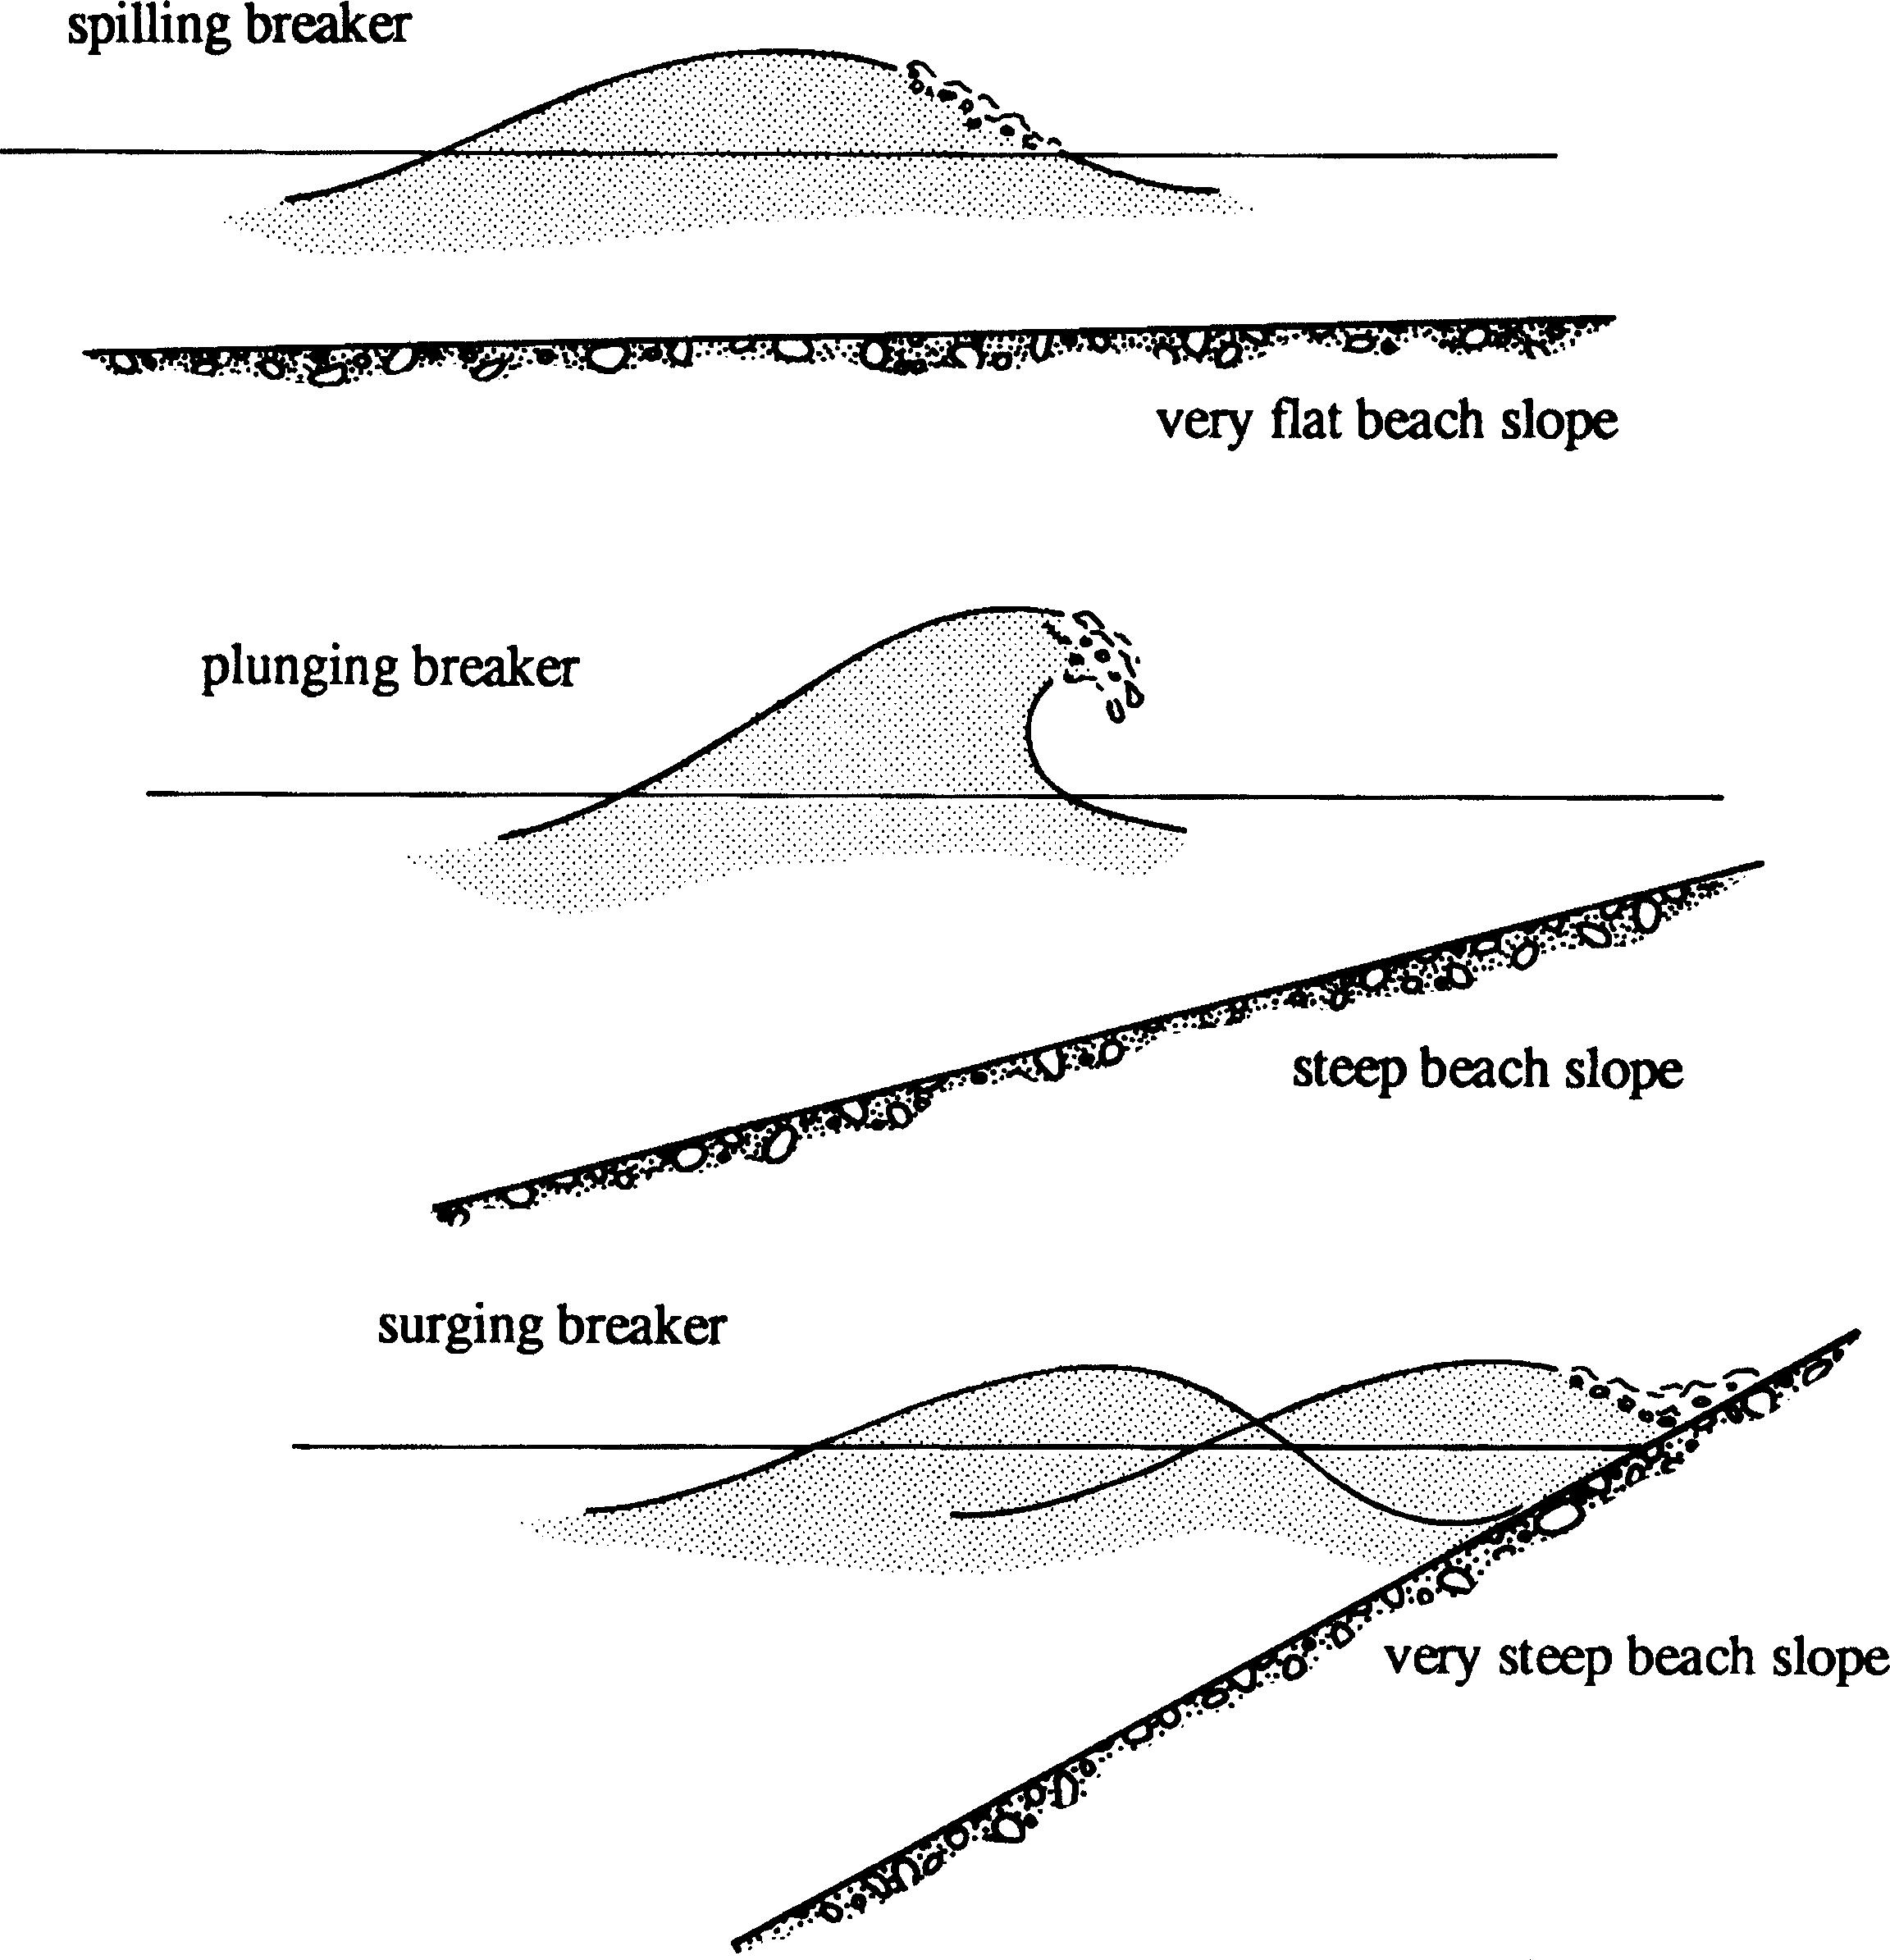
525 KB | Principal types of breaking waves. | 1 |
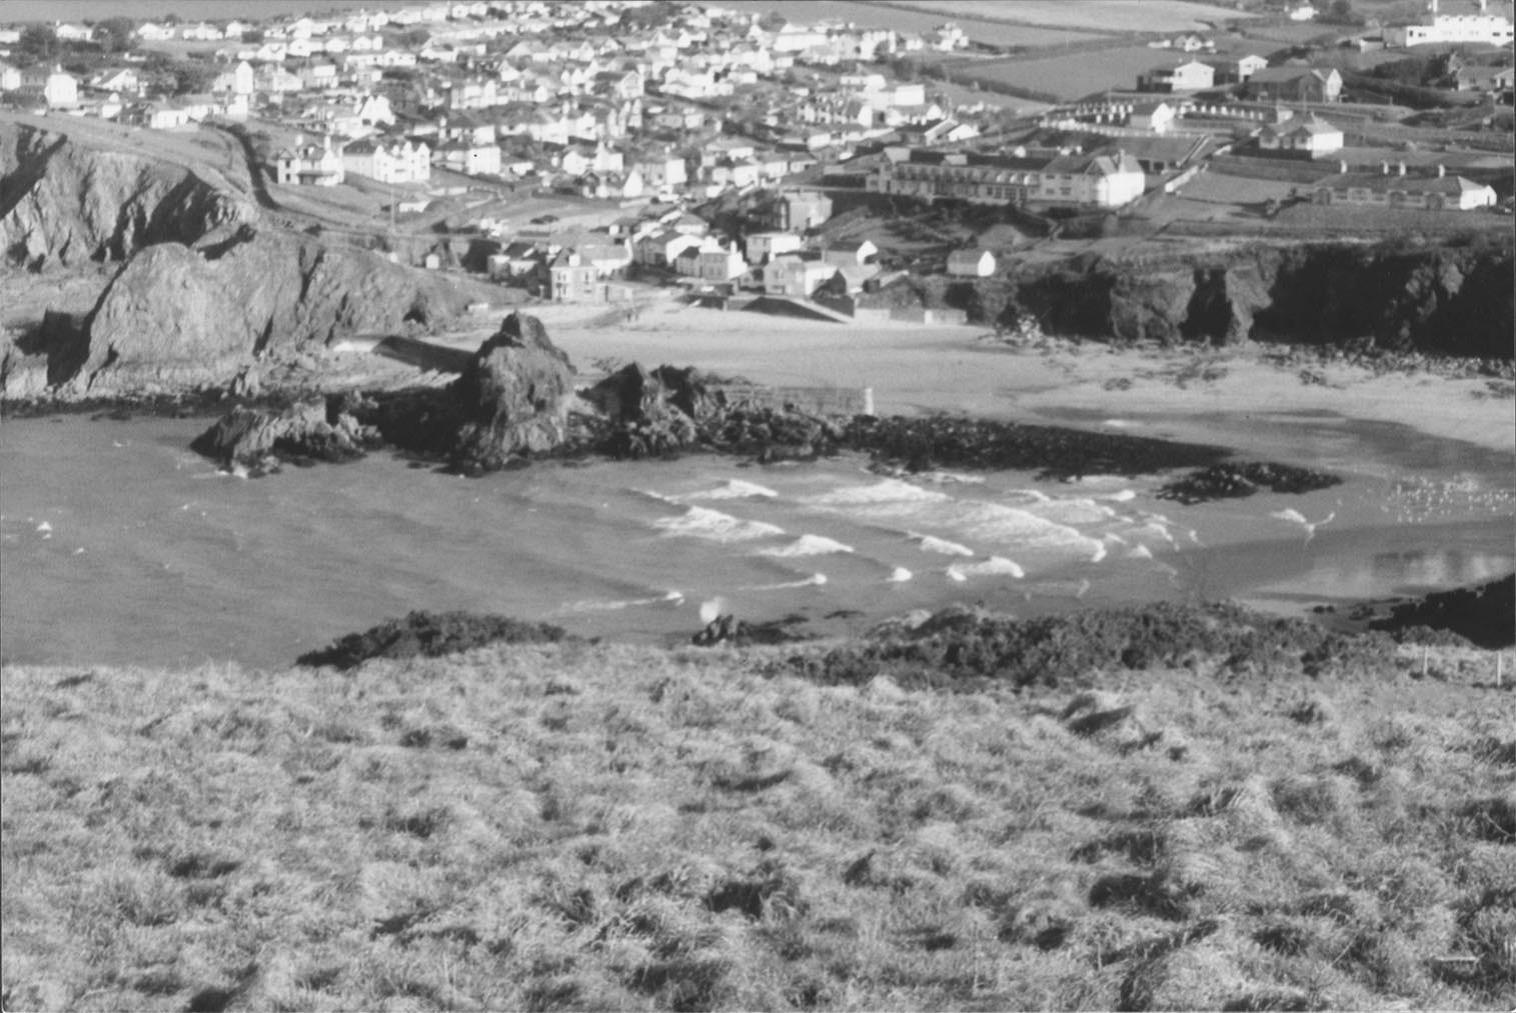
| 09:07, 6 June 2017 | ChadwickFig17b.jpg (file) |  |
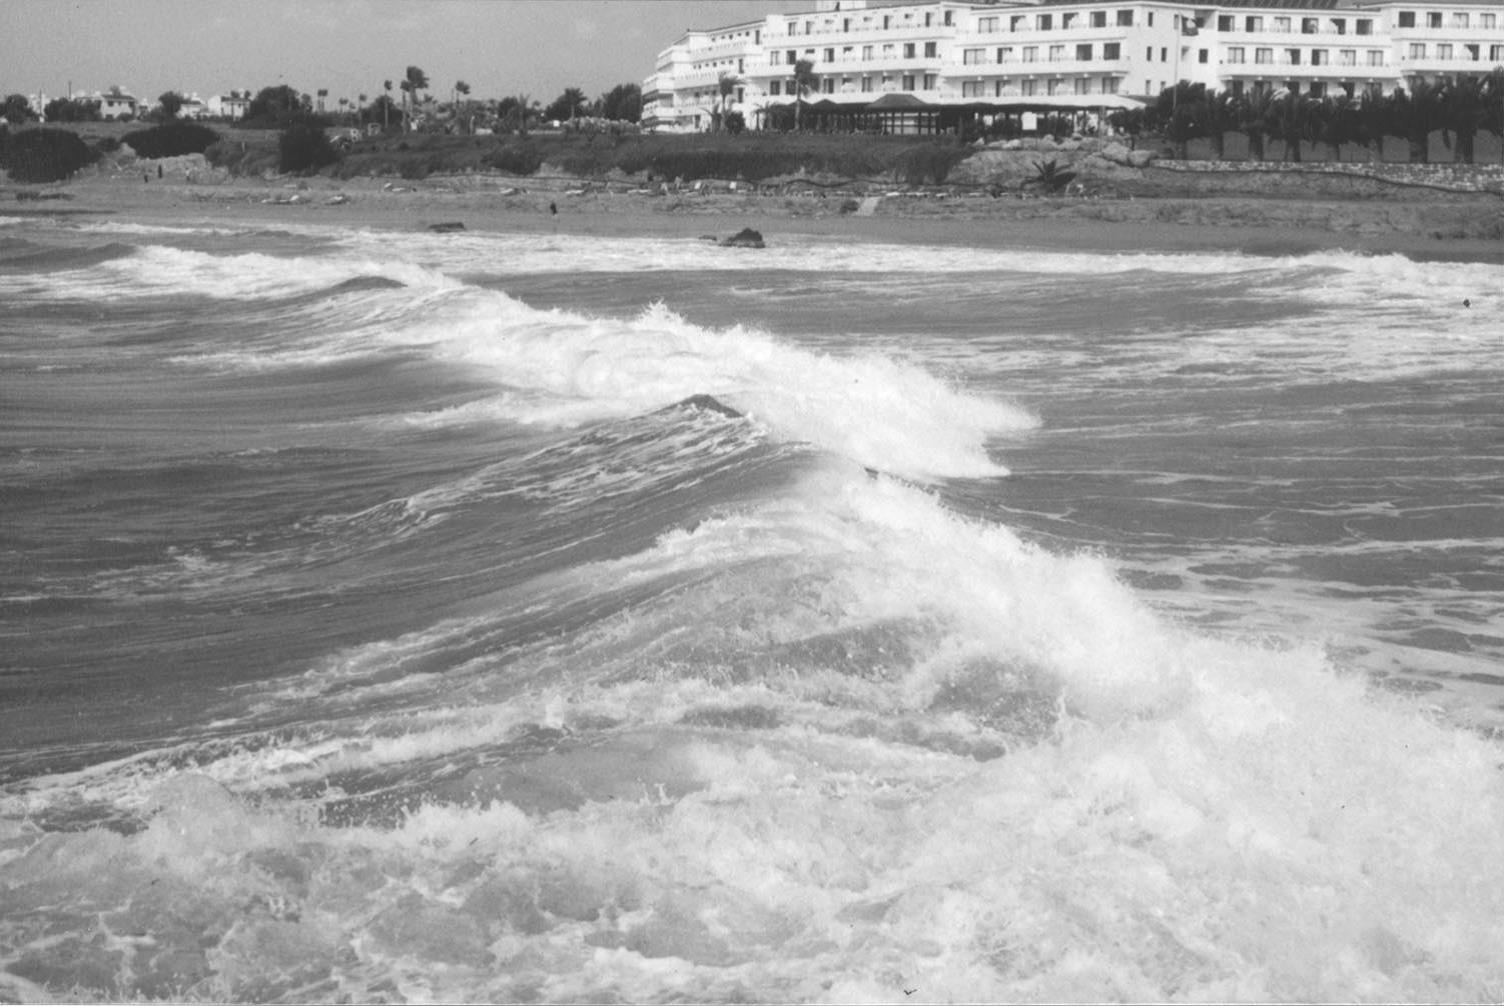
208 KB | A real surf zone at Hope Cove, Devon, England. | 1 |
| 09:06, 6 June 2017 | ChadwickFig17a.jpg (file) |  |
1.32 MB | The surf zone, conceptual. | 1 |
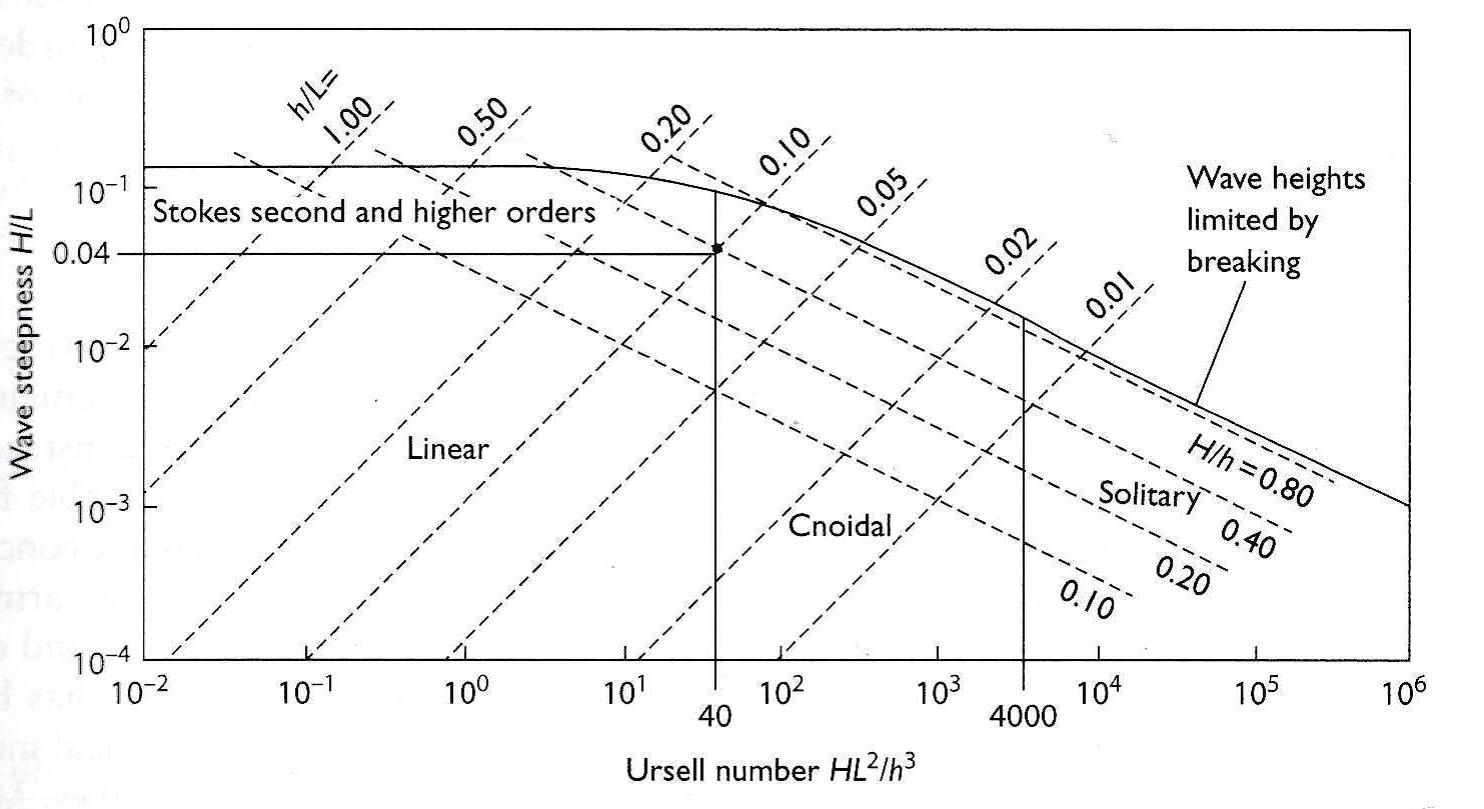
| 09:05, 6 June 2017 | ChadwickFig16.jpg (file) |  |
115 KB | Approximate regions of validity of analytical wave theories. | 1 |
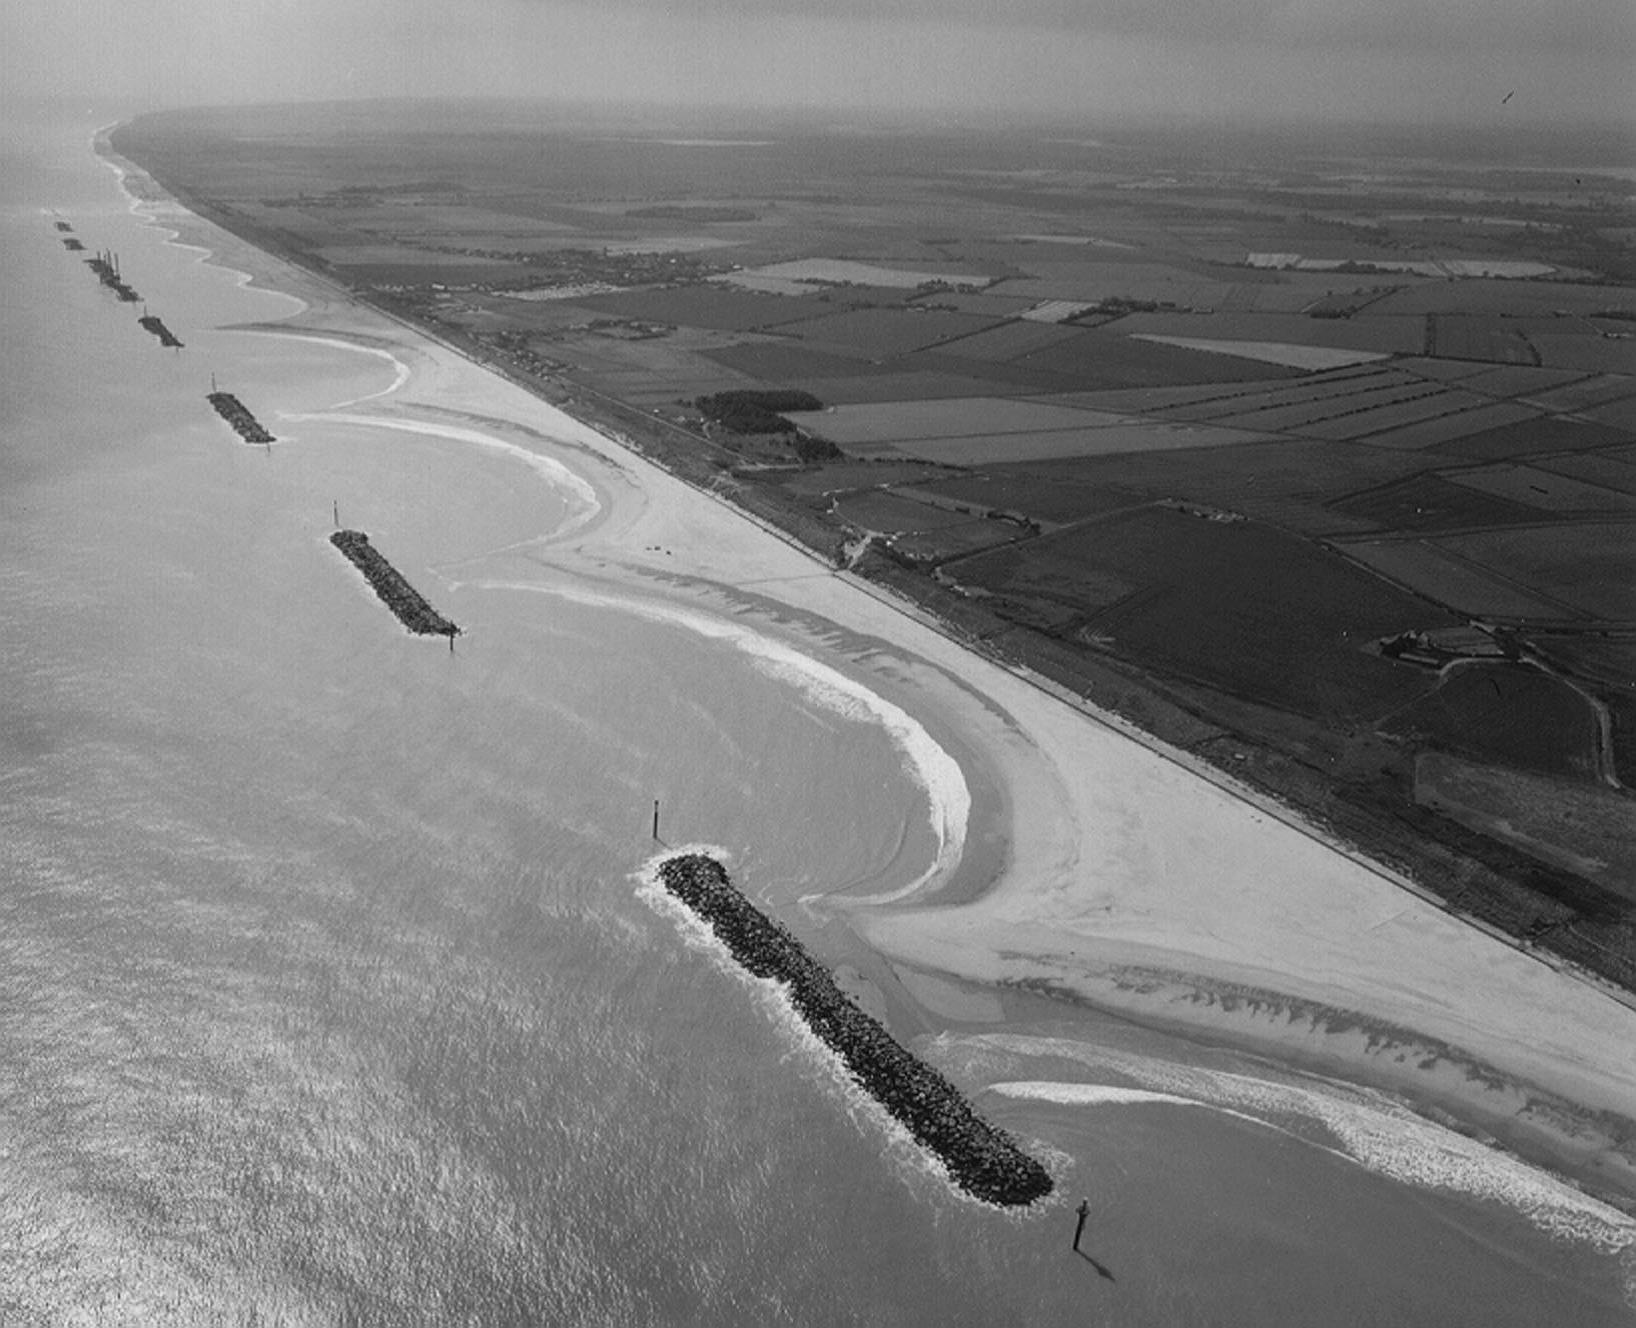
| 09:05, 6 June 2017 | ChadwickFig15d.jpg (file) |  |
232 KB | Aerial photograph of wave diffraction at the Happisburgh to Winterton scheme, Norfolk, England, (courtesy of Mike Page). | 1 |
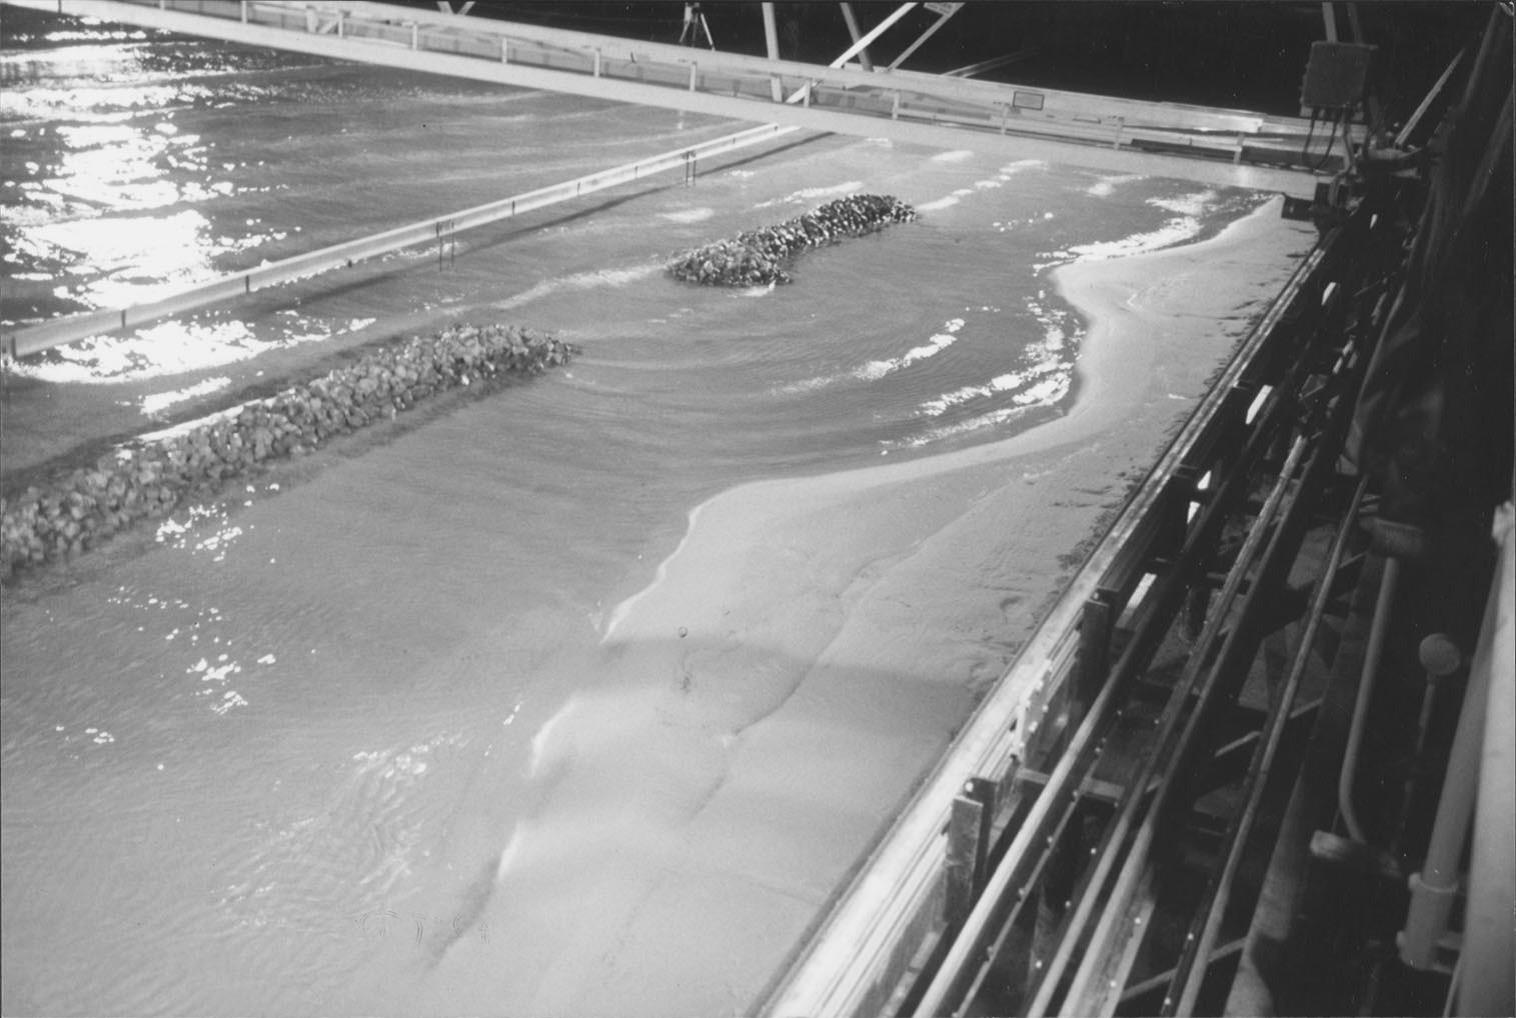
| 09:04, 6 June 2017 | ChadwickFig15c.jpg (file) |  |
147 KB | Physical model study of (b) in the UK Coastal Research Facility at HR Wallingford. | 1 |
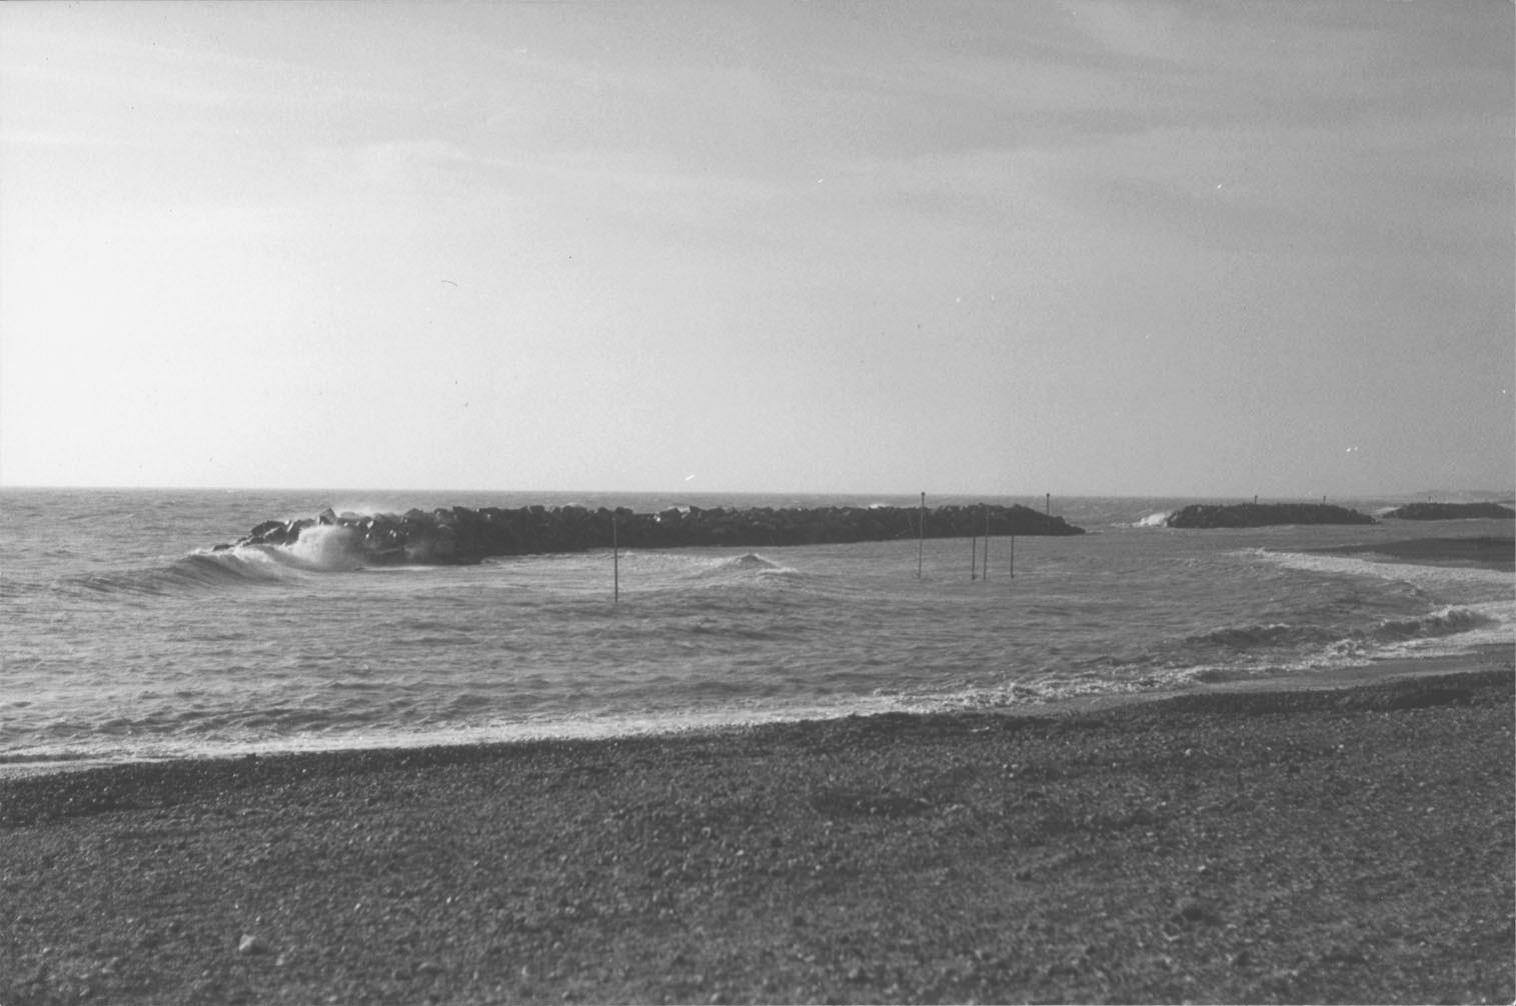
| 09:04, 6 June 2017 | ChadwickFig15b.jpg (file) |  |
138 KB | Photograph of real wave diffraction at the Elmer breakwater scheme, Sussex, England. | 1 |
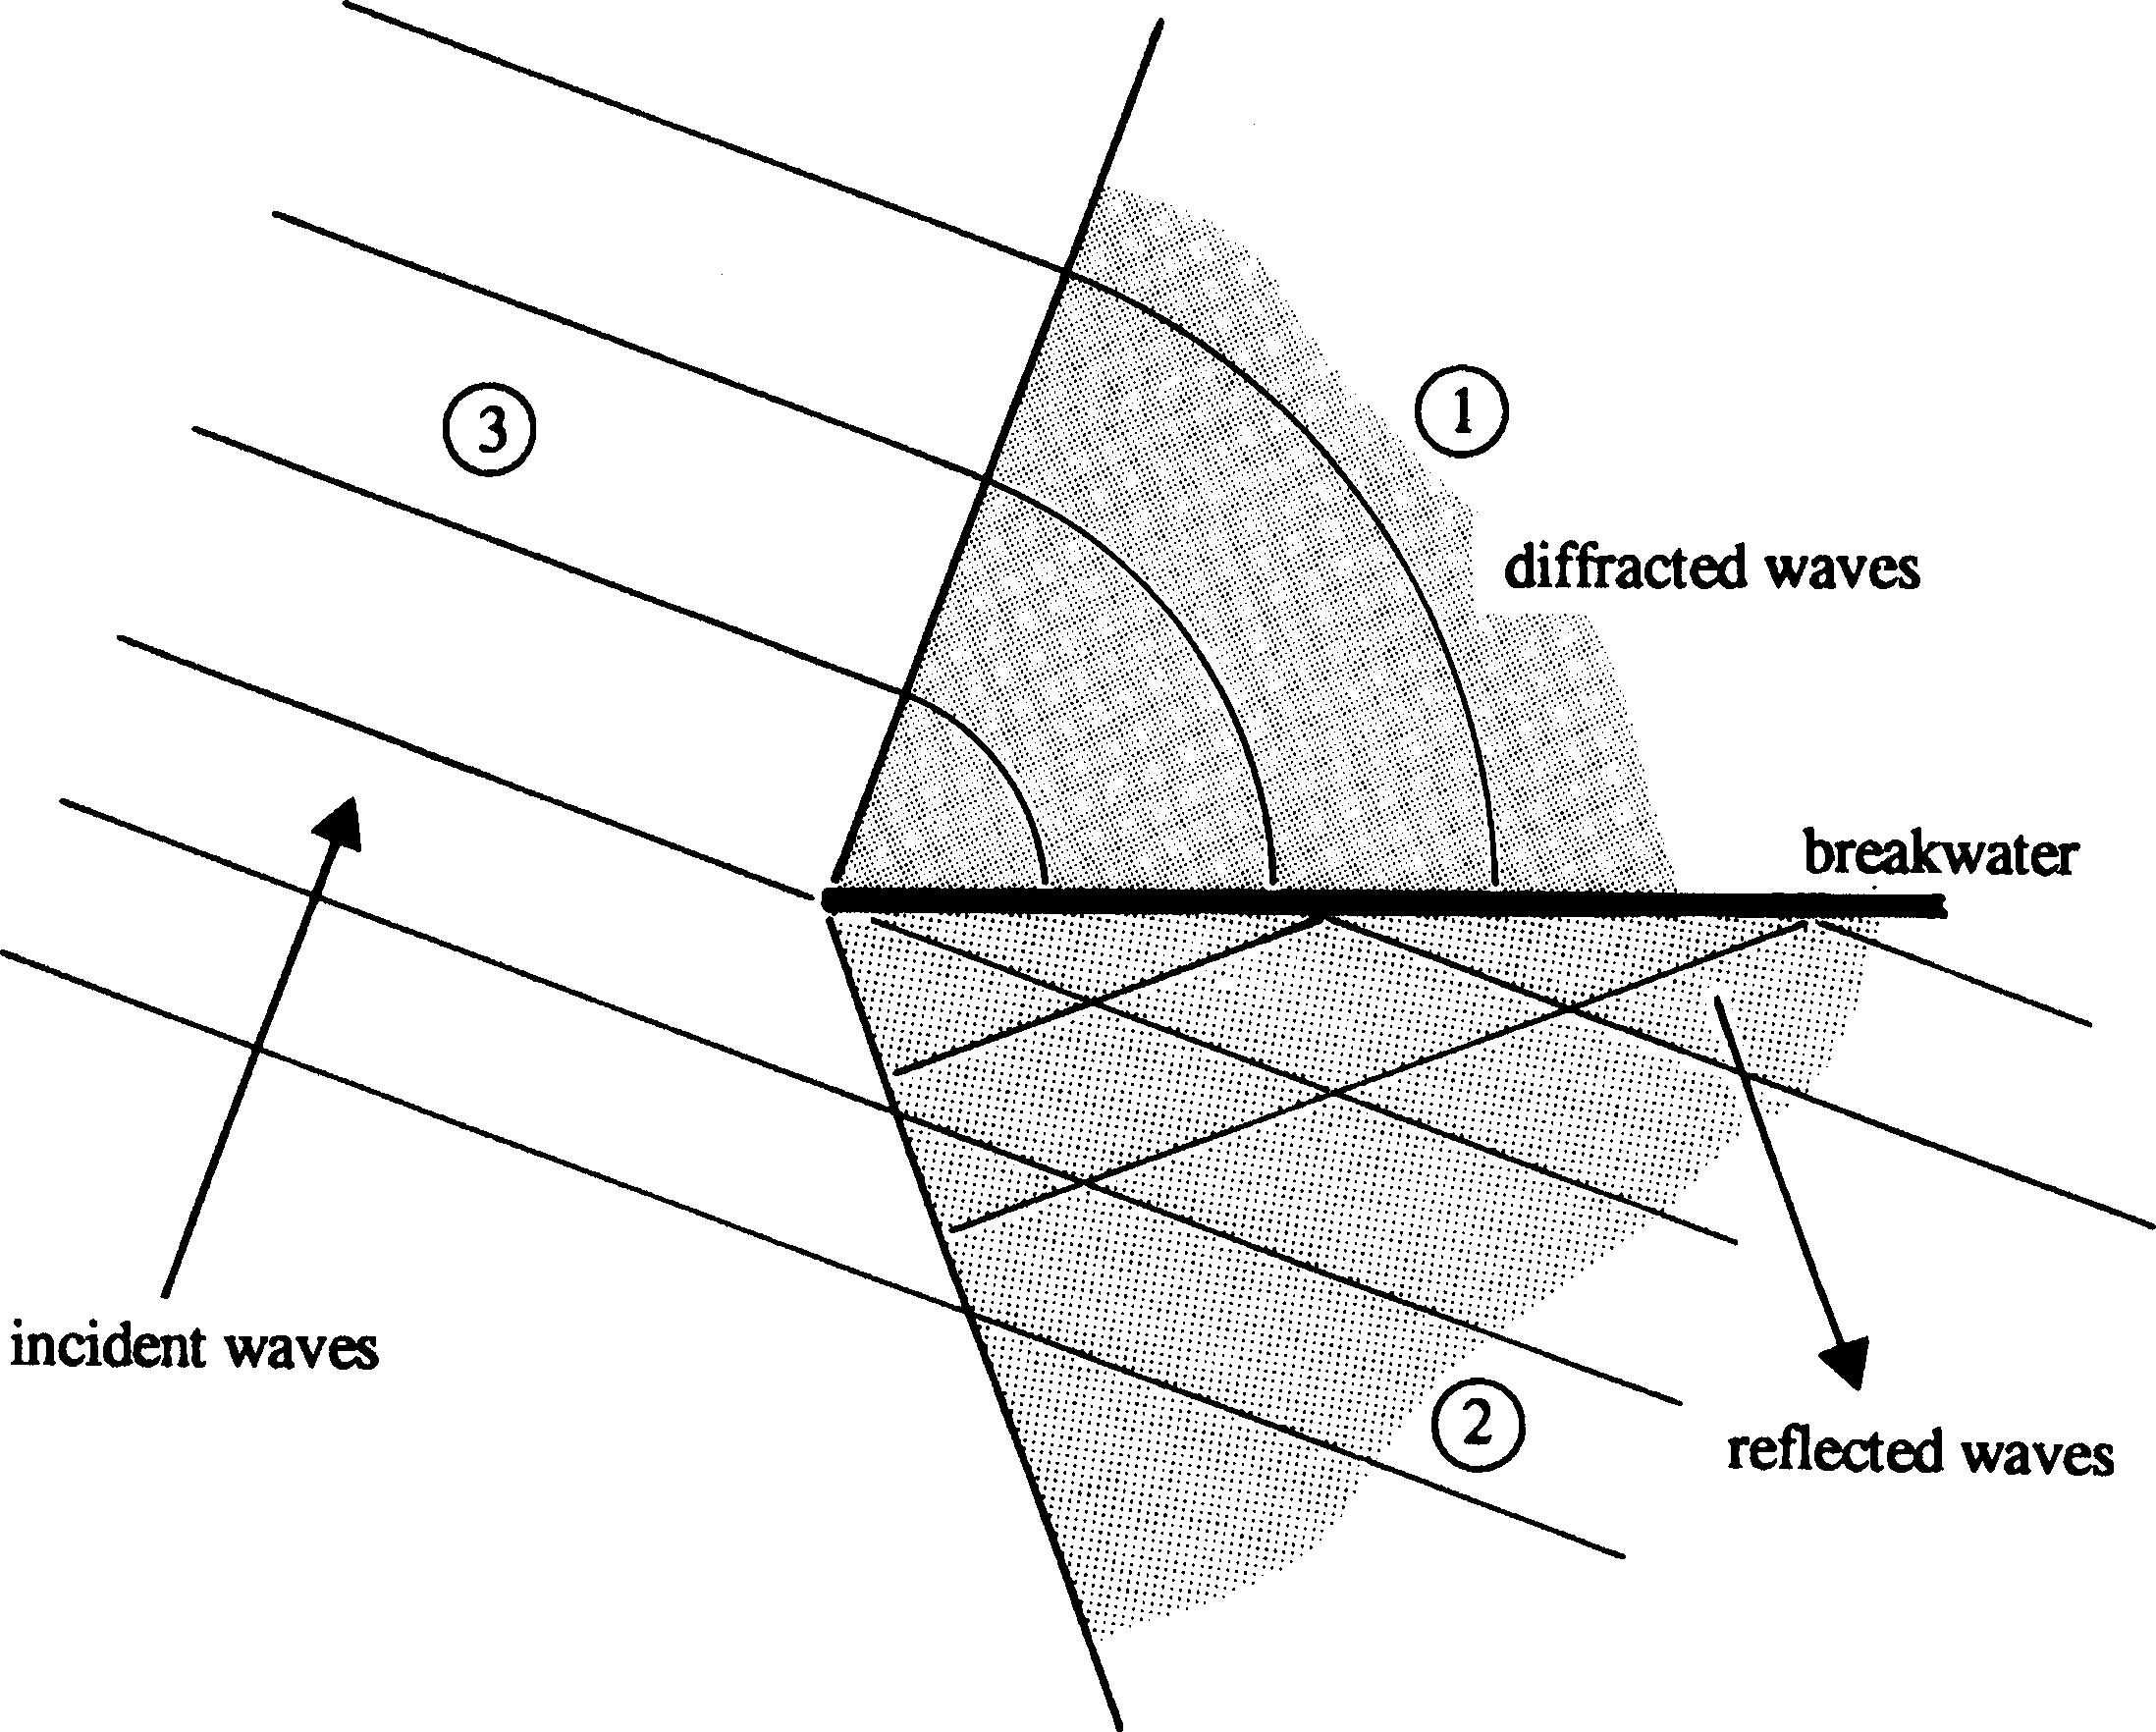
| 09:03, 6 June 2017 | ChadwickFig15a.jpg (file) |  |
613 KB | Idealised wave diffraction around an impermeable breakwater. | 1 |
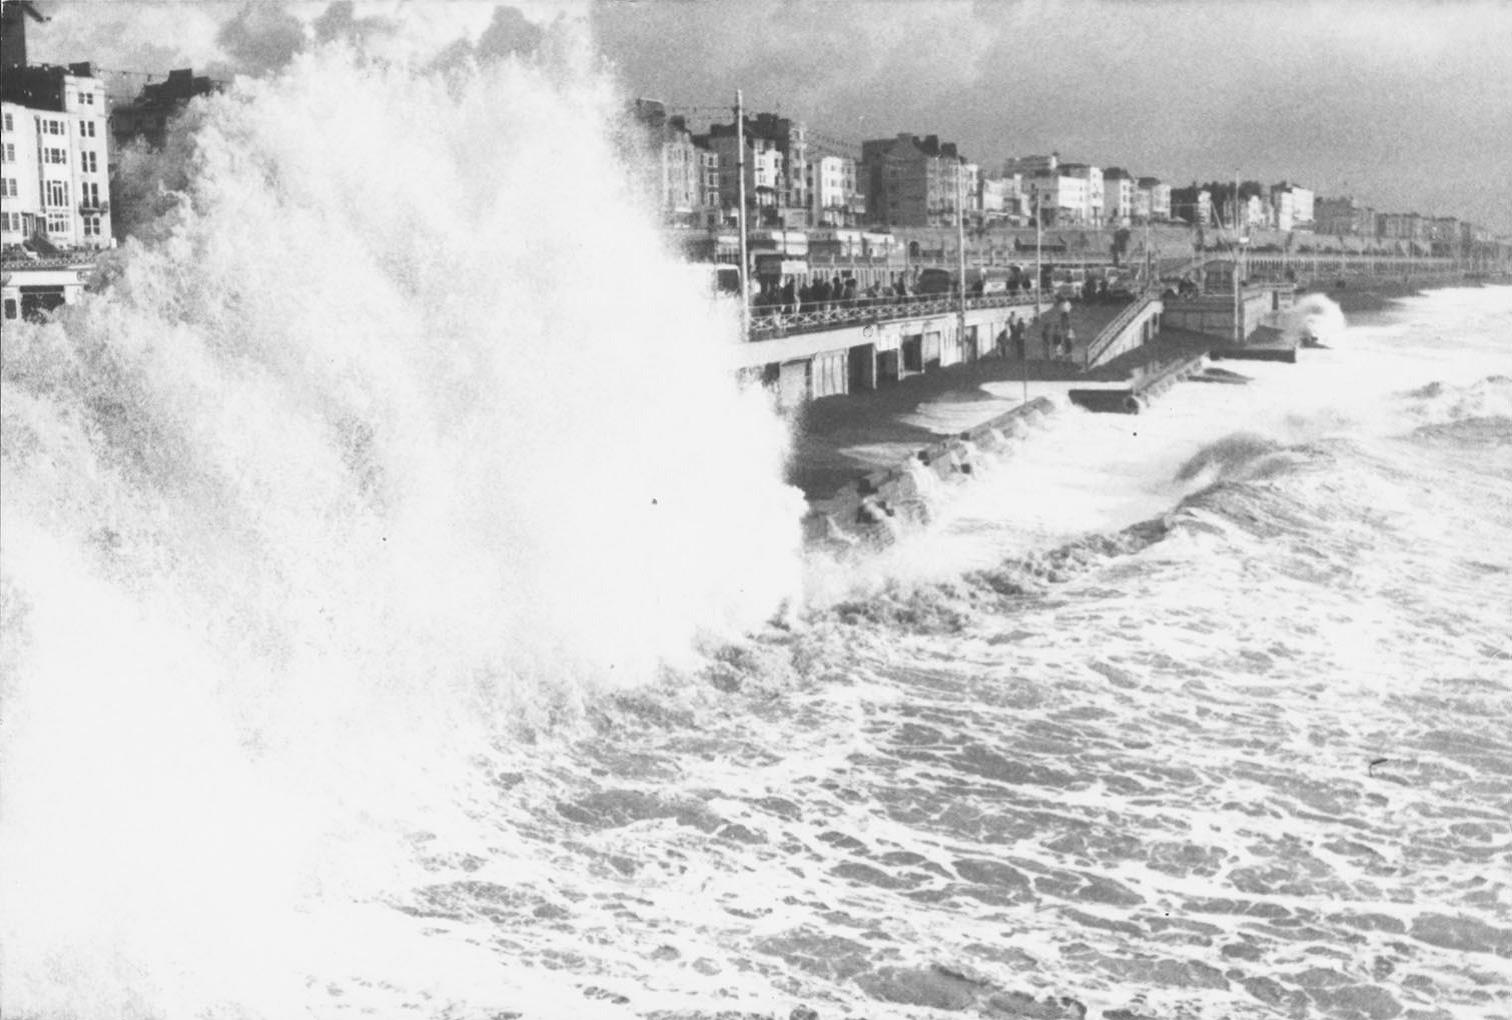
| 09:02, 6 June 2017 | ChadwickFig14.jpg (file) |  |
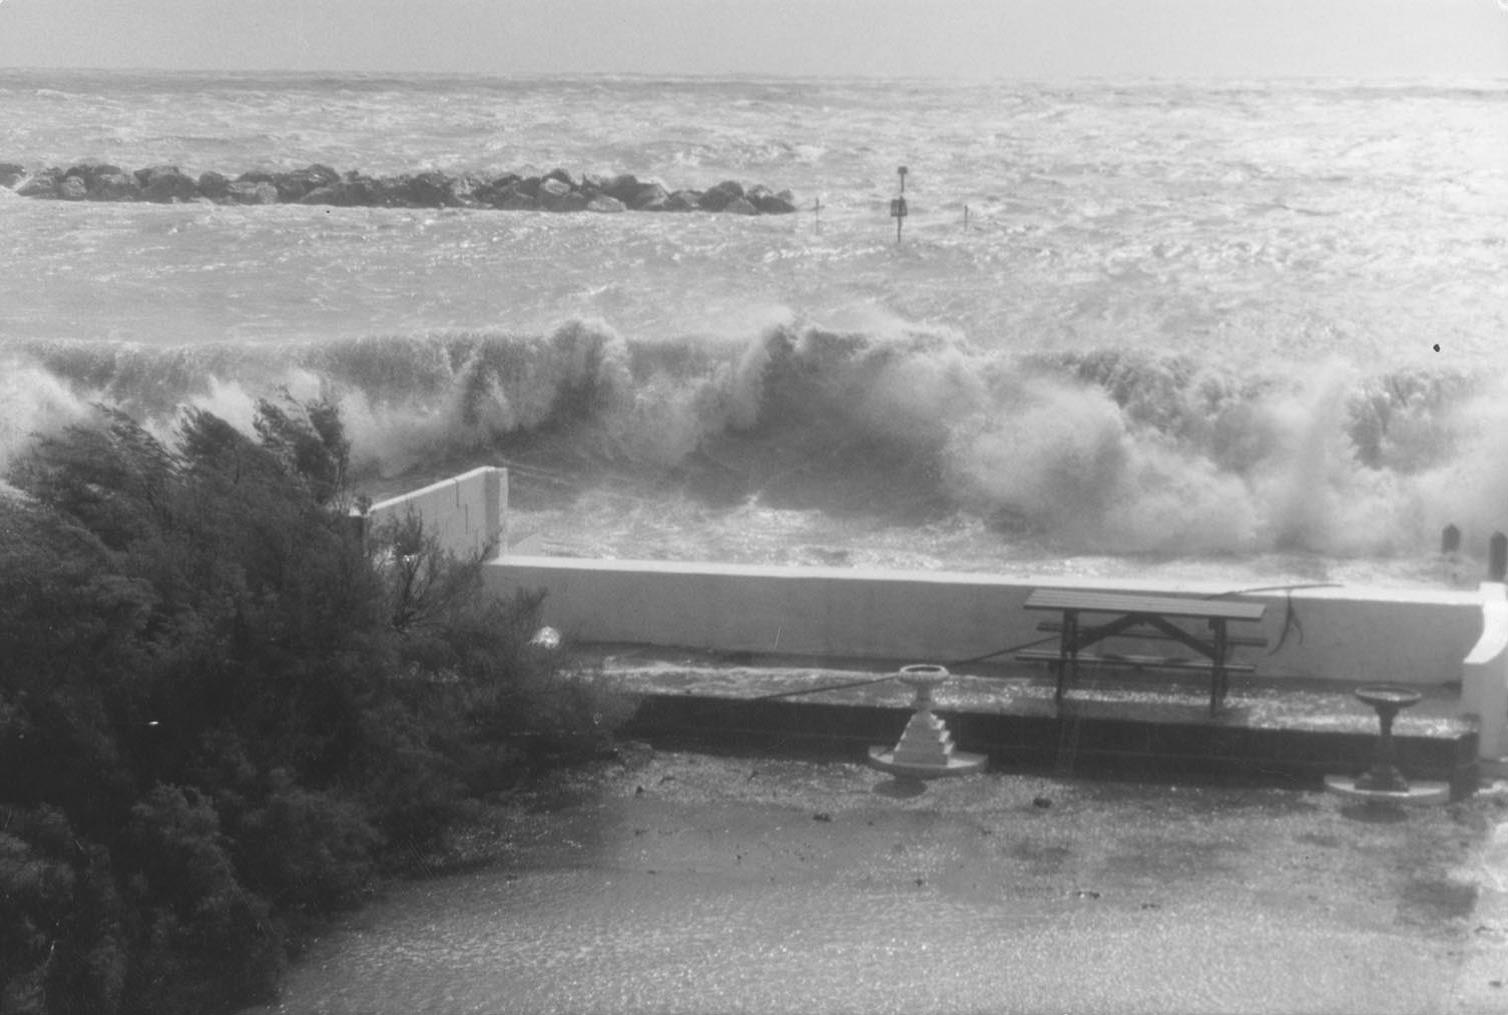
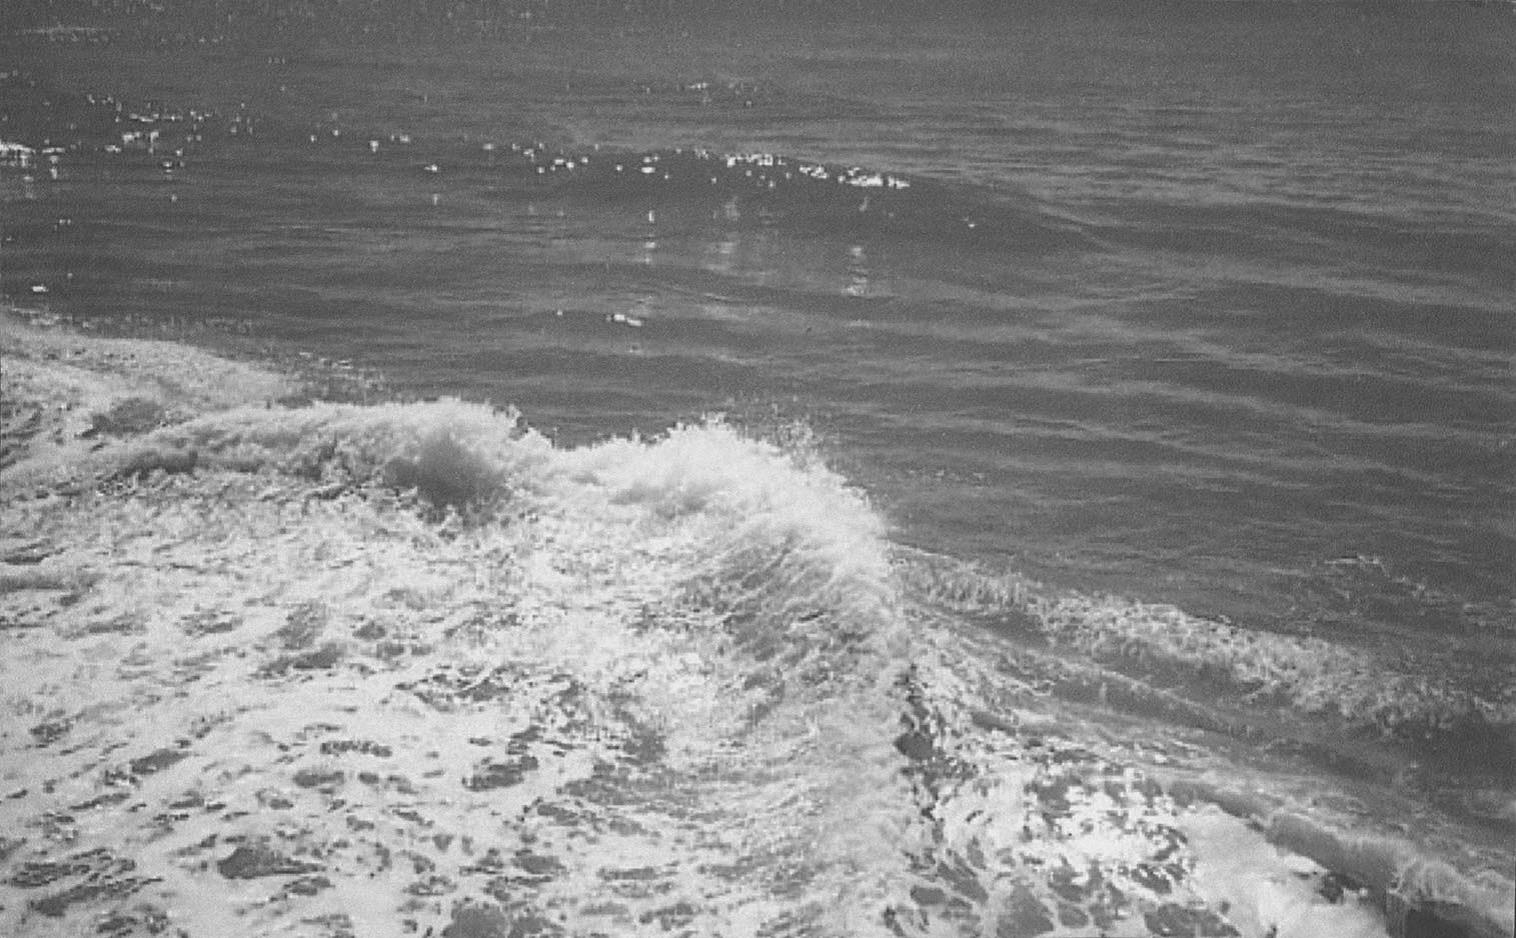
165 KB | Wave impact and reflection during a storm. | 1 |
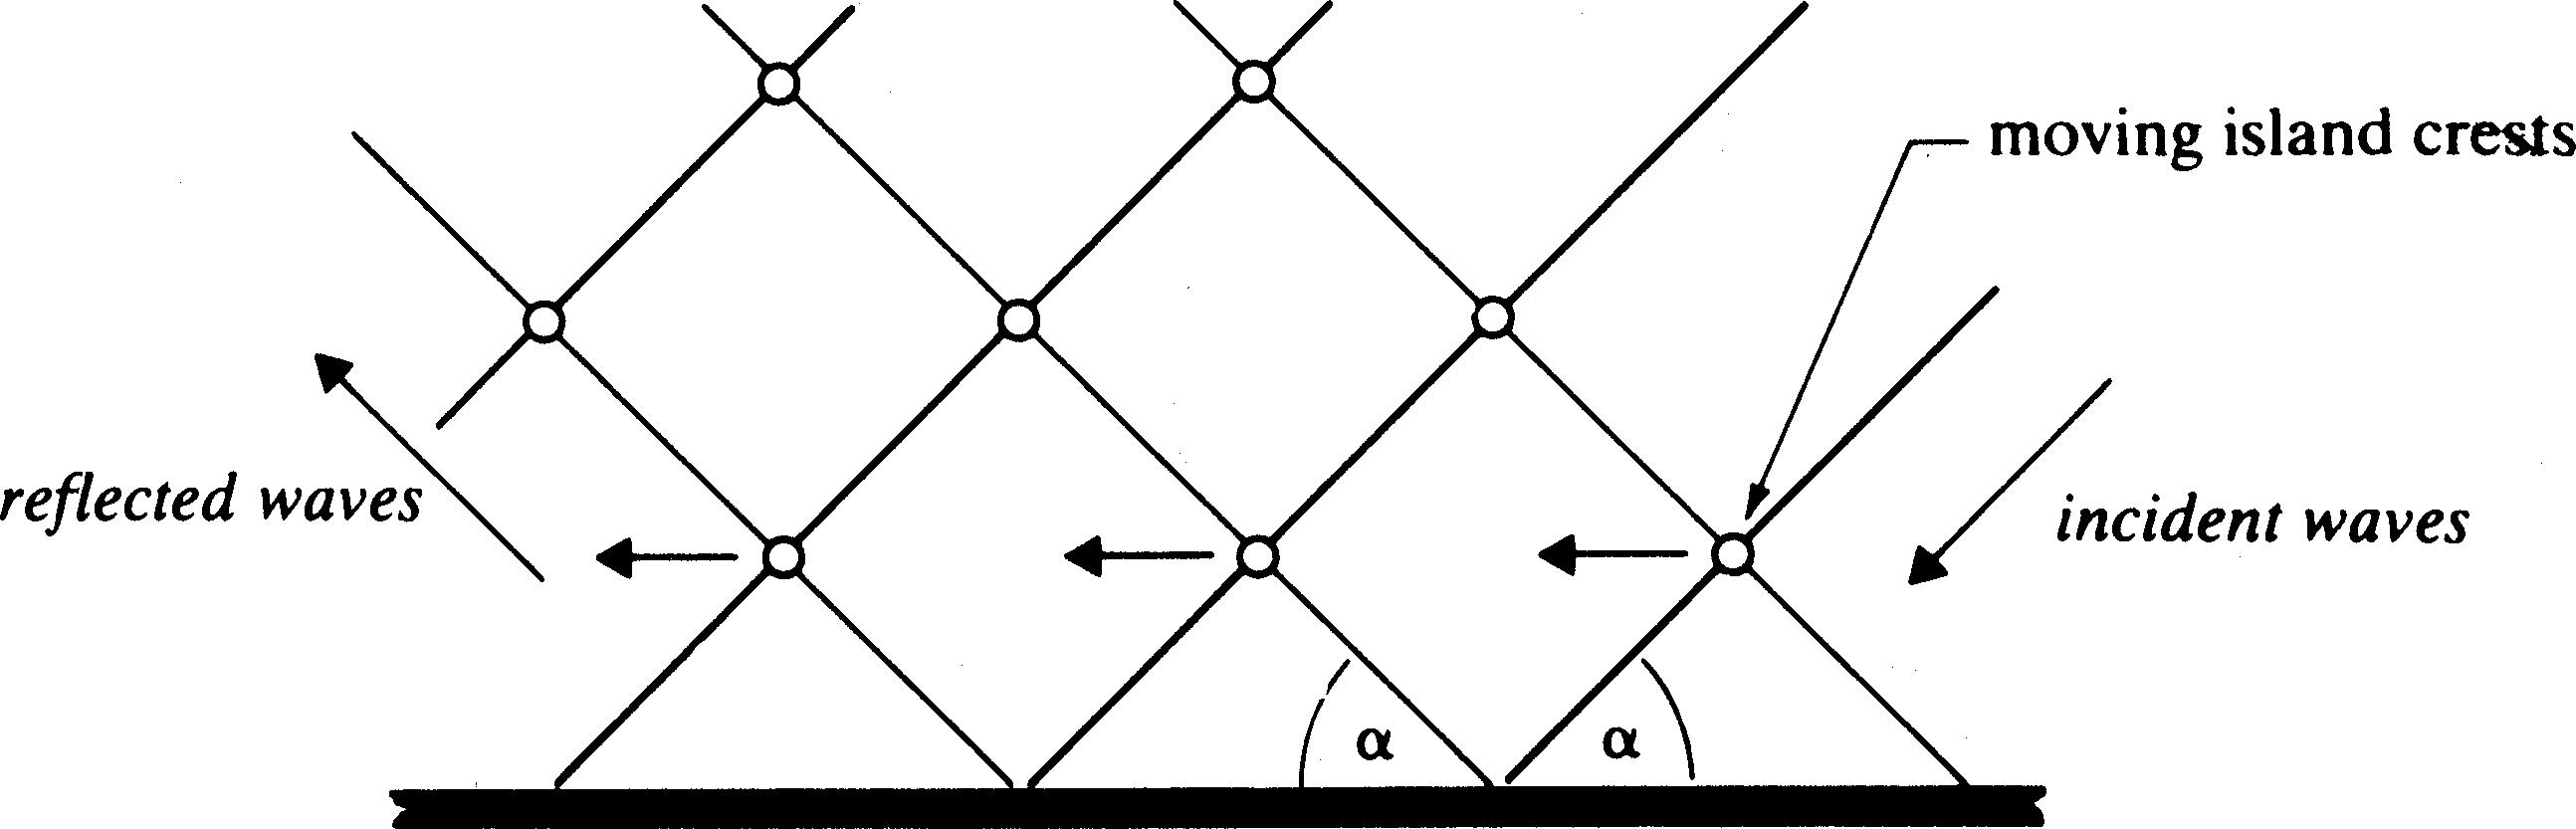
| 09:02, 6 June 2017 | ChadwickFig13.jpg (file) |  |
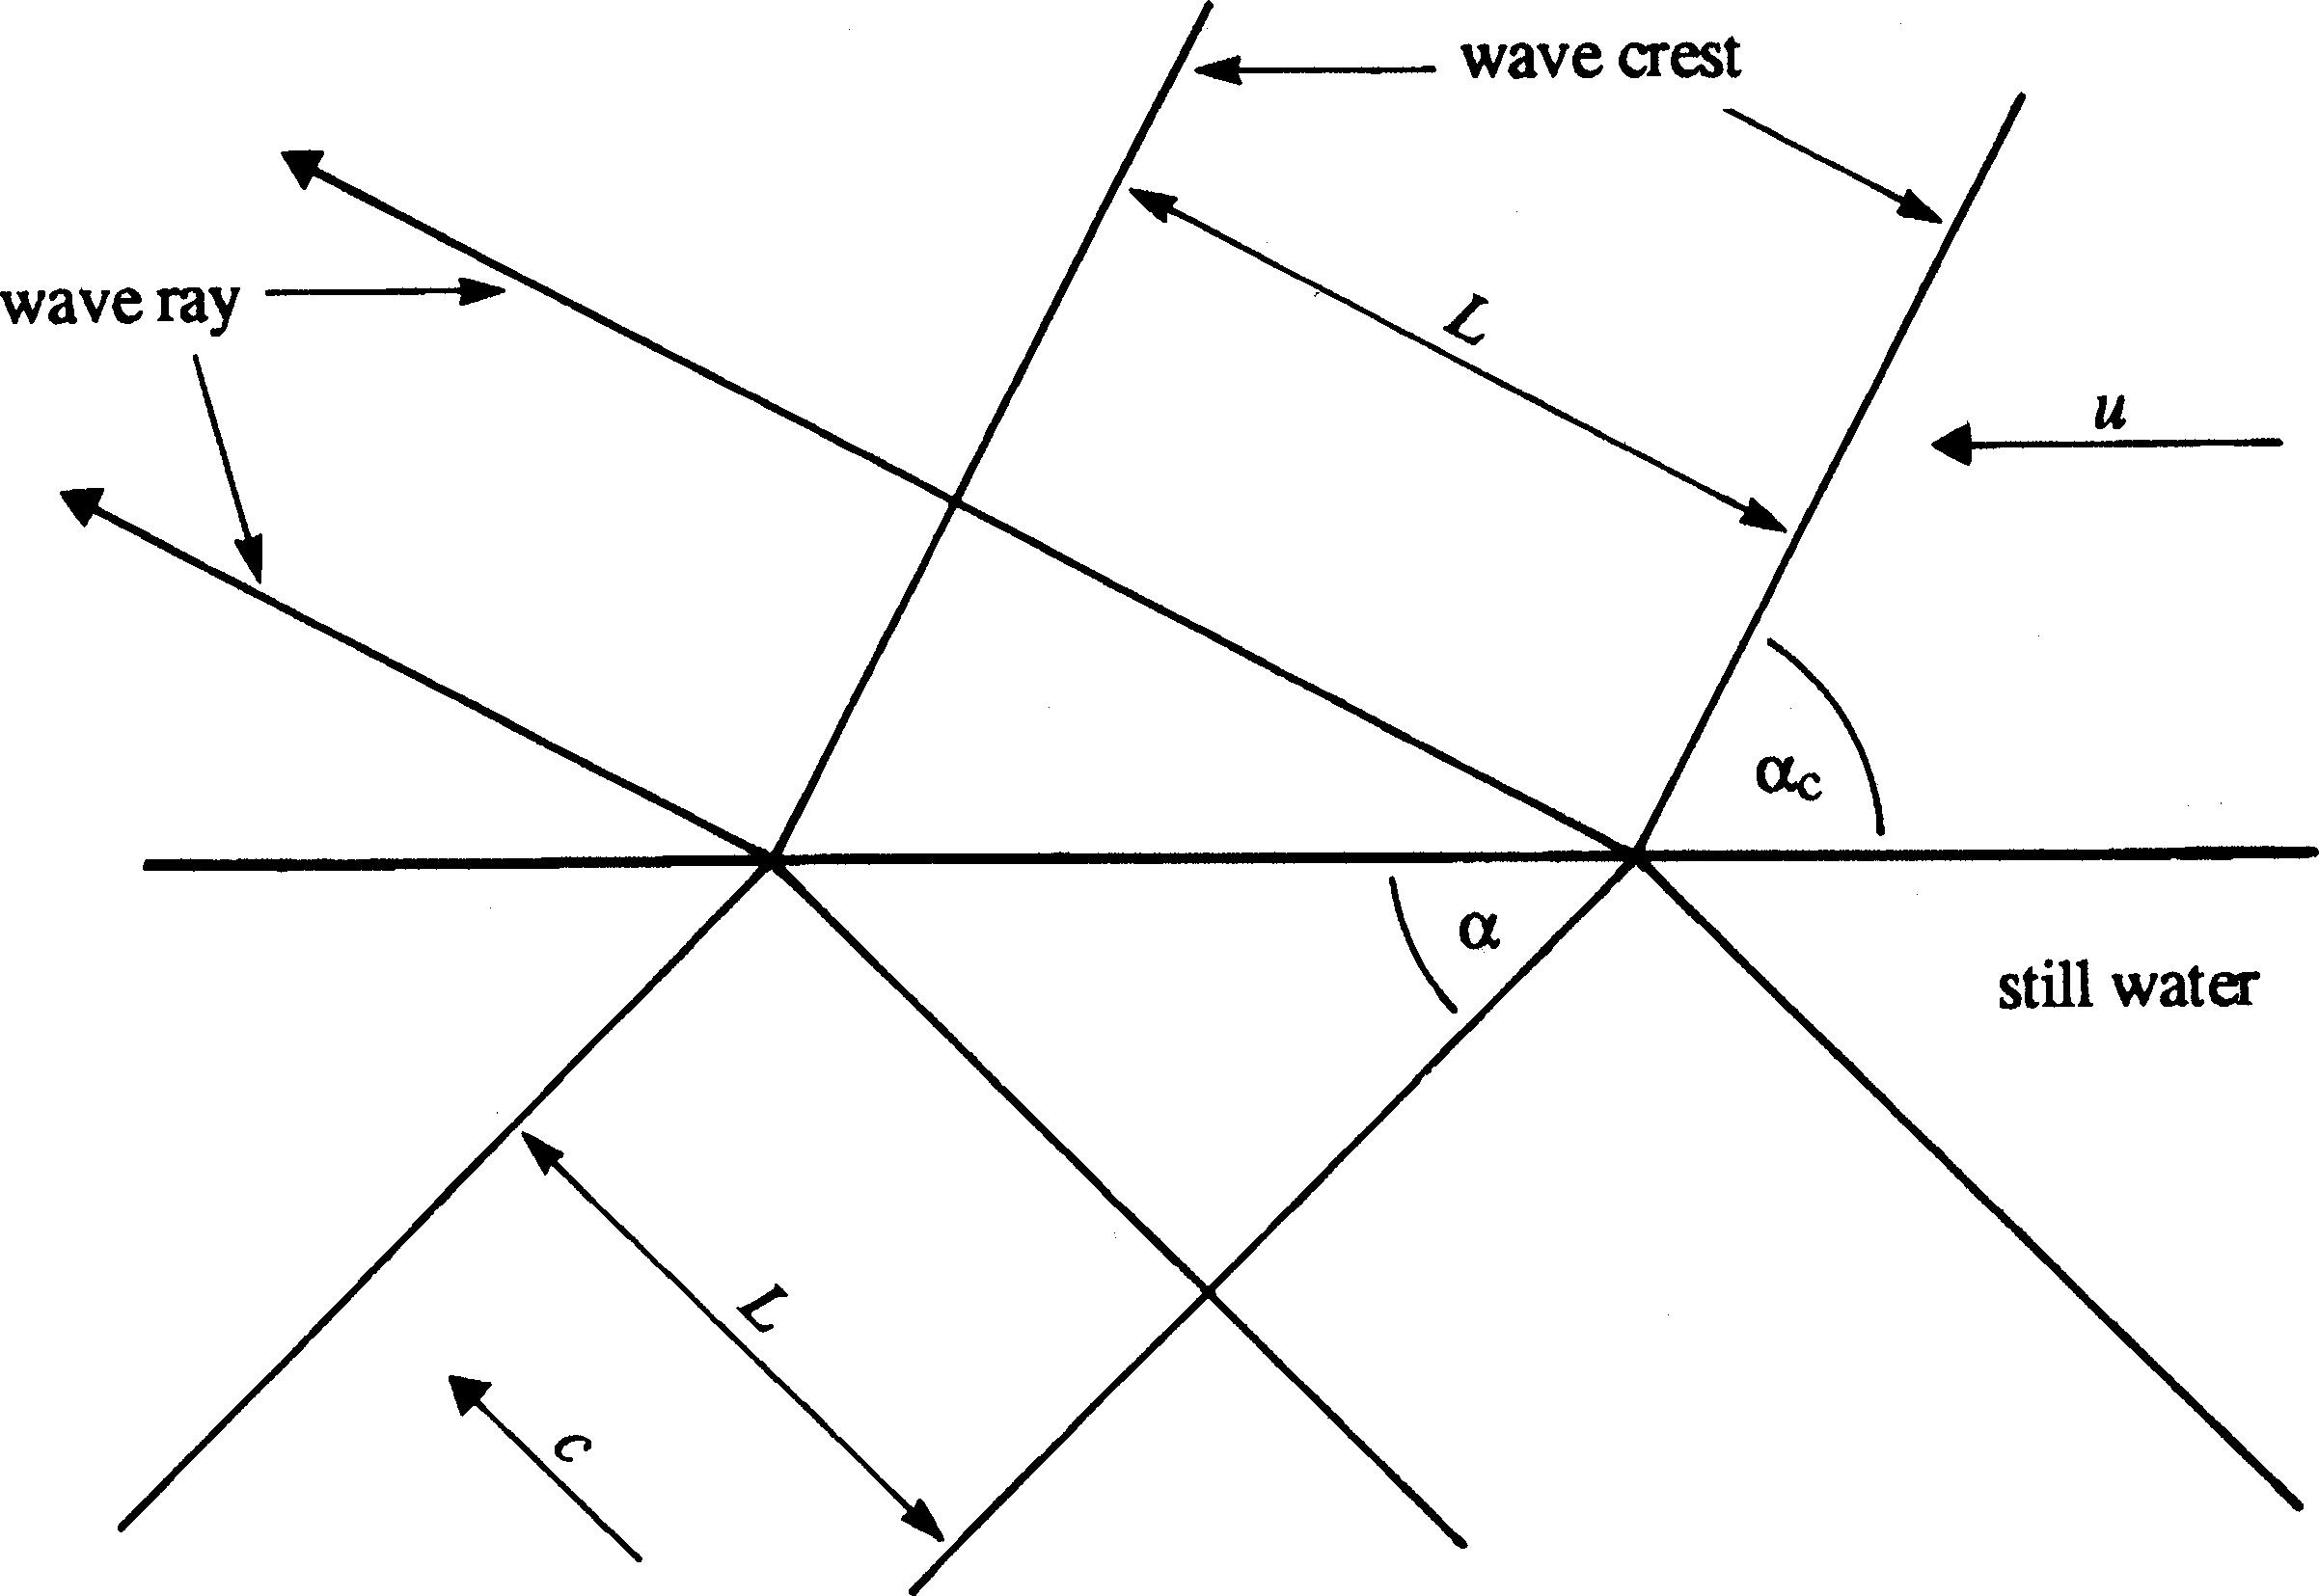
141 KB | Plan view of oblique wave reflection. | 1 |
| 09:01, 6 June 2017 | ChadwickFig12b.jpg (file) |  |
214 KB | Standing Waves, observed clapotis. | 1 |
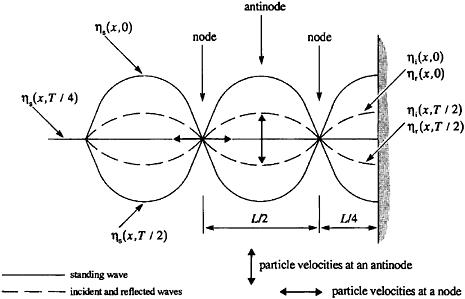
| 08:59, 6 June 2017 | ChadwickFig12a.jpg (file) |  |
22 KB | Standing Waves, idealised. | 1 |
| 08:58, 6 June 2017 | ChadwickFig11.jpg (file) |  |
198 KB | Deep water wave refraction by a current. | 1 |
| 08:57, 6 June 2017 | ChadwickFig10.jpg (file) |  |
49 KB | Reproduced from Goda (2000) Figure 3.7. | 1 |
| 08:56, 6 June 2017 | ChadwickFig9.jpg (file) |  |
187 KB | Reproduced from Goda (2000) Figure 3.6. | 1 |
| 08:56, 6 June 2017 | ChadwickFig8.jpg (file) |  |
200 KB | Divergence of wave rays over parallel contours. | 1 |
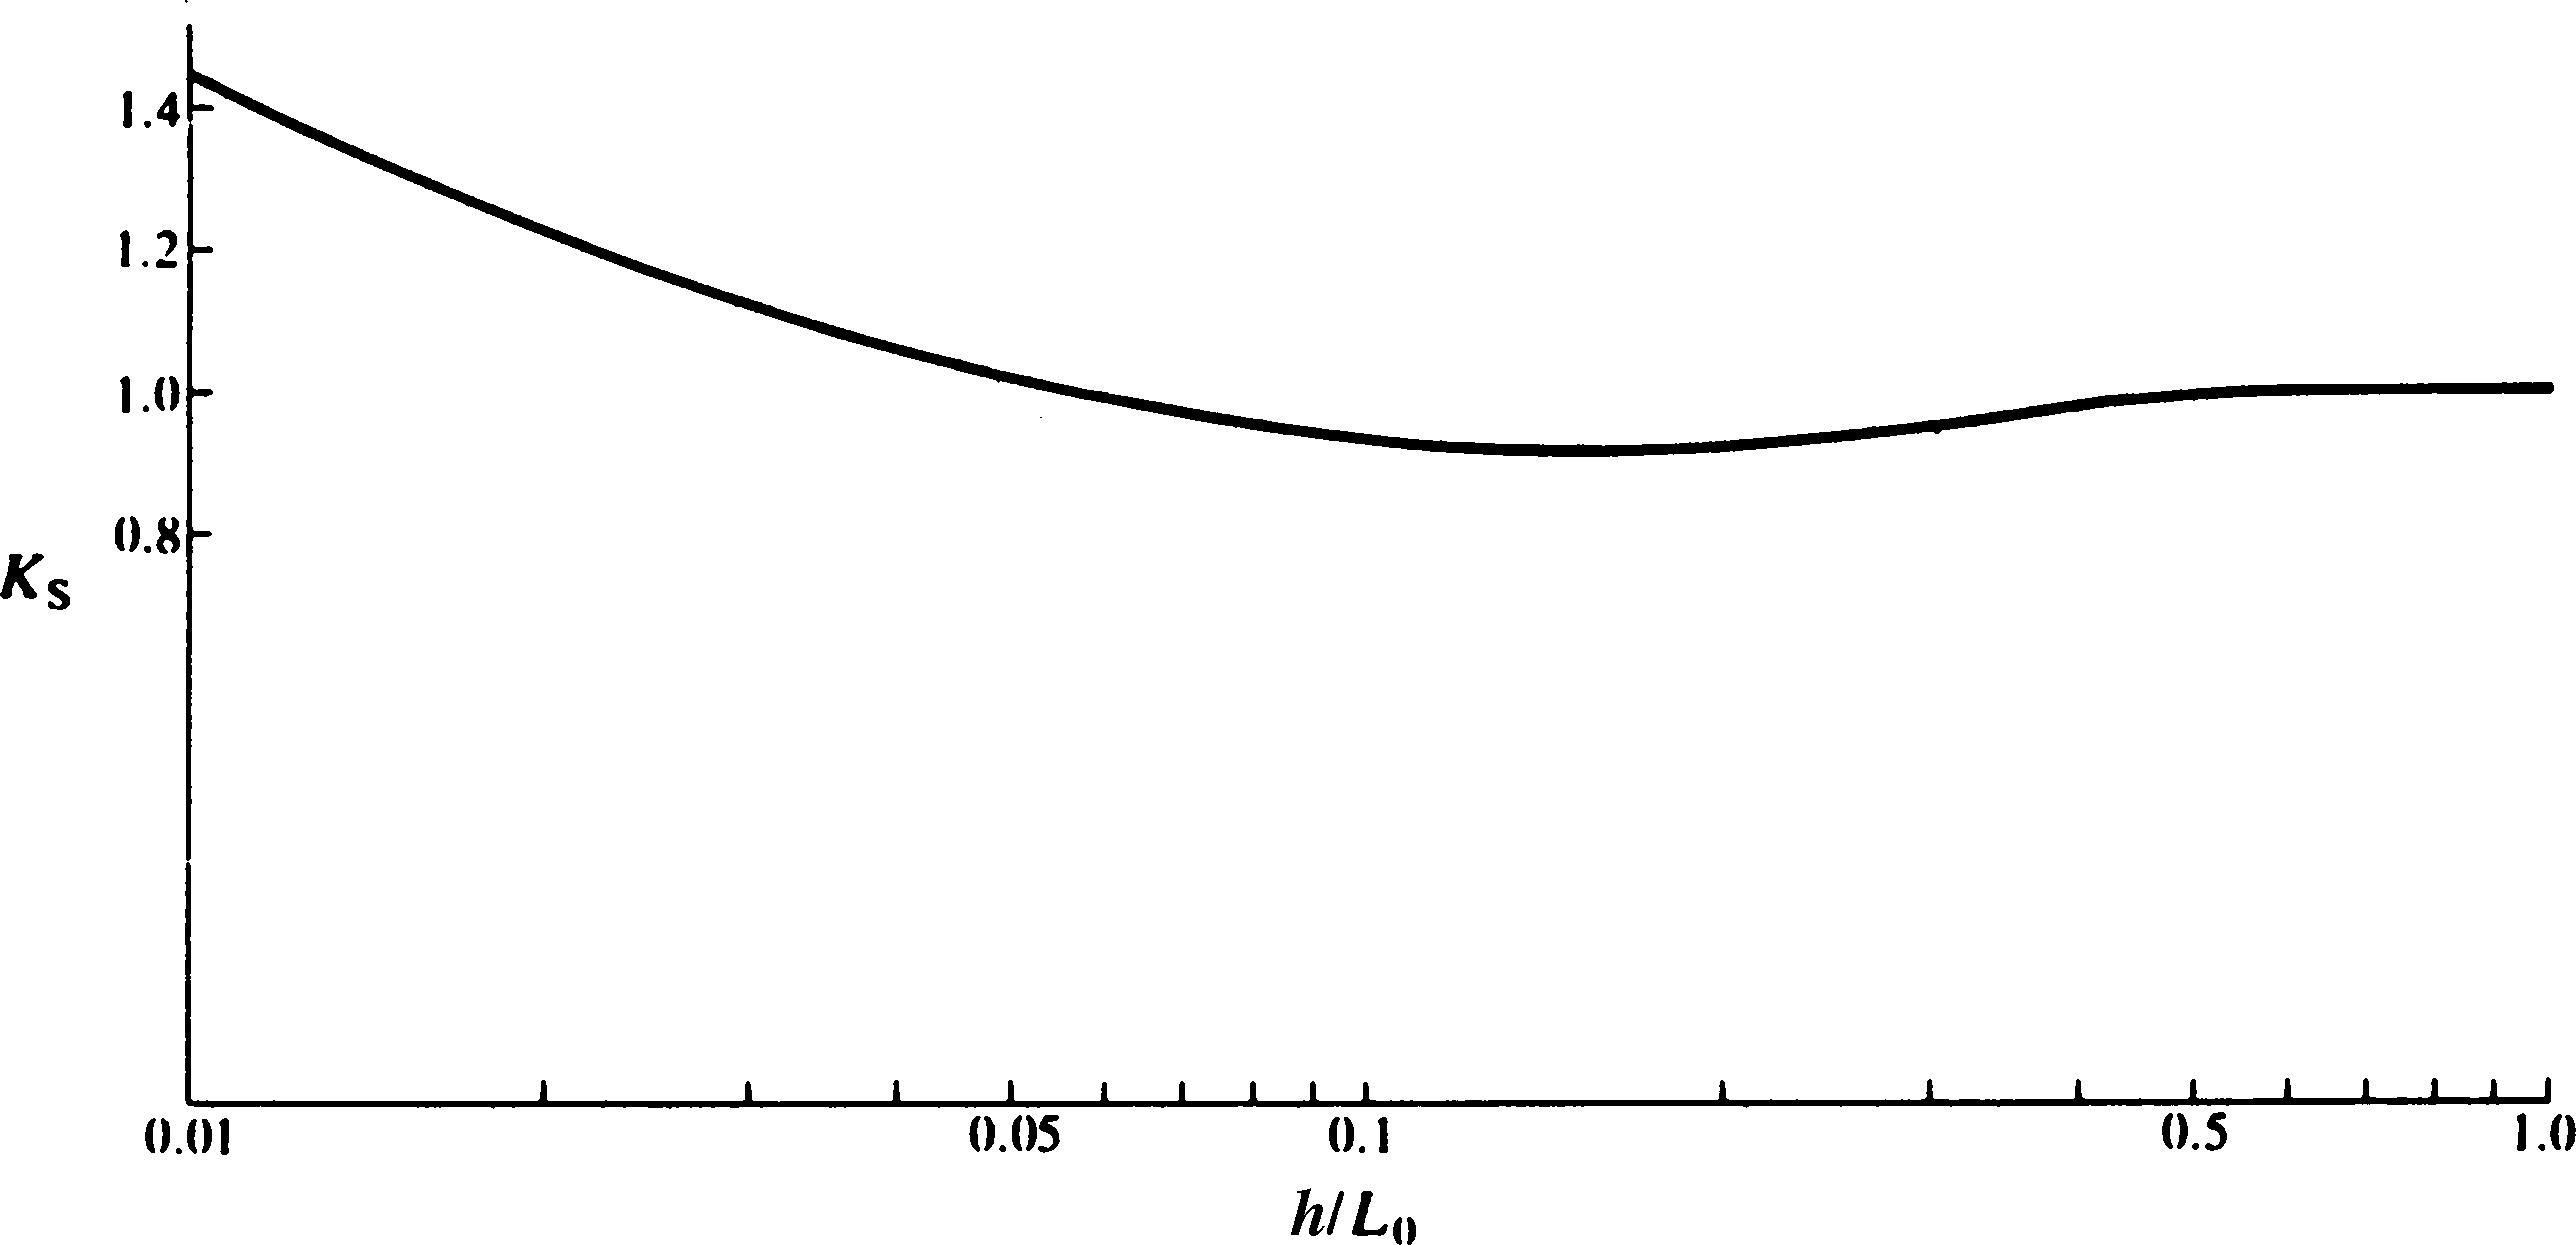
| 08:55, 6 June 2017 | ChadwickFig7.jpg (file) |  |
100 KB | Variation of the shoaling coefficient with depth. | 1 |
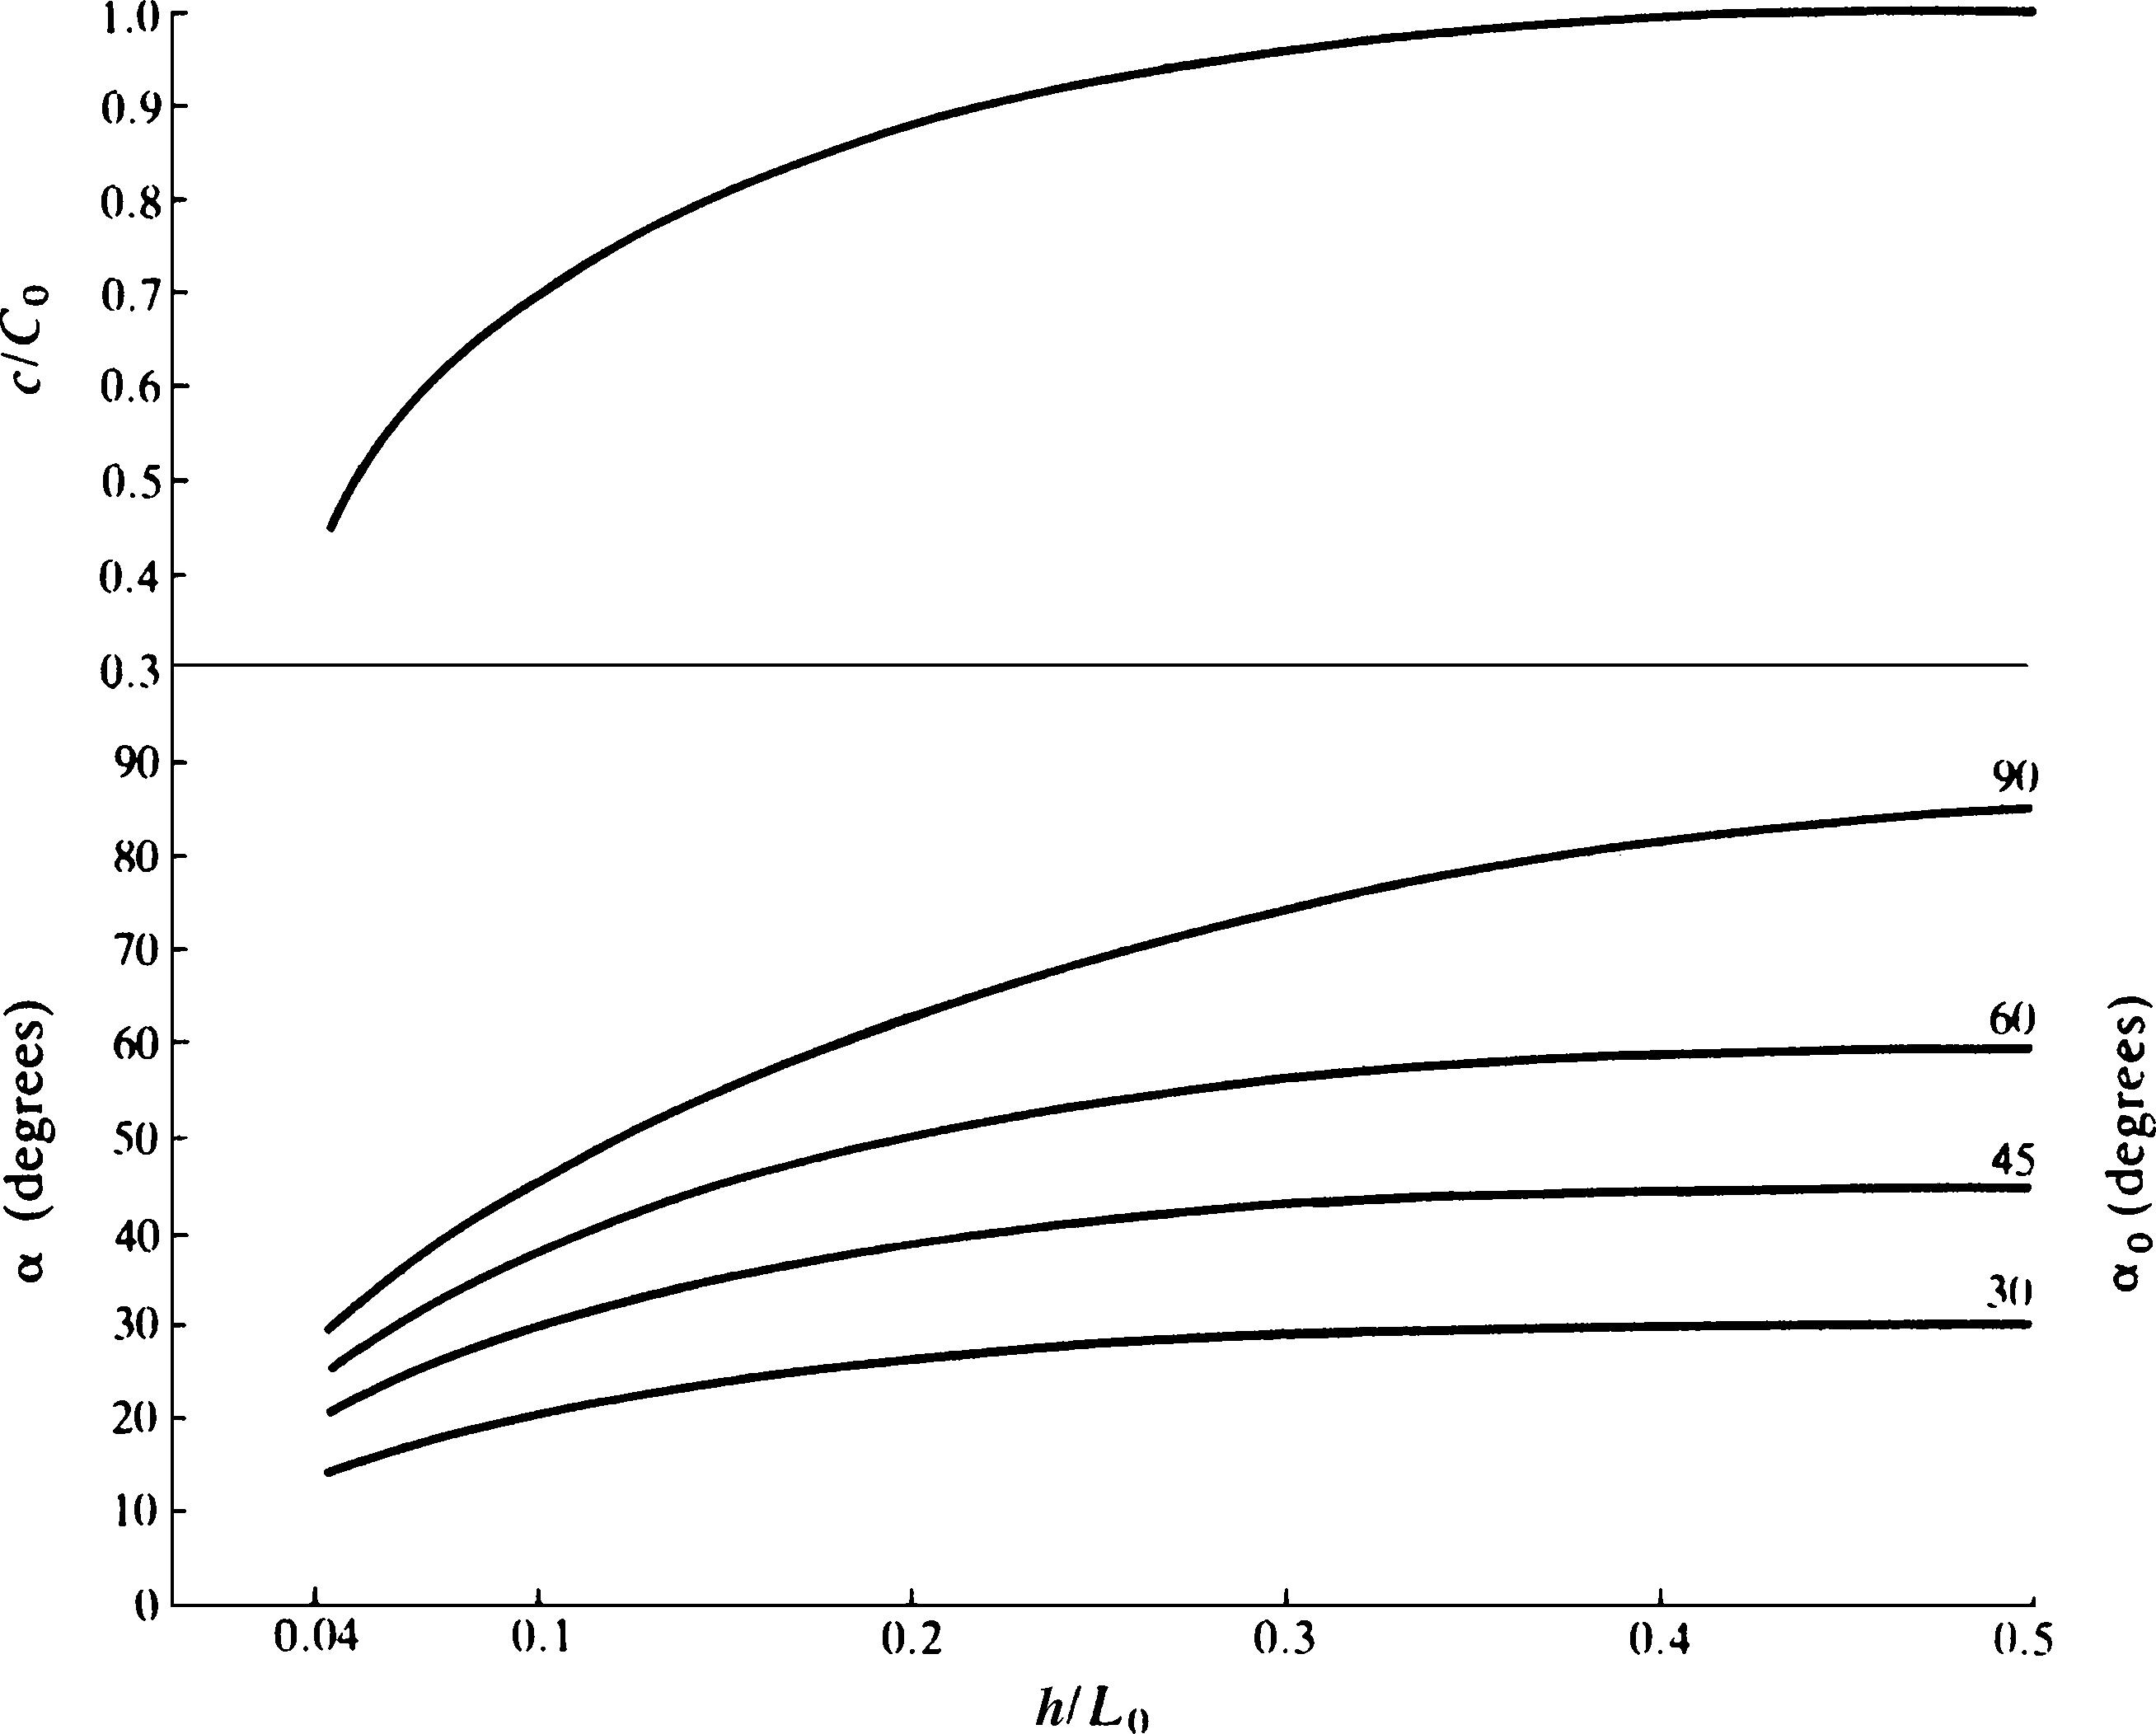
| 08:55, 6 June 2017 | ChadwickFig6.jpg (file) |  |
233 KB | Variations of wave celerity and angle with depth. | 1 |
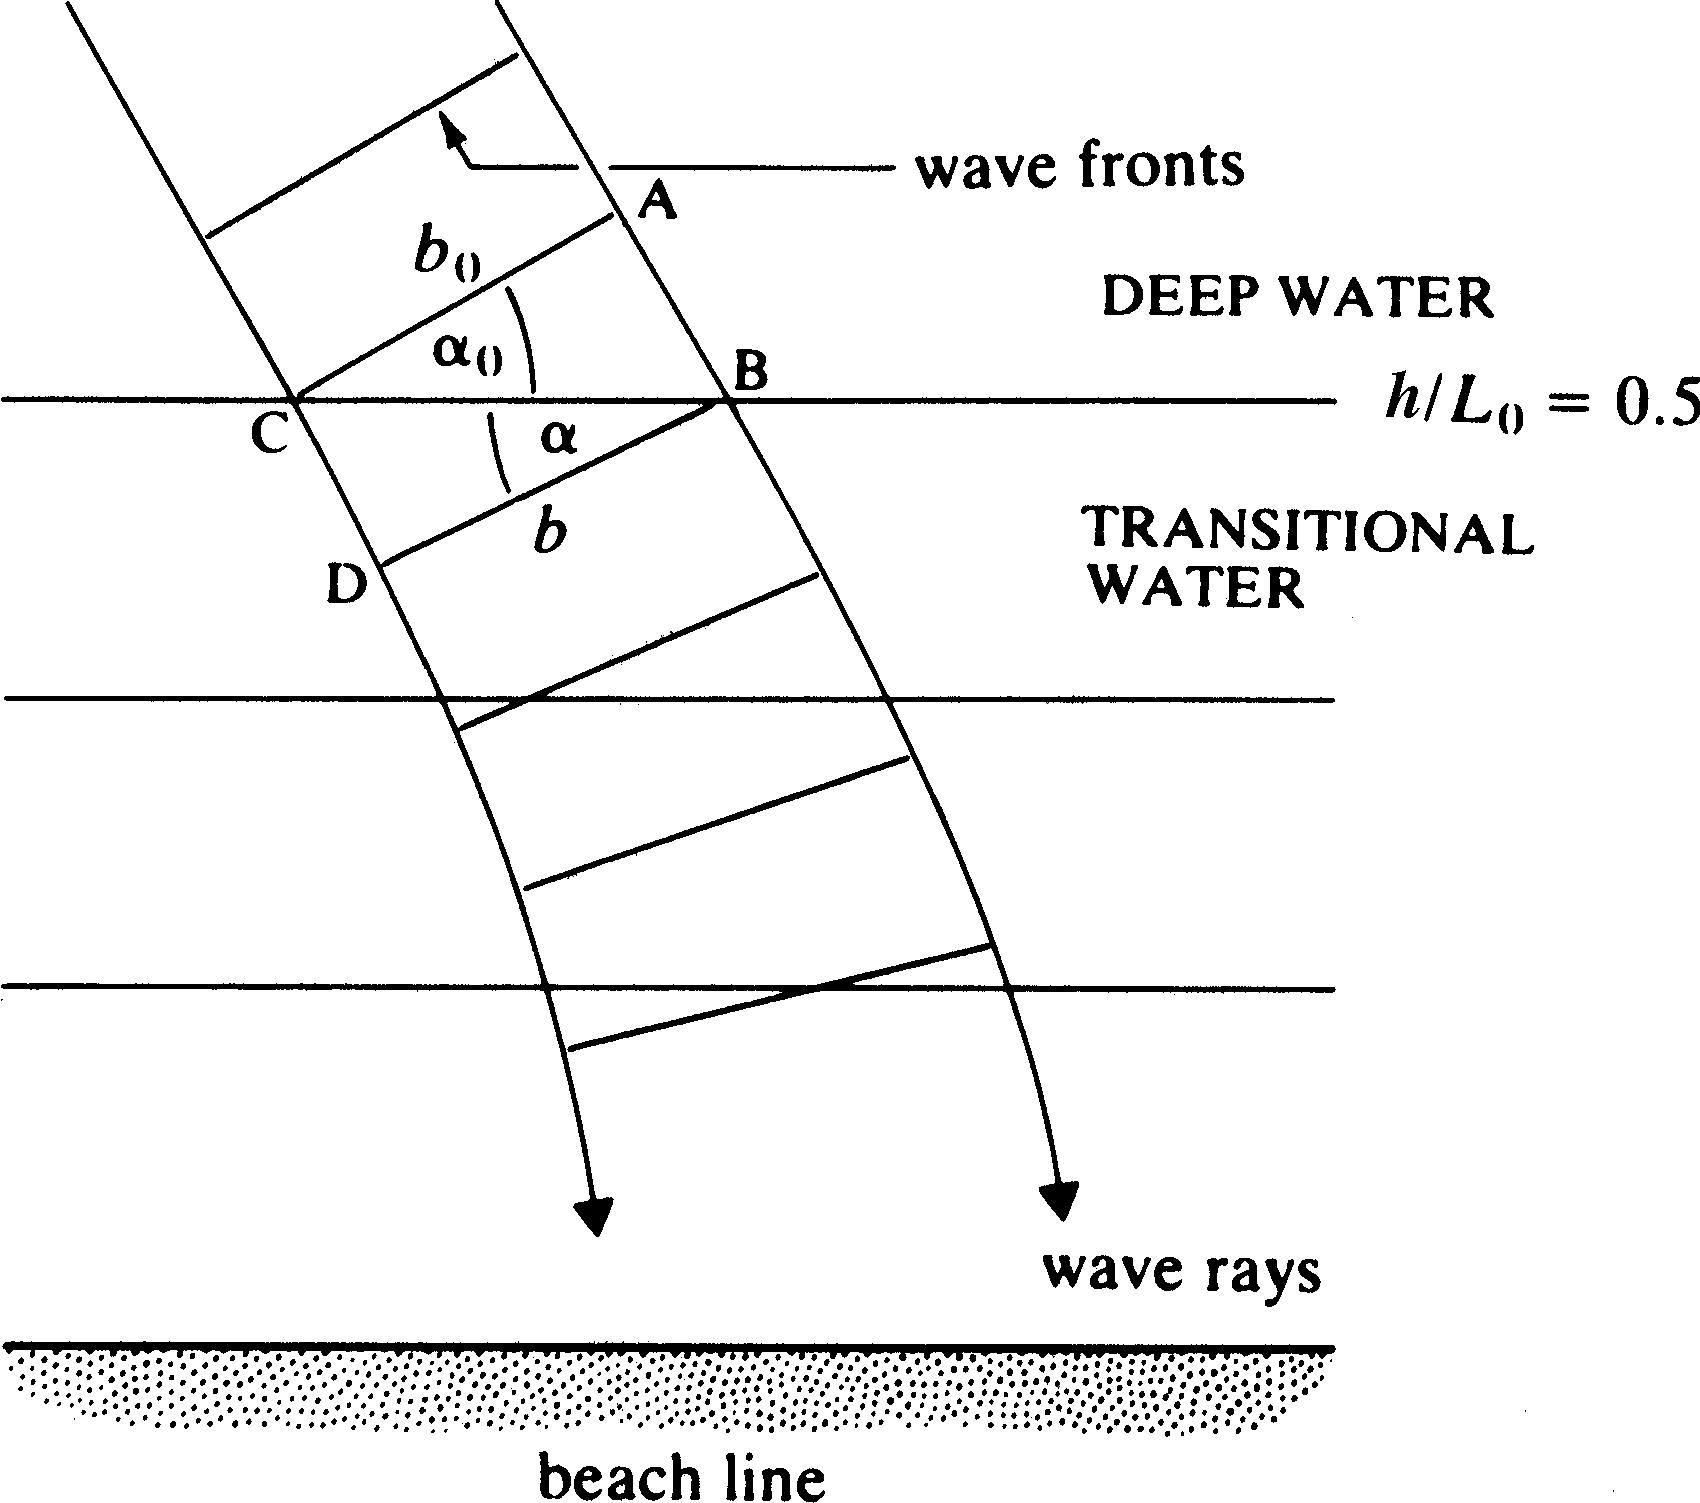
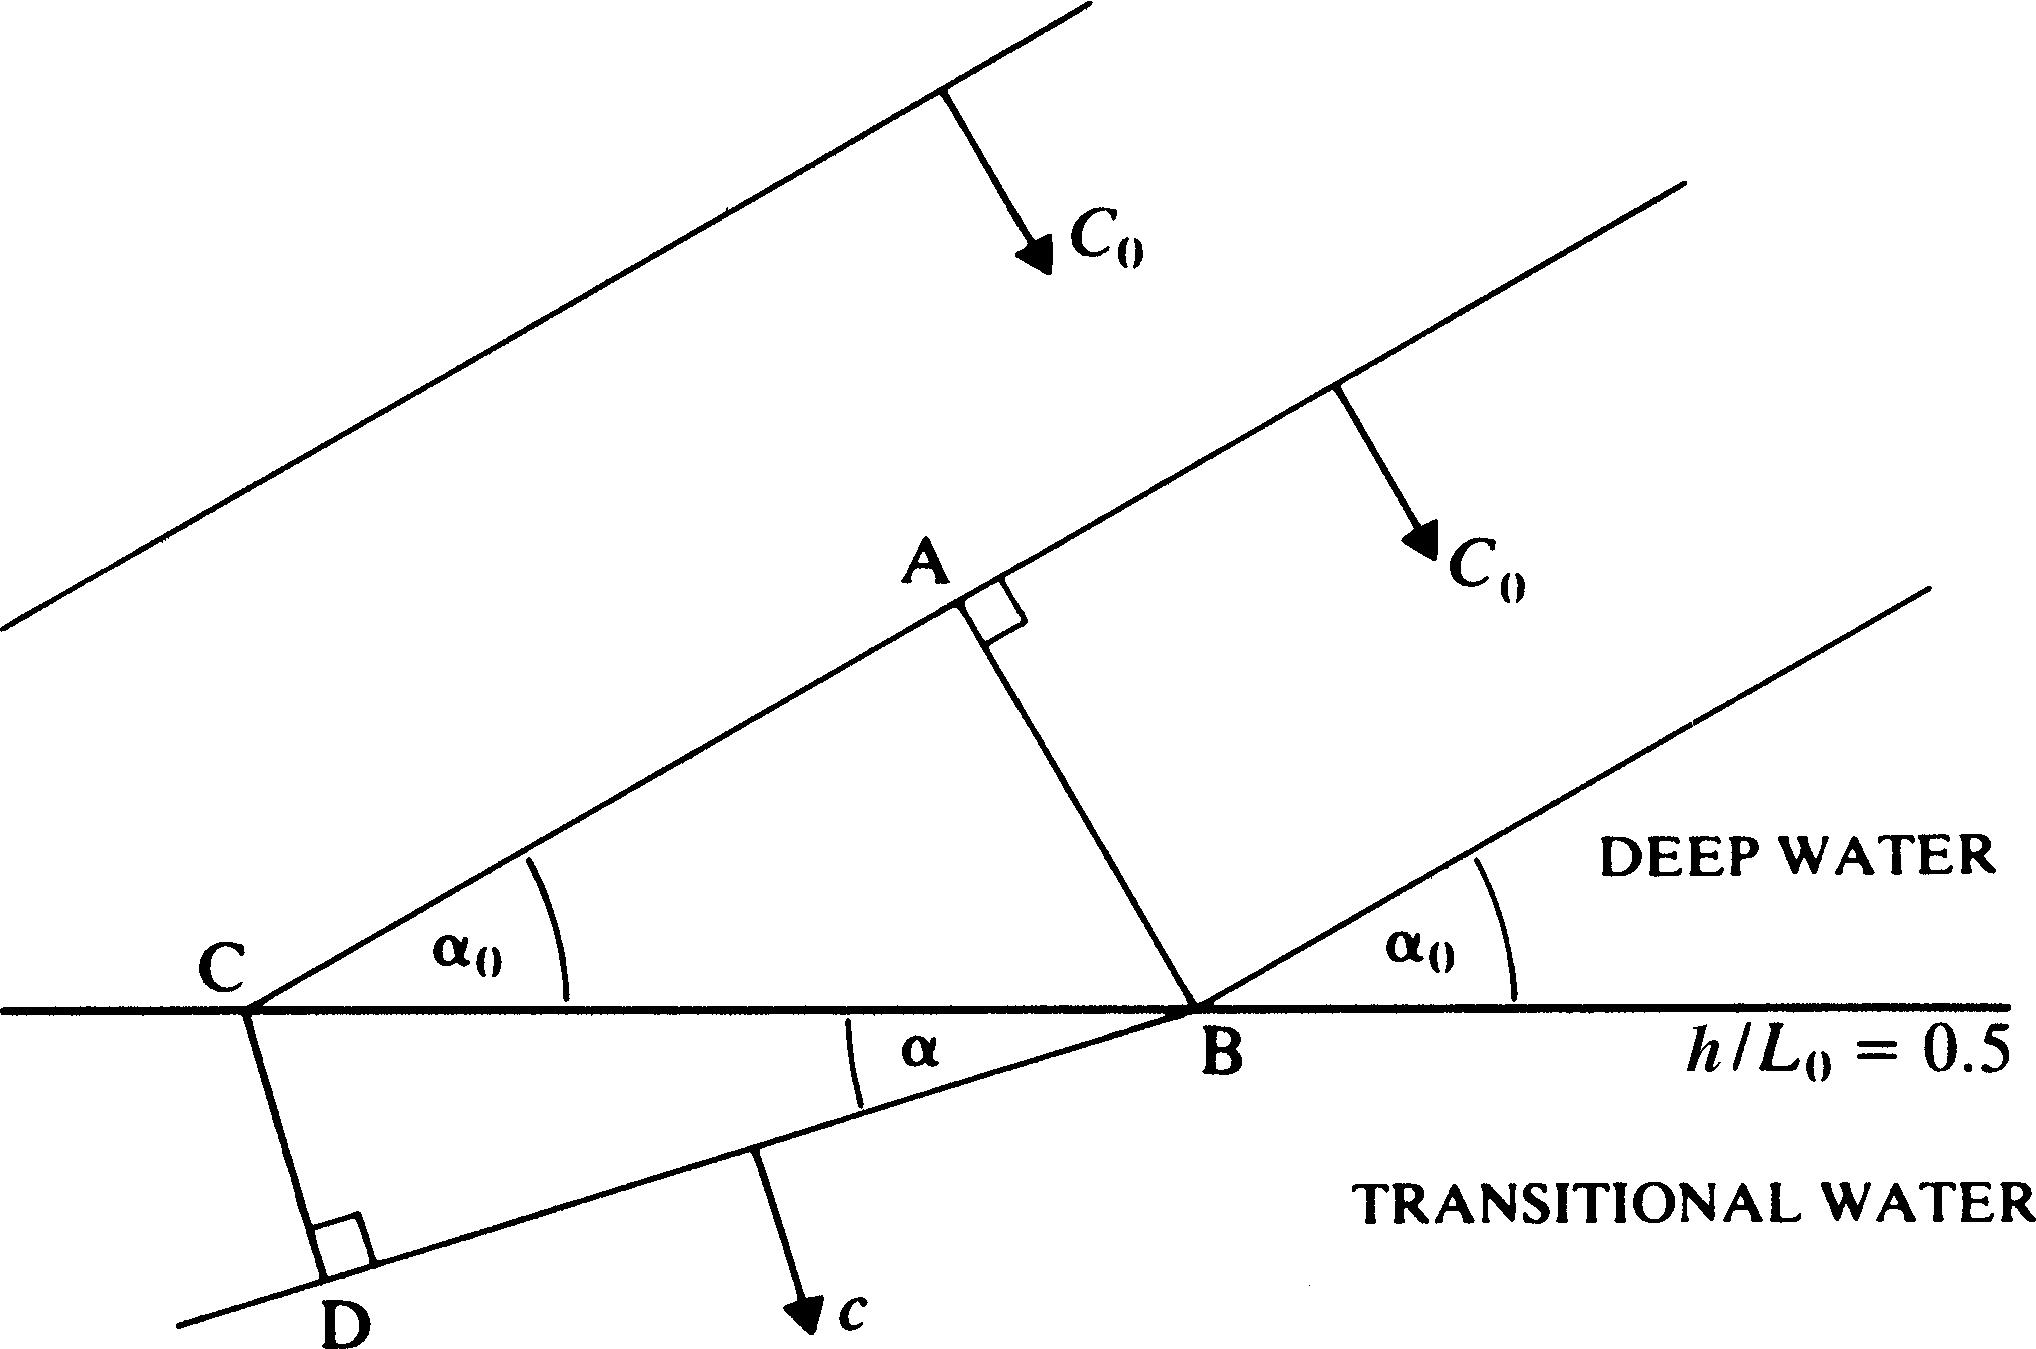
| 08:54, 6 June 2017 | ChadwickFig5.jpg (file) |  |
141 KB | Wave refraction. | 1 |
| 08:53, 6 June 2017 | ChadwickFig4.jpg (file) |  |
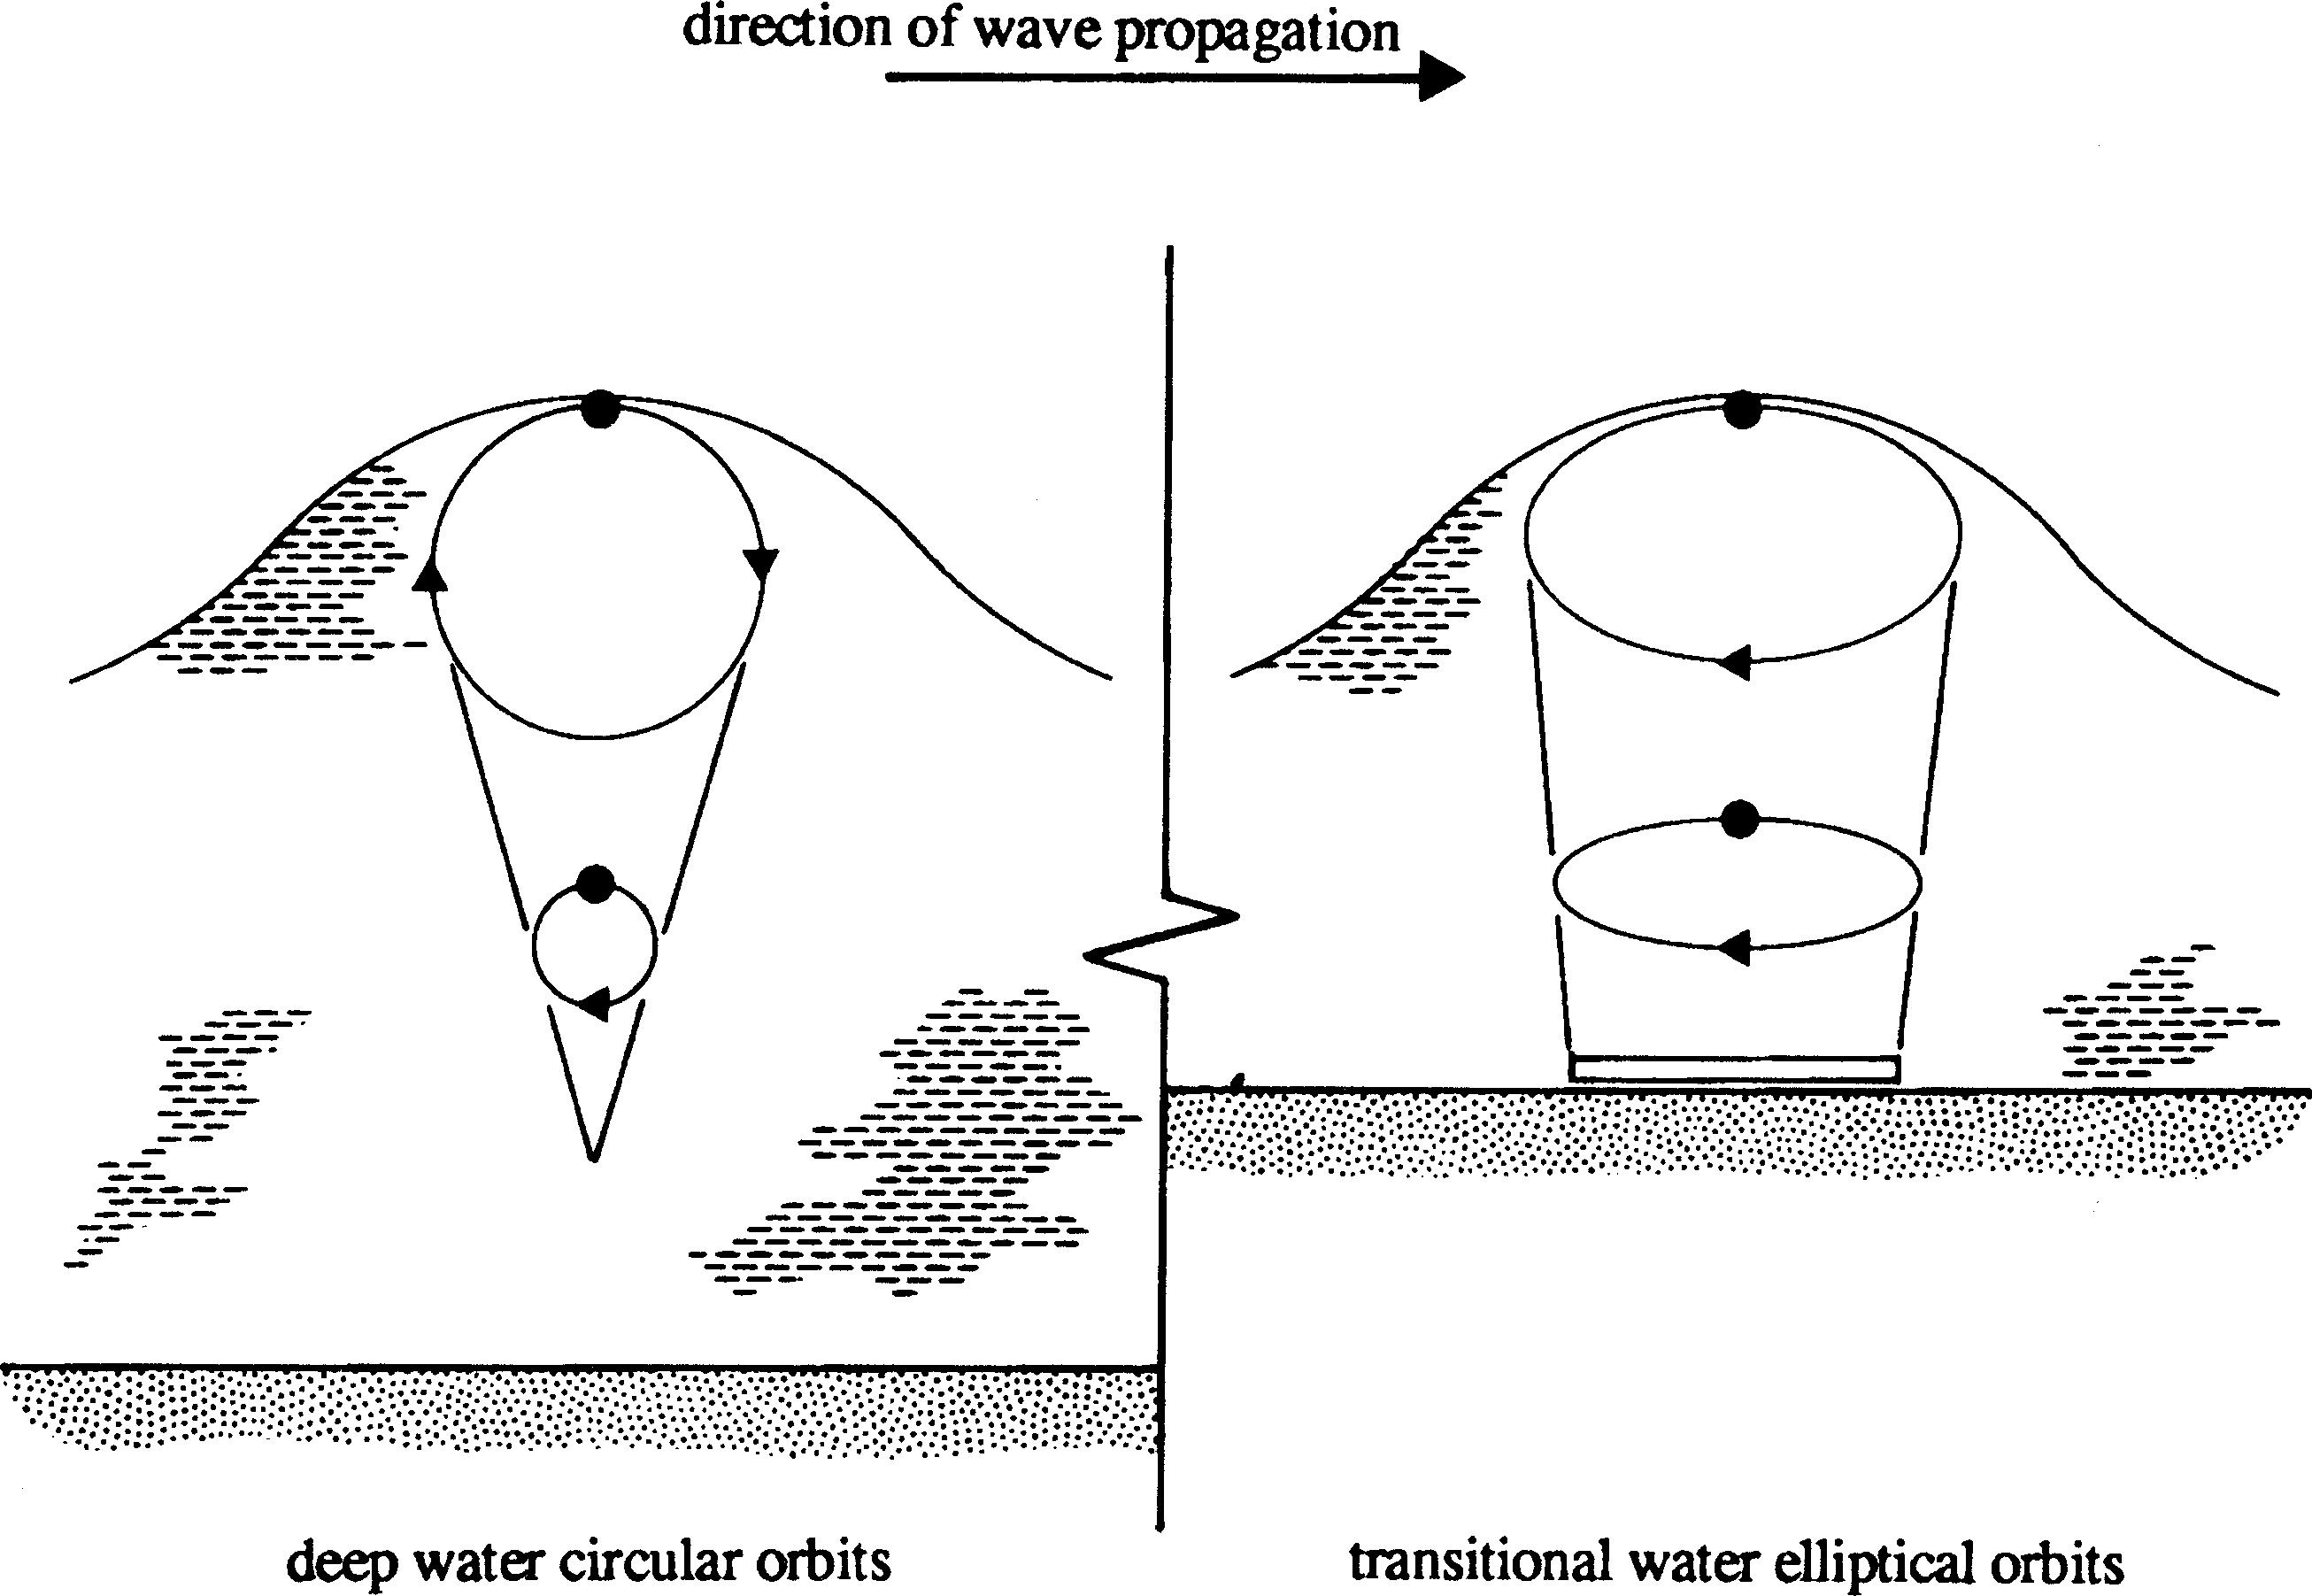
407 KB | Particle displacements for deep and transitional waves. | 1 |
| 08:52, 6 June 2017 | ChadwickFig3.jpg (file) |  |
11 KB | Definition sketch for a sinusoidal wave. | 1 |
| 08:52, 6 June 2017 | ChadwickFig2b.jpg (file) |  |
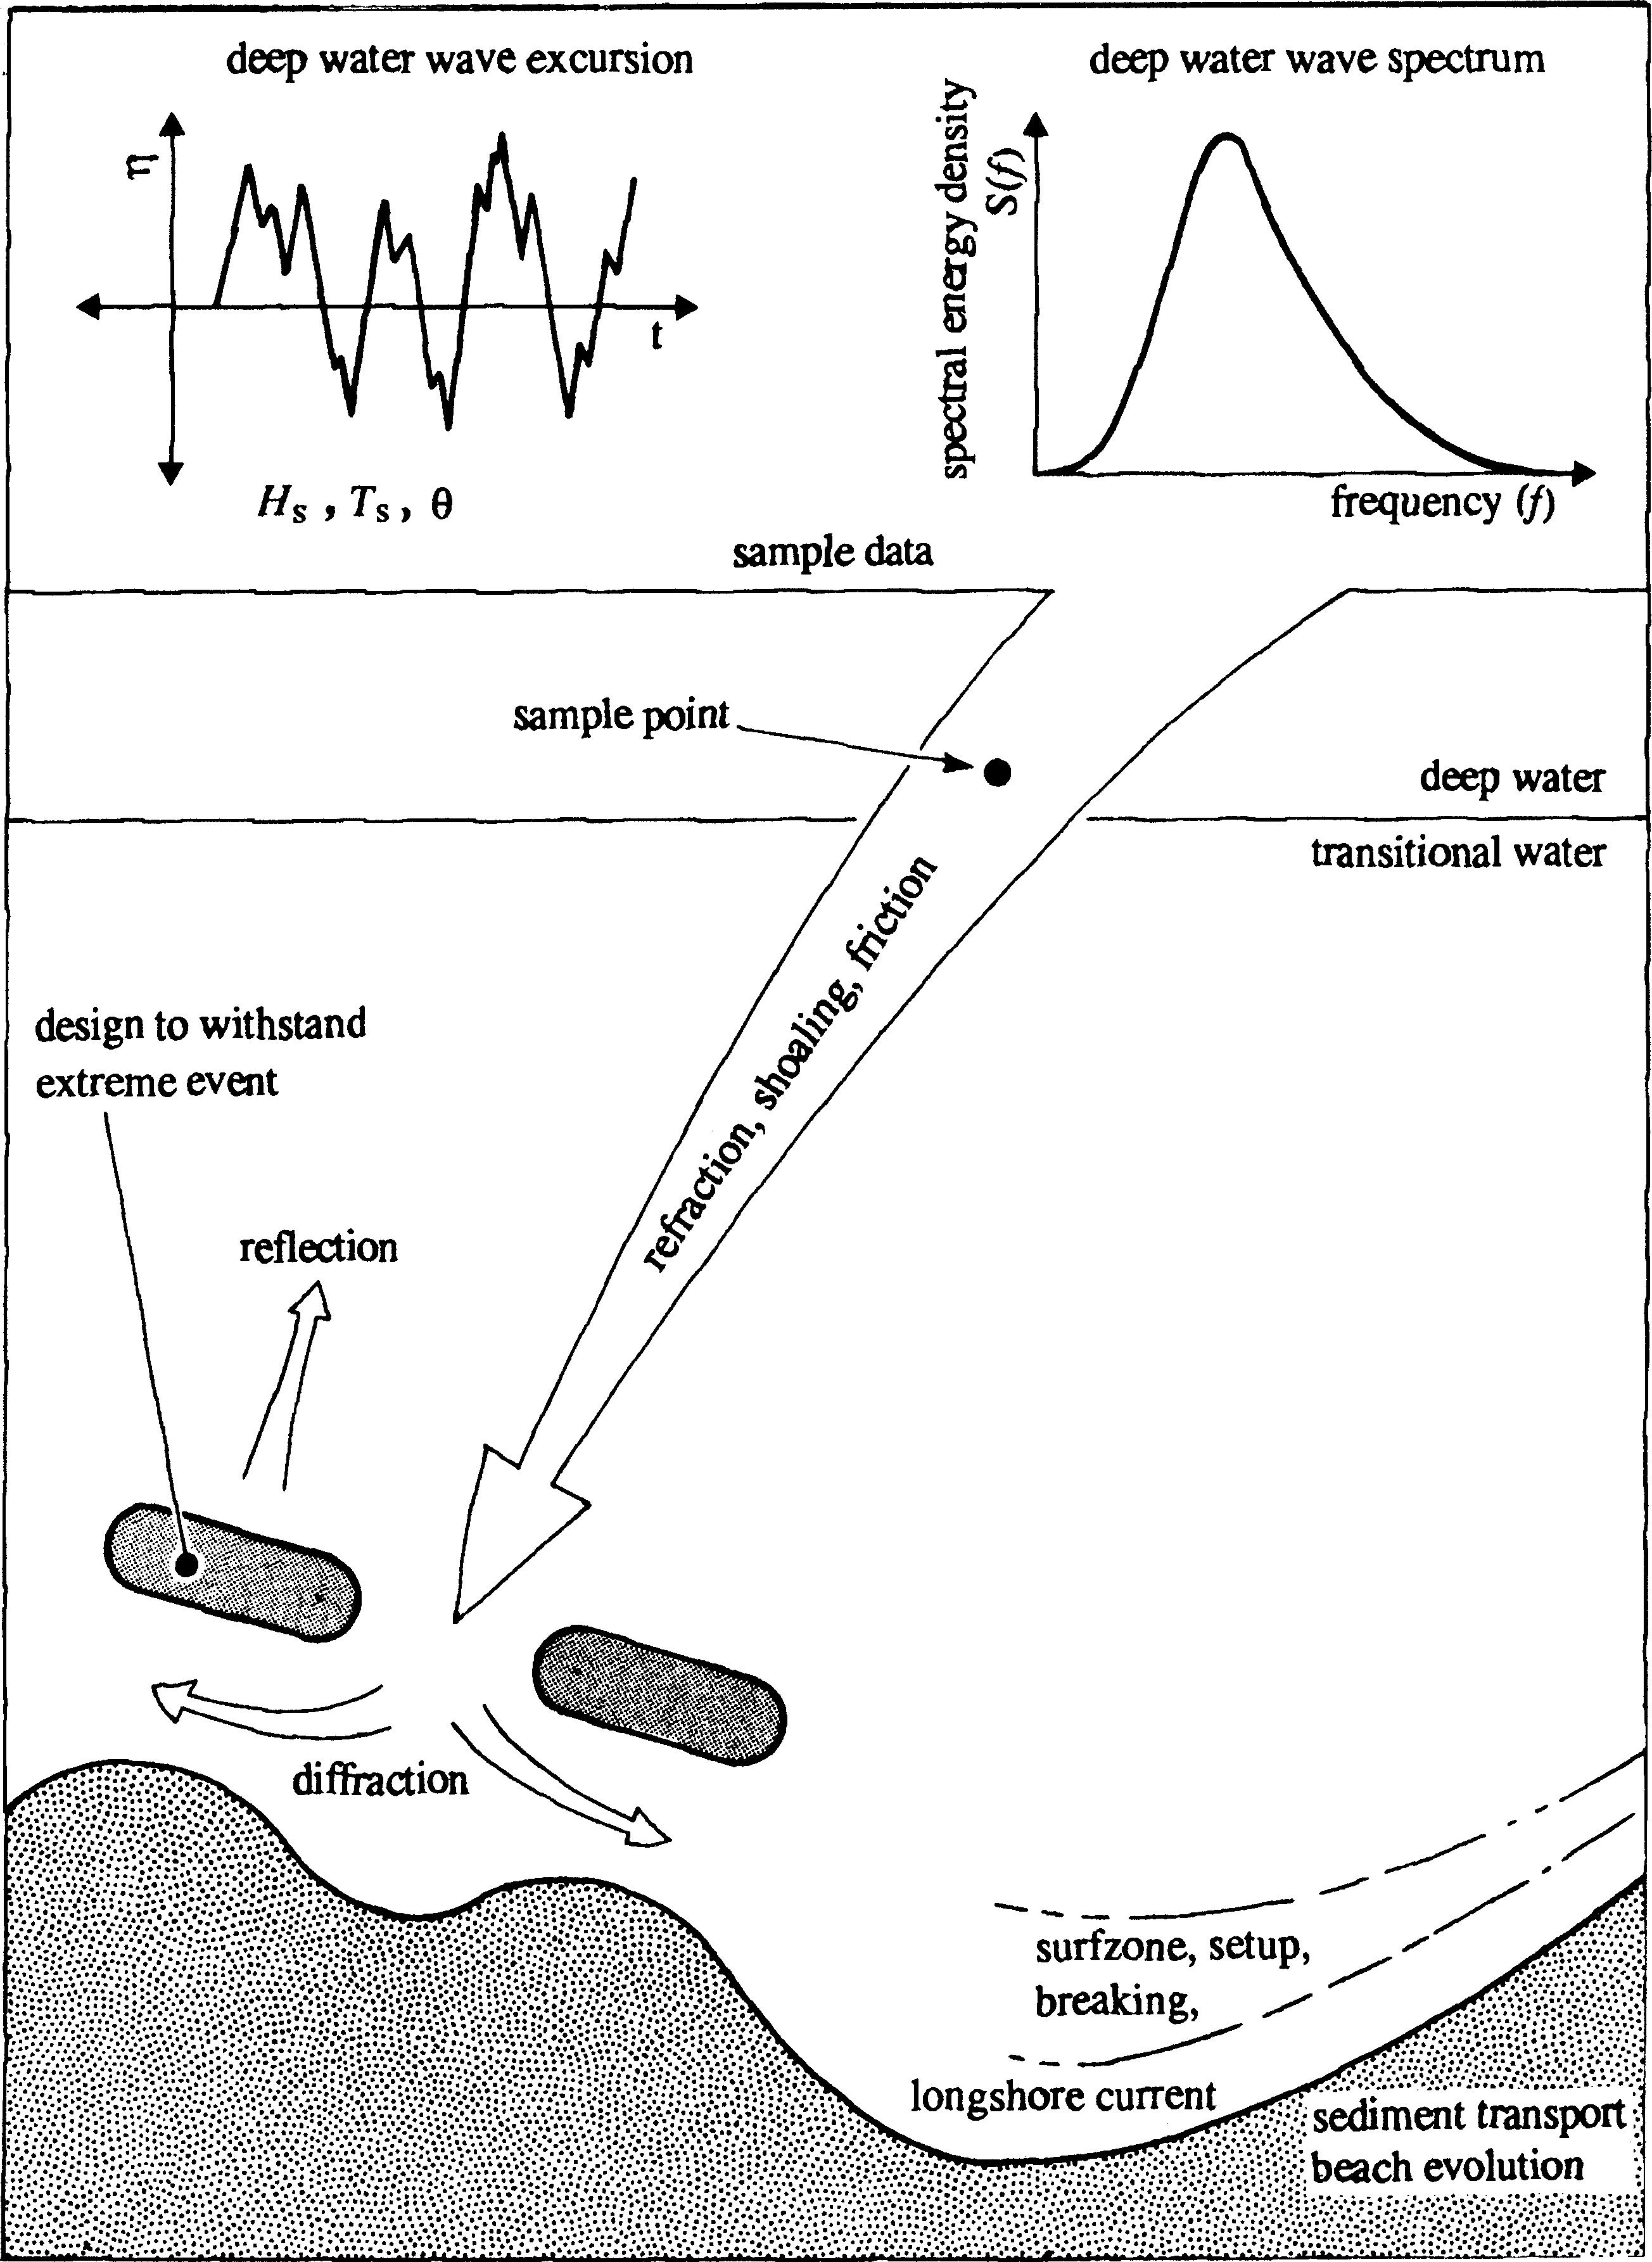
1.12 MB | Wave generation and dispersion. | 1 |
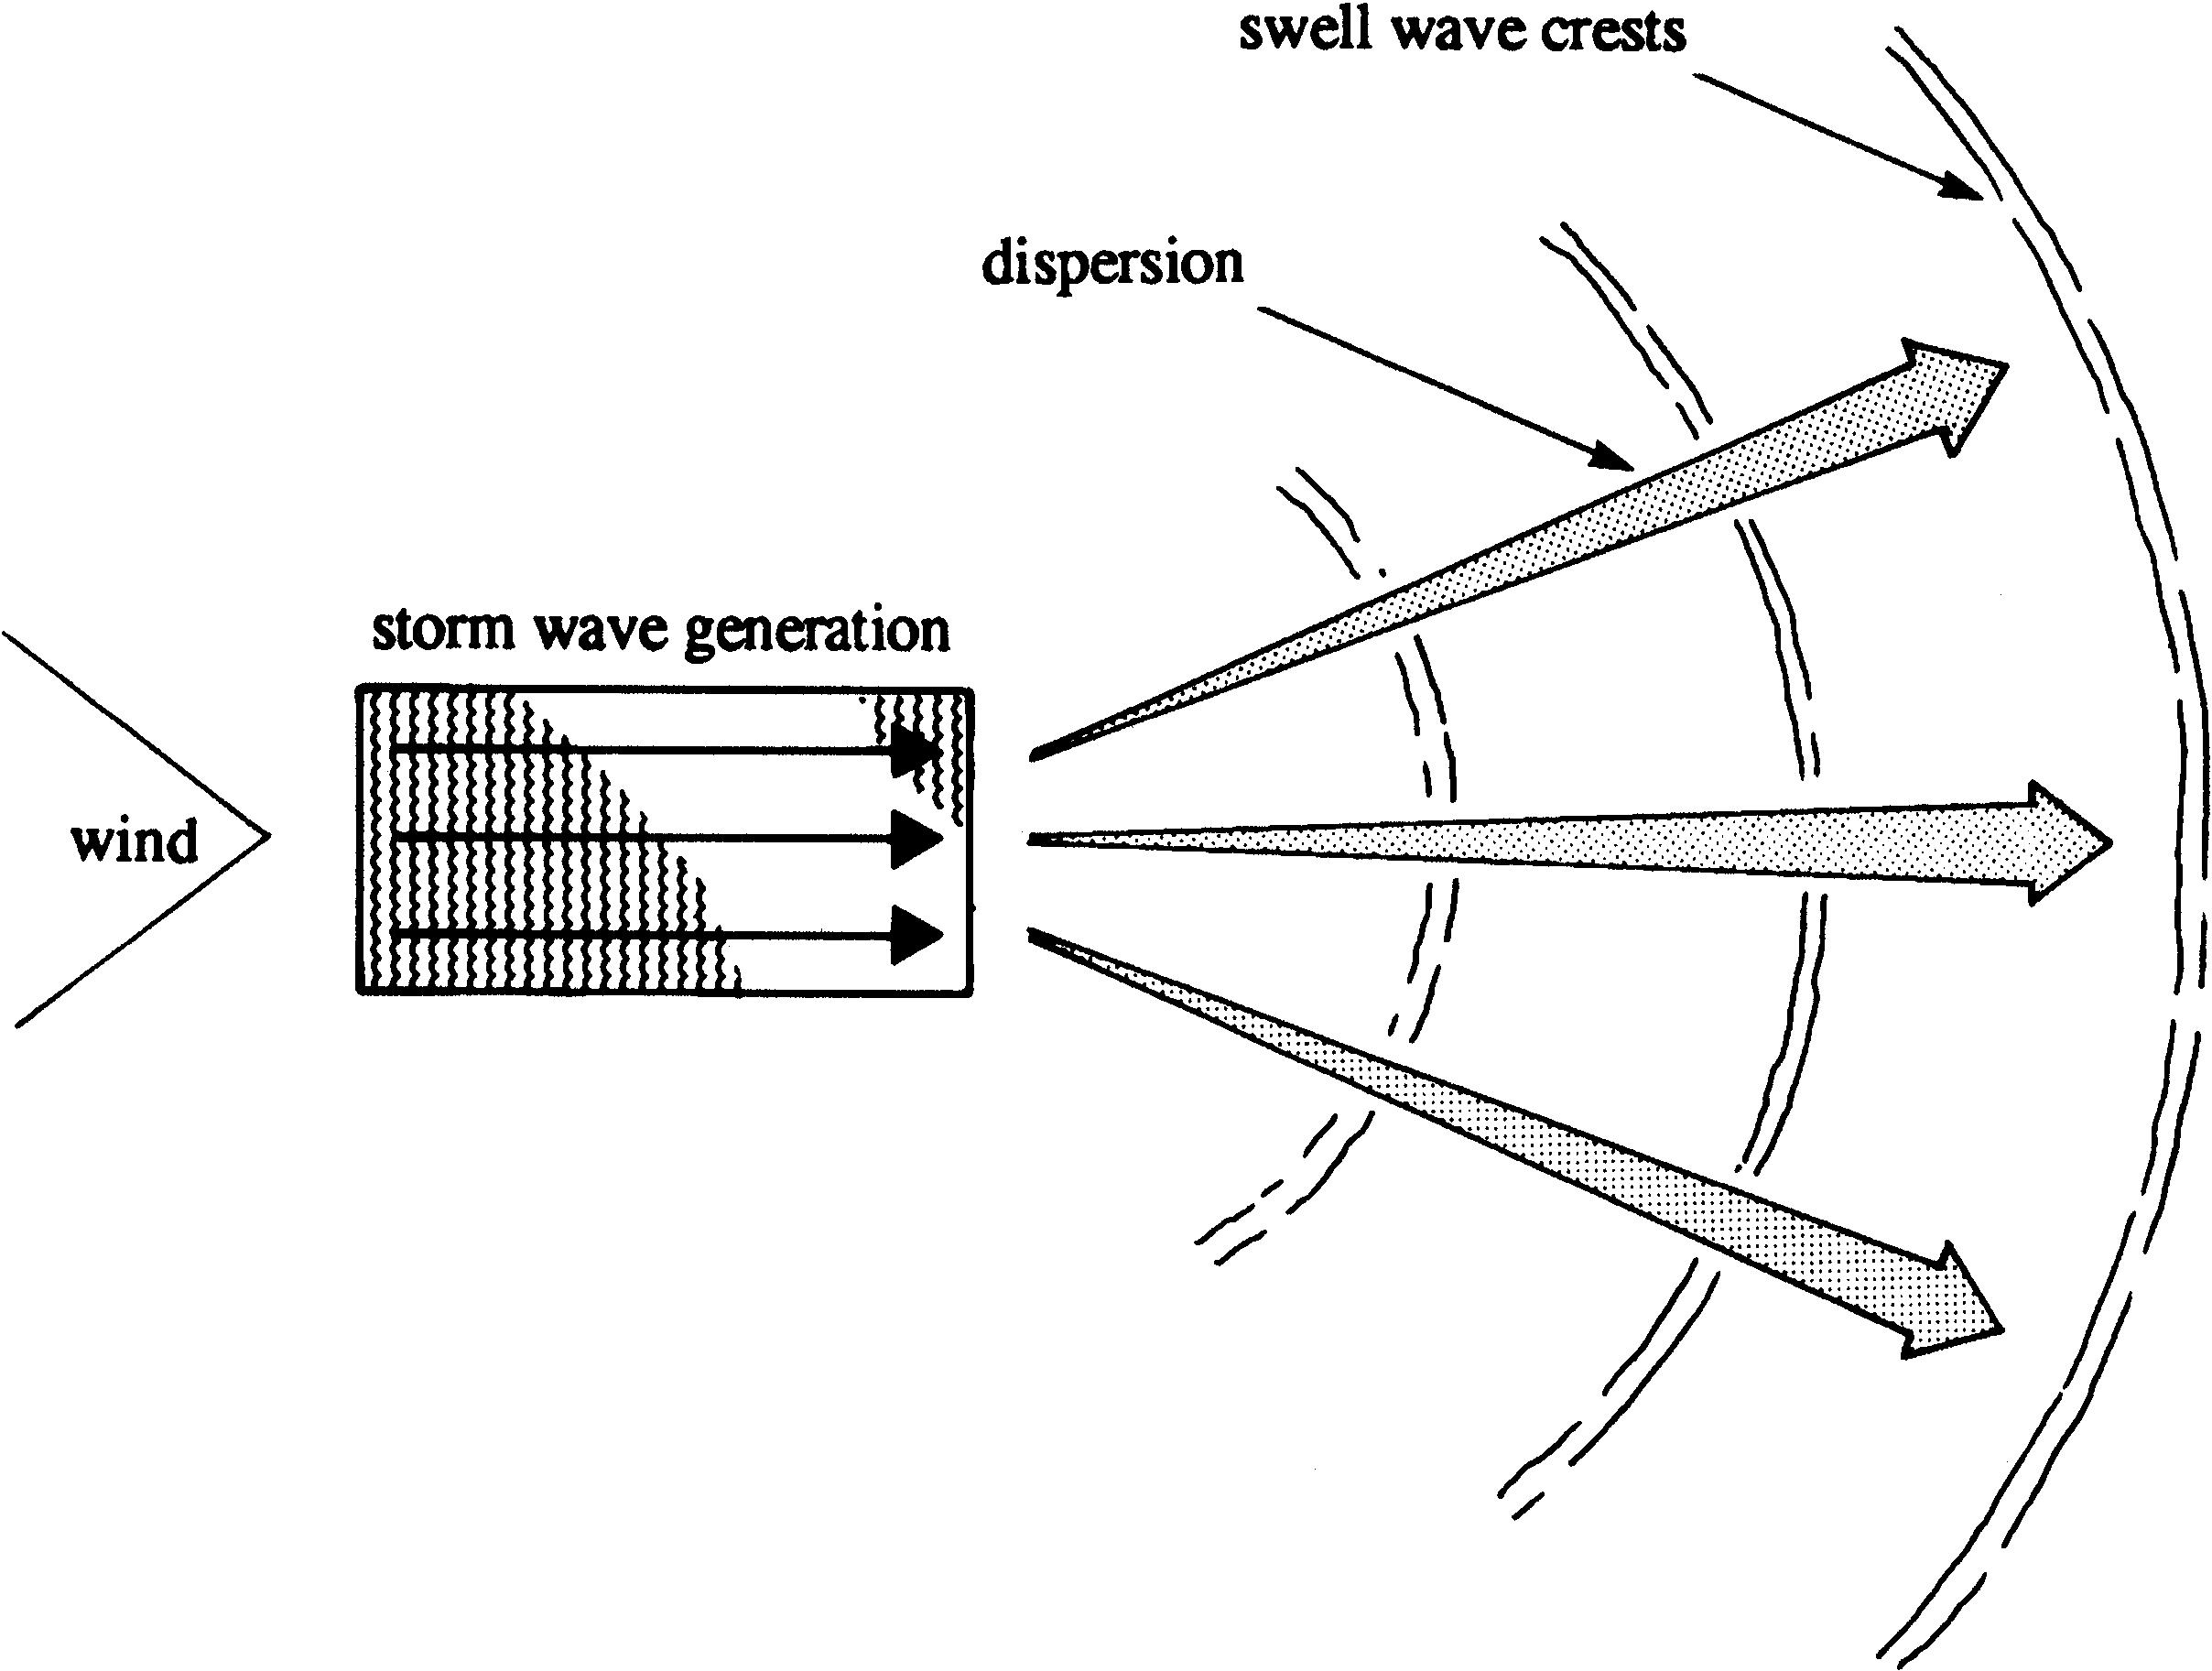
| 08:50, 6 June 2017 | ChadwickFig1.jpg (file) |  |
339 KB | Wave generation and dispersion. | 1 |
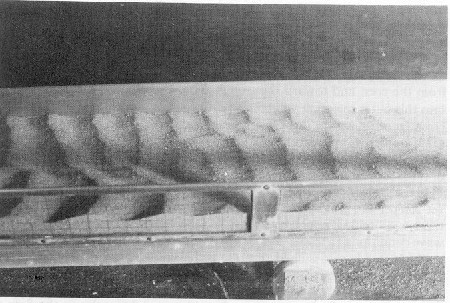
| 19:58, 5 June 2017 | BlondeauxFig7abc.jpg (file) | 70 KB | Left: 7a. Brick-pattern ripples observed during a laboratory experiment. Centre: 7b. Three-dimensional vortex ripples observed during a laboratory experiment (7a and 7b courtesy of John F.A. Sleath).Right: 7c. Tile ripples (adapted from Allen<ref name=... | 1 | |
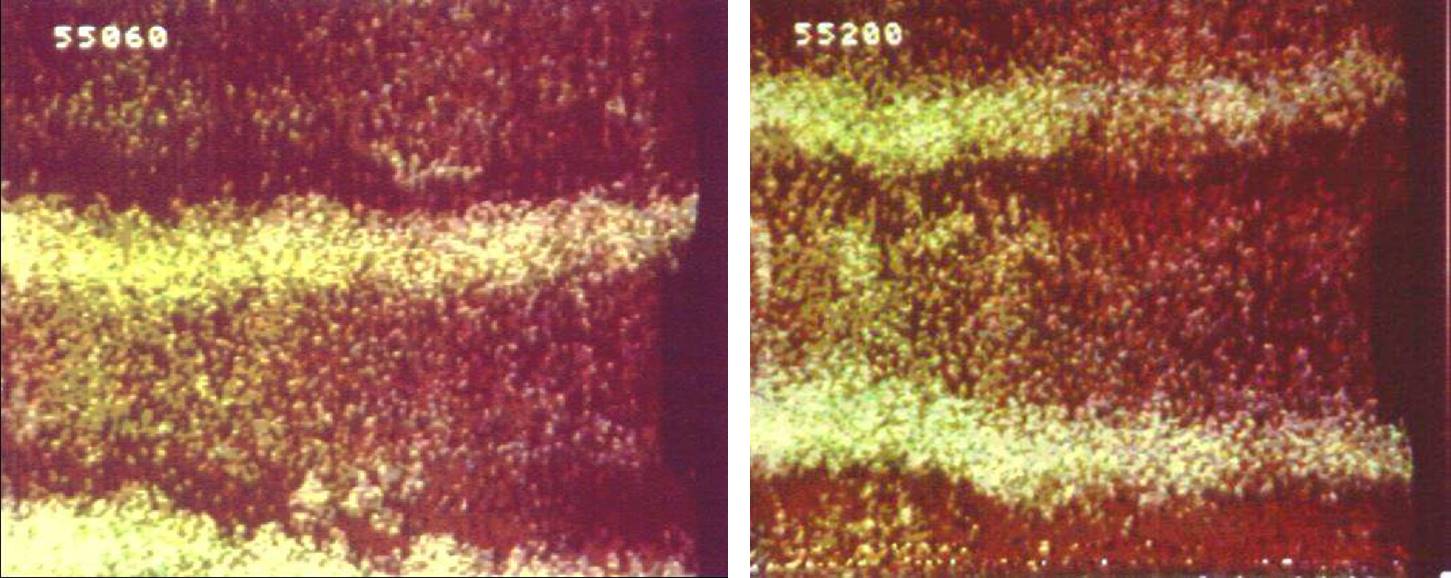
| 13:32, 5 June 2017 | BlondeauxFig10.jpg (file) |  |
121 KB | The yellow sediment grains are coarser that the red sediments and pile up at the crests of the ripples which are generated in a U-tube by an oscillatory flow. The figure shows a top view of the bottom at two different phases of the cycle (adapted from... | 1 |
| 13:30, 5 June 2017 | BlondeauxFig9.jpg (file) |  |
139 KB | Tile ripples. Reproduced from Allen J.R.L. (1984). Sedimentary structures, their character and physical basis. Elsevier, figure 11.12. | 1 |
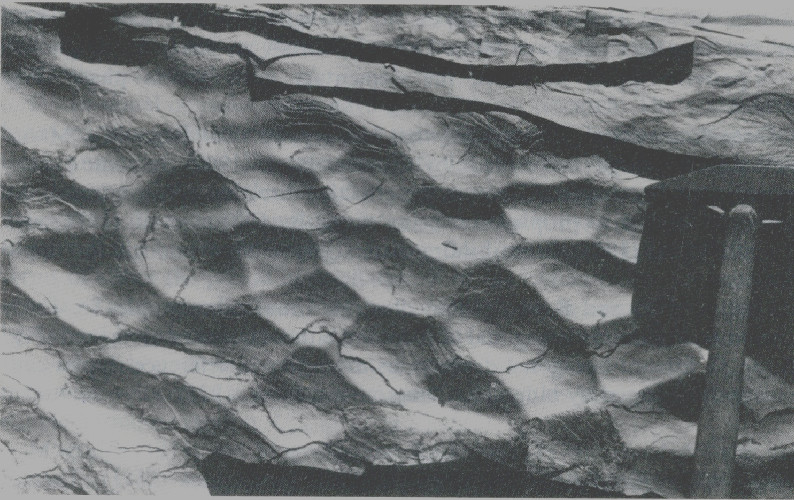
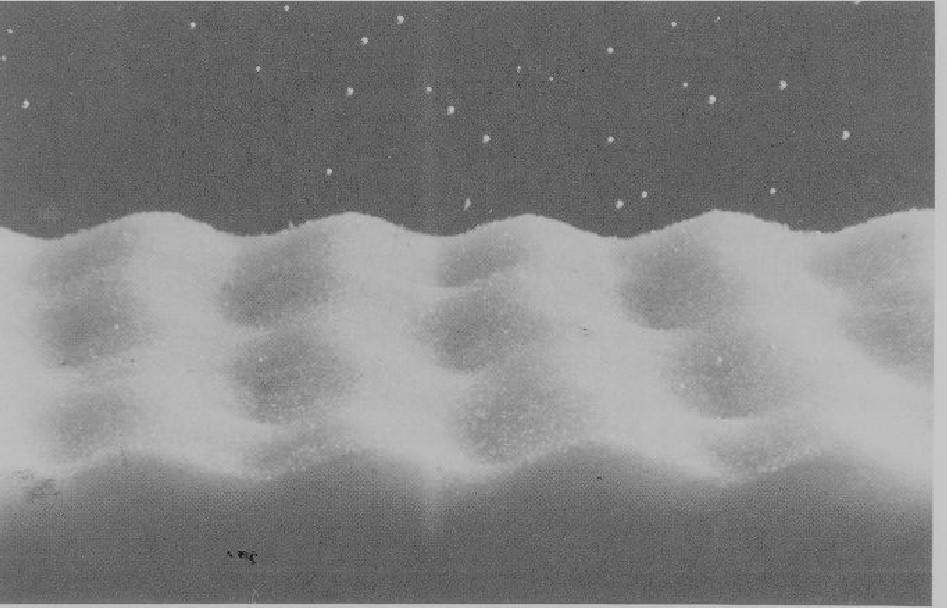
| 13:28, 5 June 2017 | BlondeauxFig8.jpg (file) |  |
57 KB | Three-dimensional vortex ripples observed during a laboratory experiment (courtesy of John F.A. Sleath). | 1 |
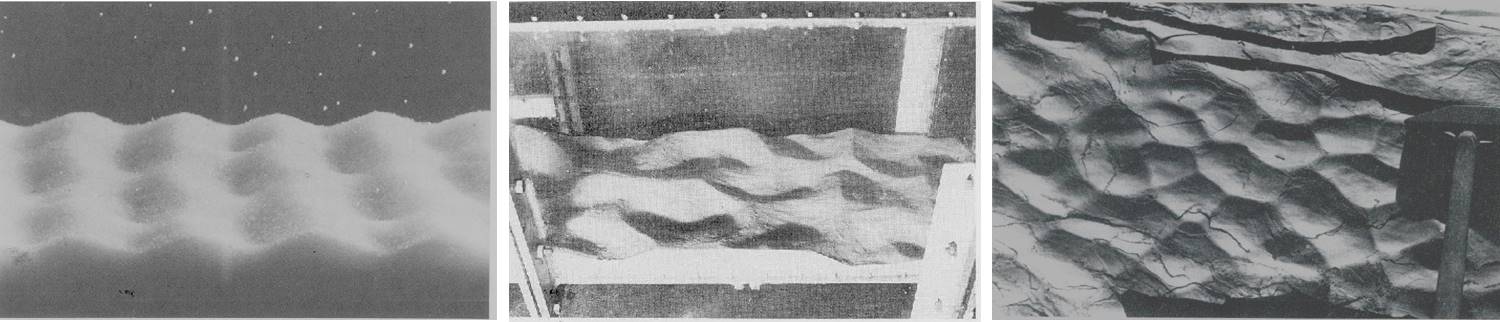
| 13:27, 5 June 2017 | BlondeauxFig7.jpg (file) |  |
128 KB | Brick-pattern ripples observed during a laboratory experiment (courtesy of John F.A. Sleath). | 1 |
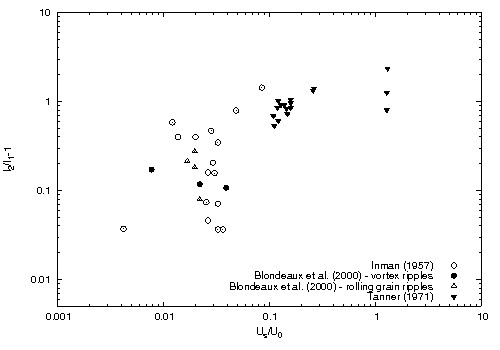
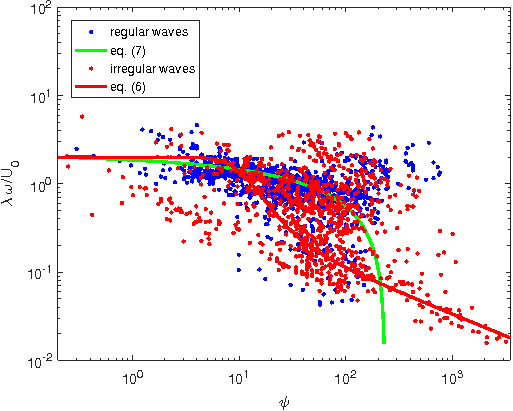
| 13:26, 5 June 2017 | BlondeauxFig6.jpg (file) |  |
20 KB | Ripple symmetry index plotted versus the ratio between the mass-transport velocity and the maximum near-bed orbital velocity. | 1 |
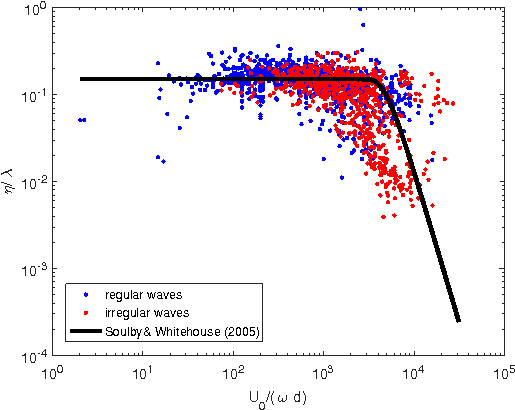
| 13:25, 5 June 2017 | BlondeauxFig5.jpg (file) |  |
55 KB | Comparison between predicted (line) and observed (points) ripple steepnesses. | 1 |
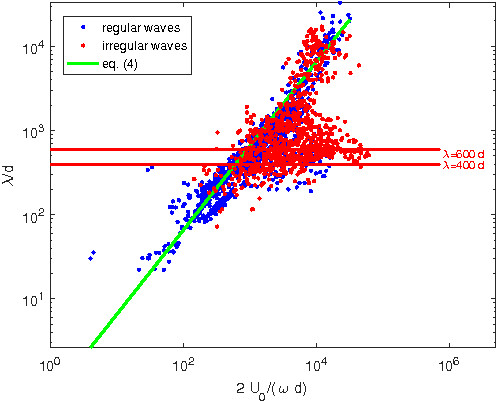
| 13:25, 5 June 2017 | BlondeauxFig4.jpg (file) |  |
76 KB | Comparison between predicted (lines) and observed (points) ripple wavelengths. | 1 |
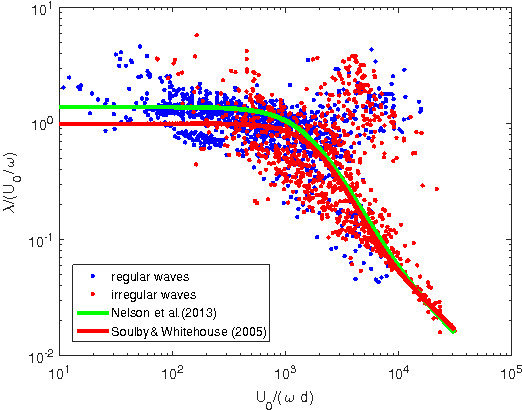
| 13:24, 5 June 2017 | BlondeauxFig3.jpg (file) |  |
51 KB | Comparison between predicted (lines) and observed (points) ripple wavelengths. | 1 |
| 13:24, 5 June 2017 | BlondeauxFig2.jpg (file) |  |
78 KB | Comparison between predicted (lines) and observed (points) ripple wavelengths. | 1 |
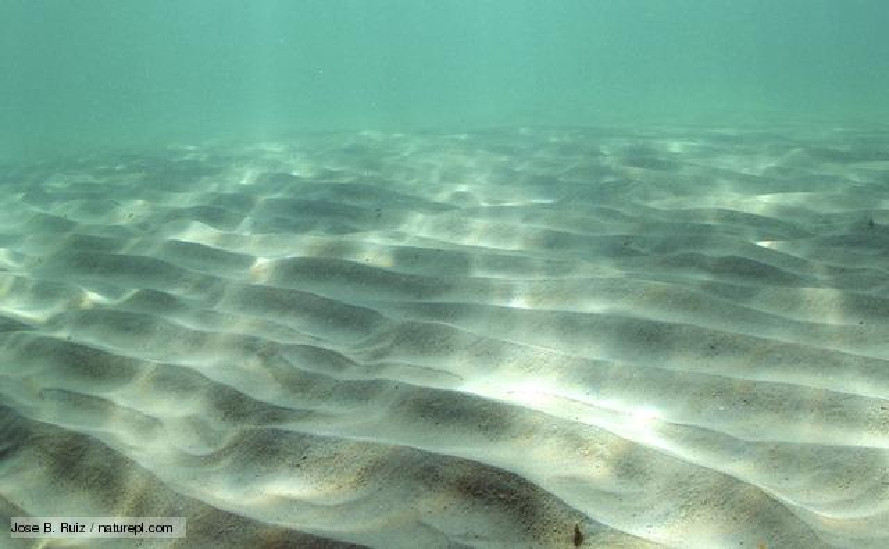
| 13:23, 5 June 2017 | BlondeauxFig1.jpg (file) |  |
94 KB | Ripple marks in the Mediterranean Sea. Courtesy of José B. Ruiz. | 1 |