File list
This special page shows all uploaded files.
| Date | Name | Thumbnail | Size | Description | Versions |
|---|---|---|---|---|---|
| 18:32, 18 February 2023 | TideEstuary.jpg (file) |  |
85 KB | Schematic plan view of a tide-dominated estuary. | 1 |
| 18:31, 18 February 2023 | TideRiverEstuary.jpg (file) |  |
115 KB | Schematic plan view of a tide- and river-dominated estuary. | 1 |
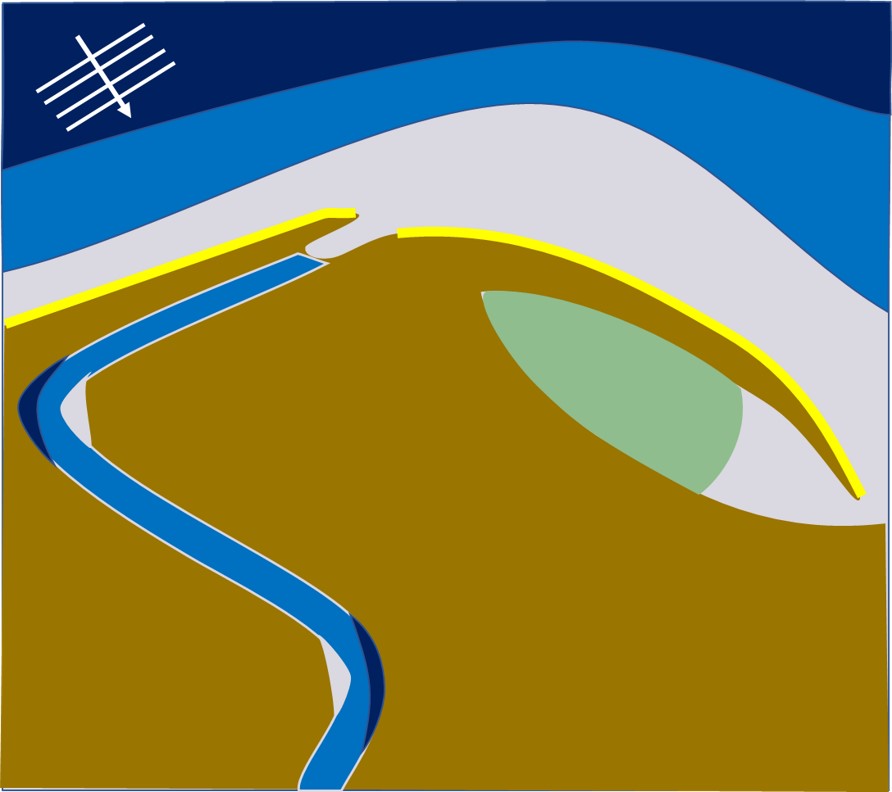
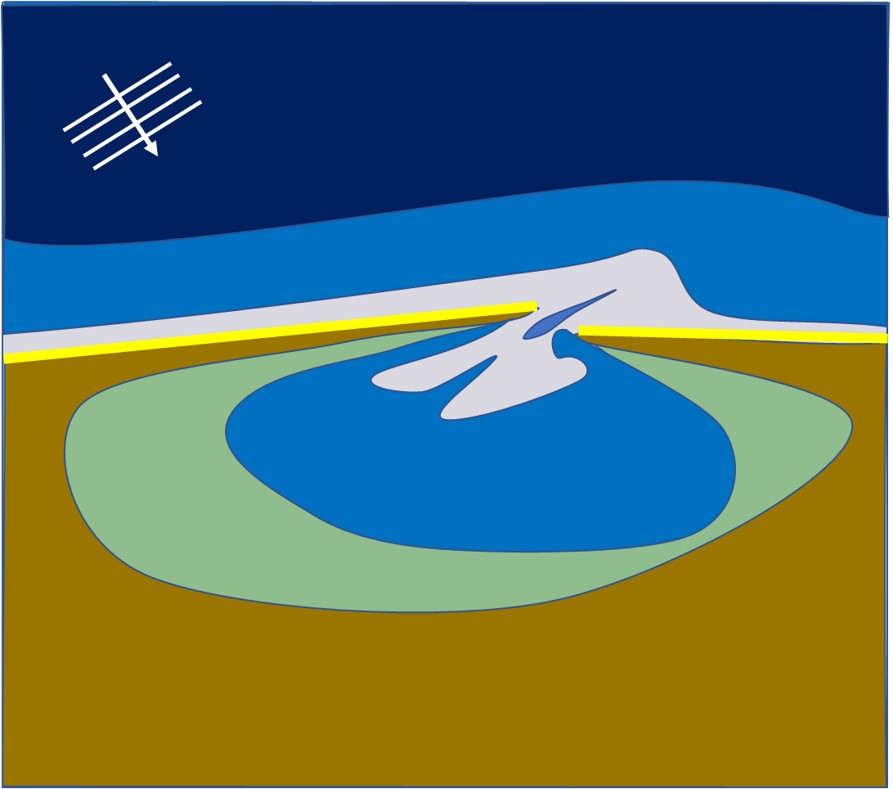
| 18:30, 18 February 2023 | WaveTideEstuary.jpg (file) |  |
62 KB | Schematic plan view of a wave- and tide-dominated estuary. | 1 |
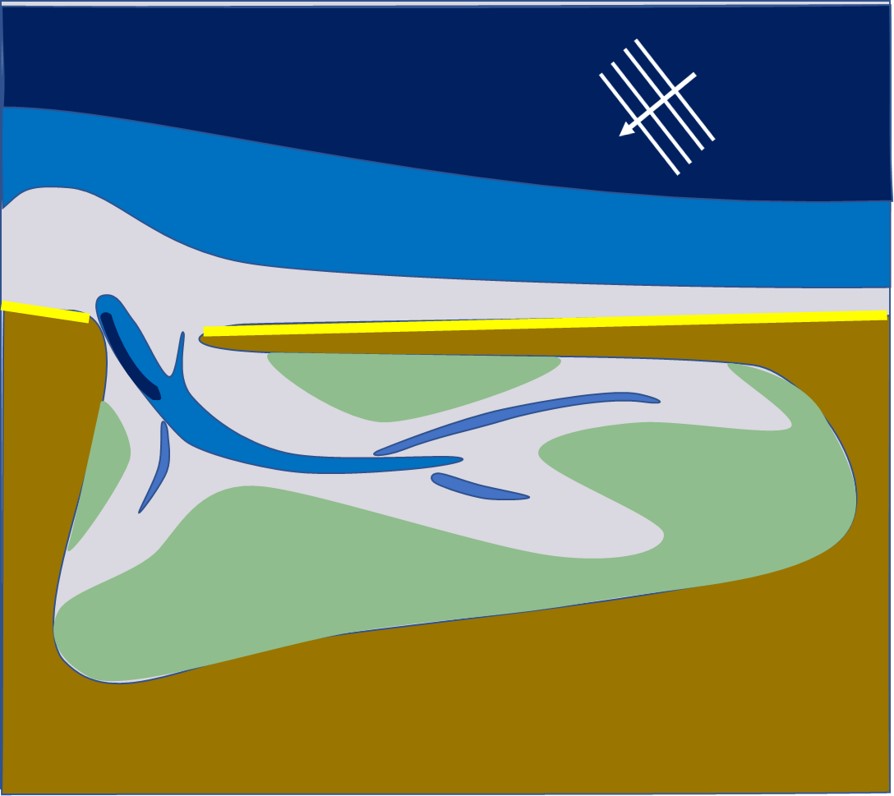
| 18:30, 18 February 2023 | RiverWaveEstuary.jpg (file) |  |
62 KB | Schematic plan view of a river- and wave-dominated estuary. | 1 |
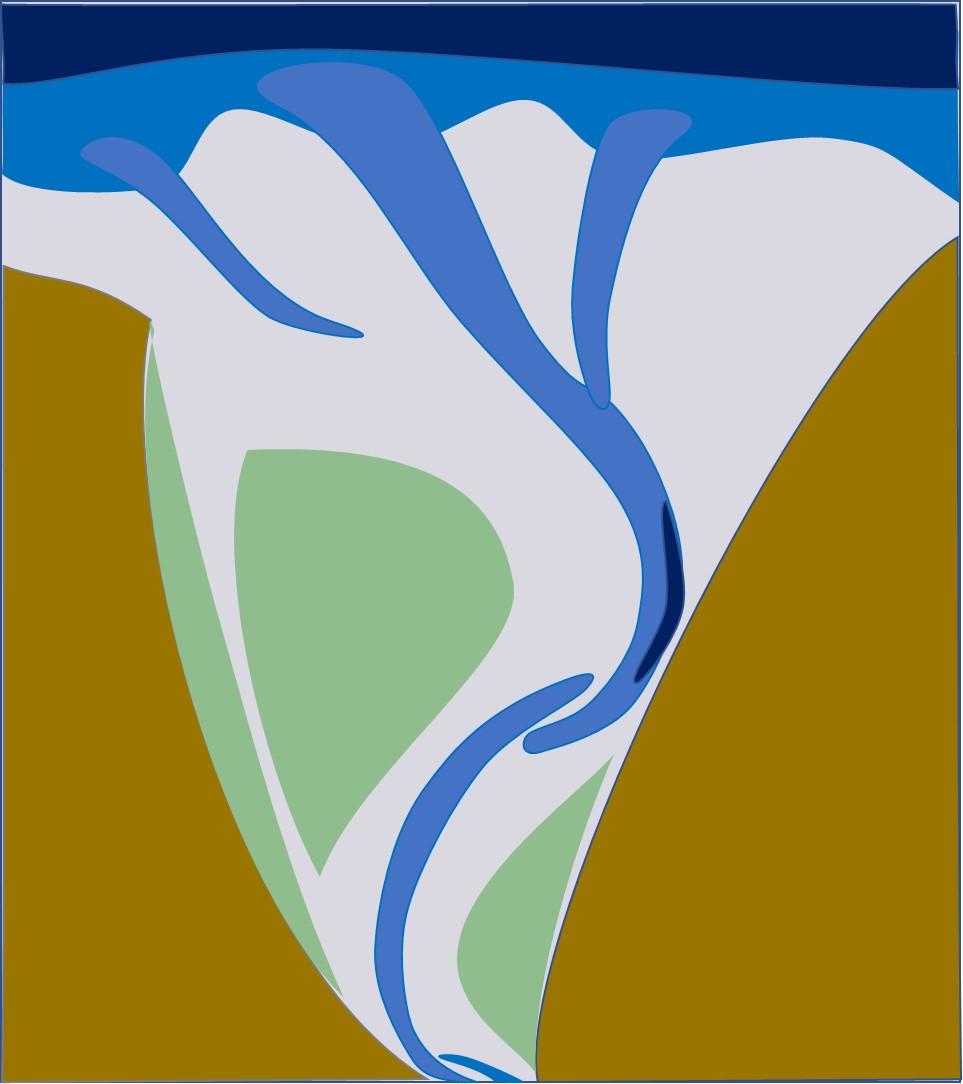
| 18:29, 18 February 2023 | RiverEstuary.jpg (file) |  |
84 KB | Schematic plan view of a river-dominated estuary. | 1 |
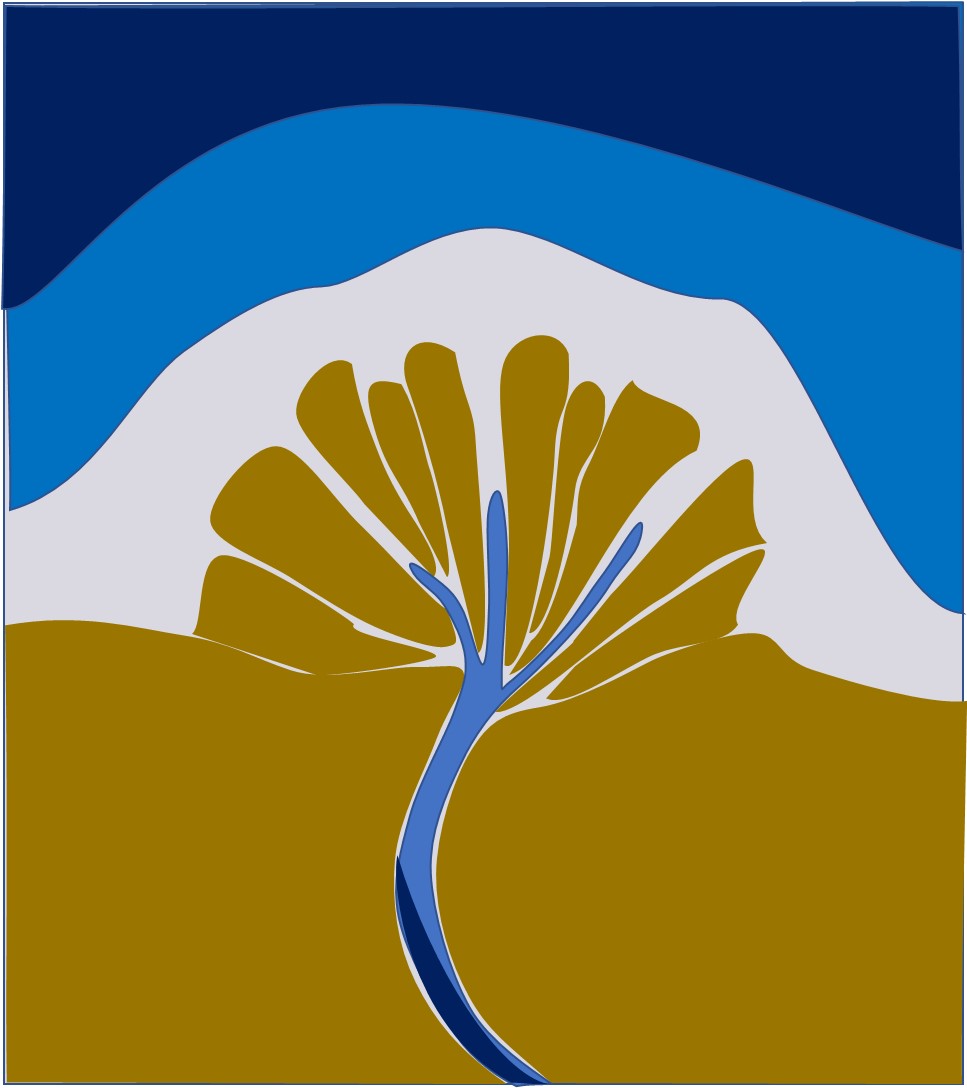
| 18:29, 18 February 2023 | WaveEstuary.jpg (file) |  |
58 KB | Schematic plan view of a wave-dominated estuary (oblique wave incidence). | 1 |
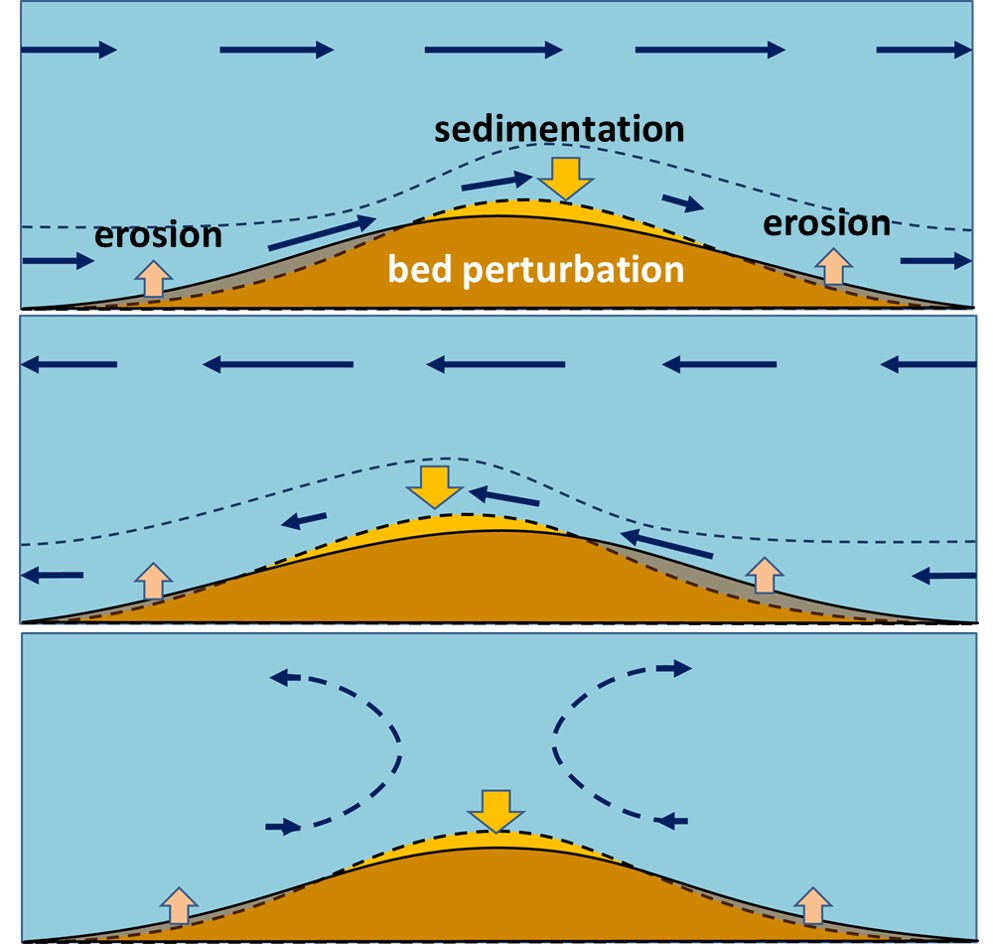
| 12:29, 7 February 2023 | BedformFormation.jpg (file) |  |
116 KB | Schematic representation of bedform formation. Top: Steady flow from left to right. Two successive stages of bed perturbation developement are brown and yellow, respectively. The dark-blue dotted line is a near-bed streamline. The dark-blue arrows are... | 1 |
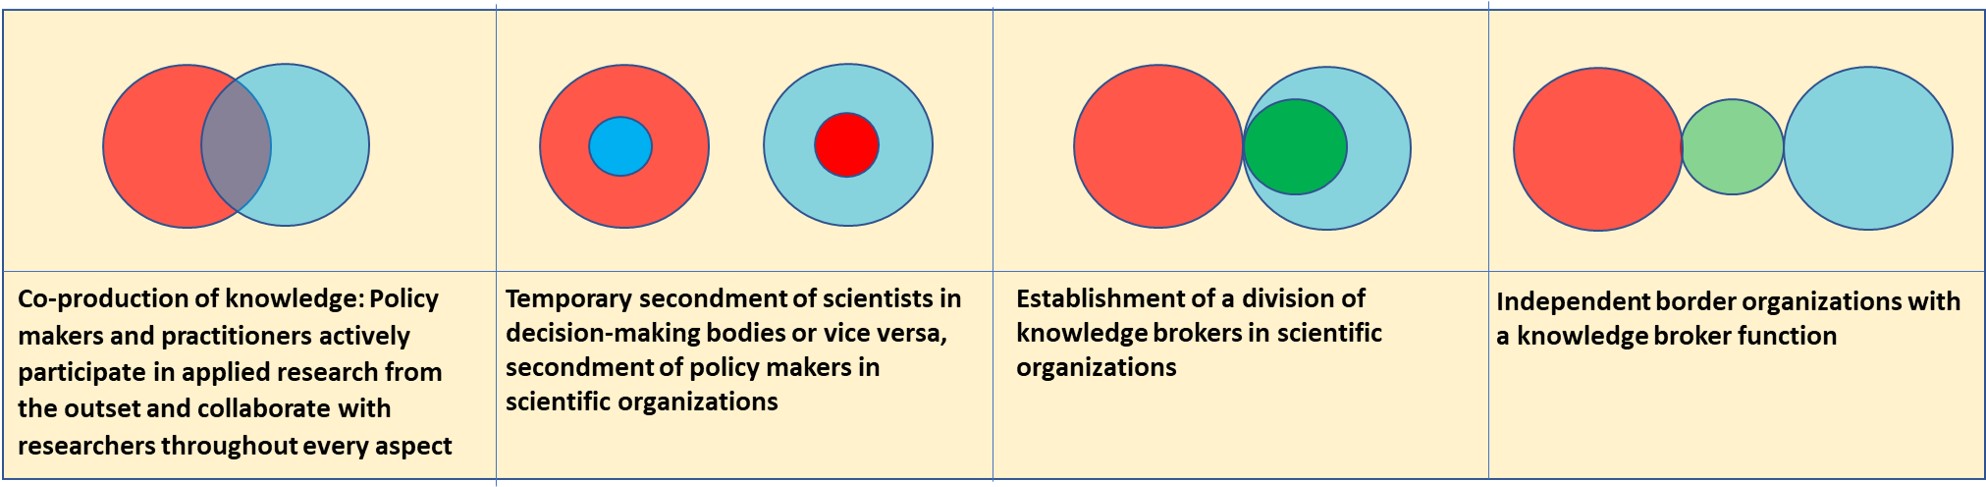
| 11:37, 2 February 2023 | PolicyOrganizationModels.jpg (file) | 156 KB | Four alternative models for science-policy interaction. Red=Policy, Blue=Research, Green=Broker. After Cvitanovic et al. 2015. | 1 | |
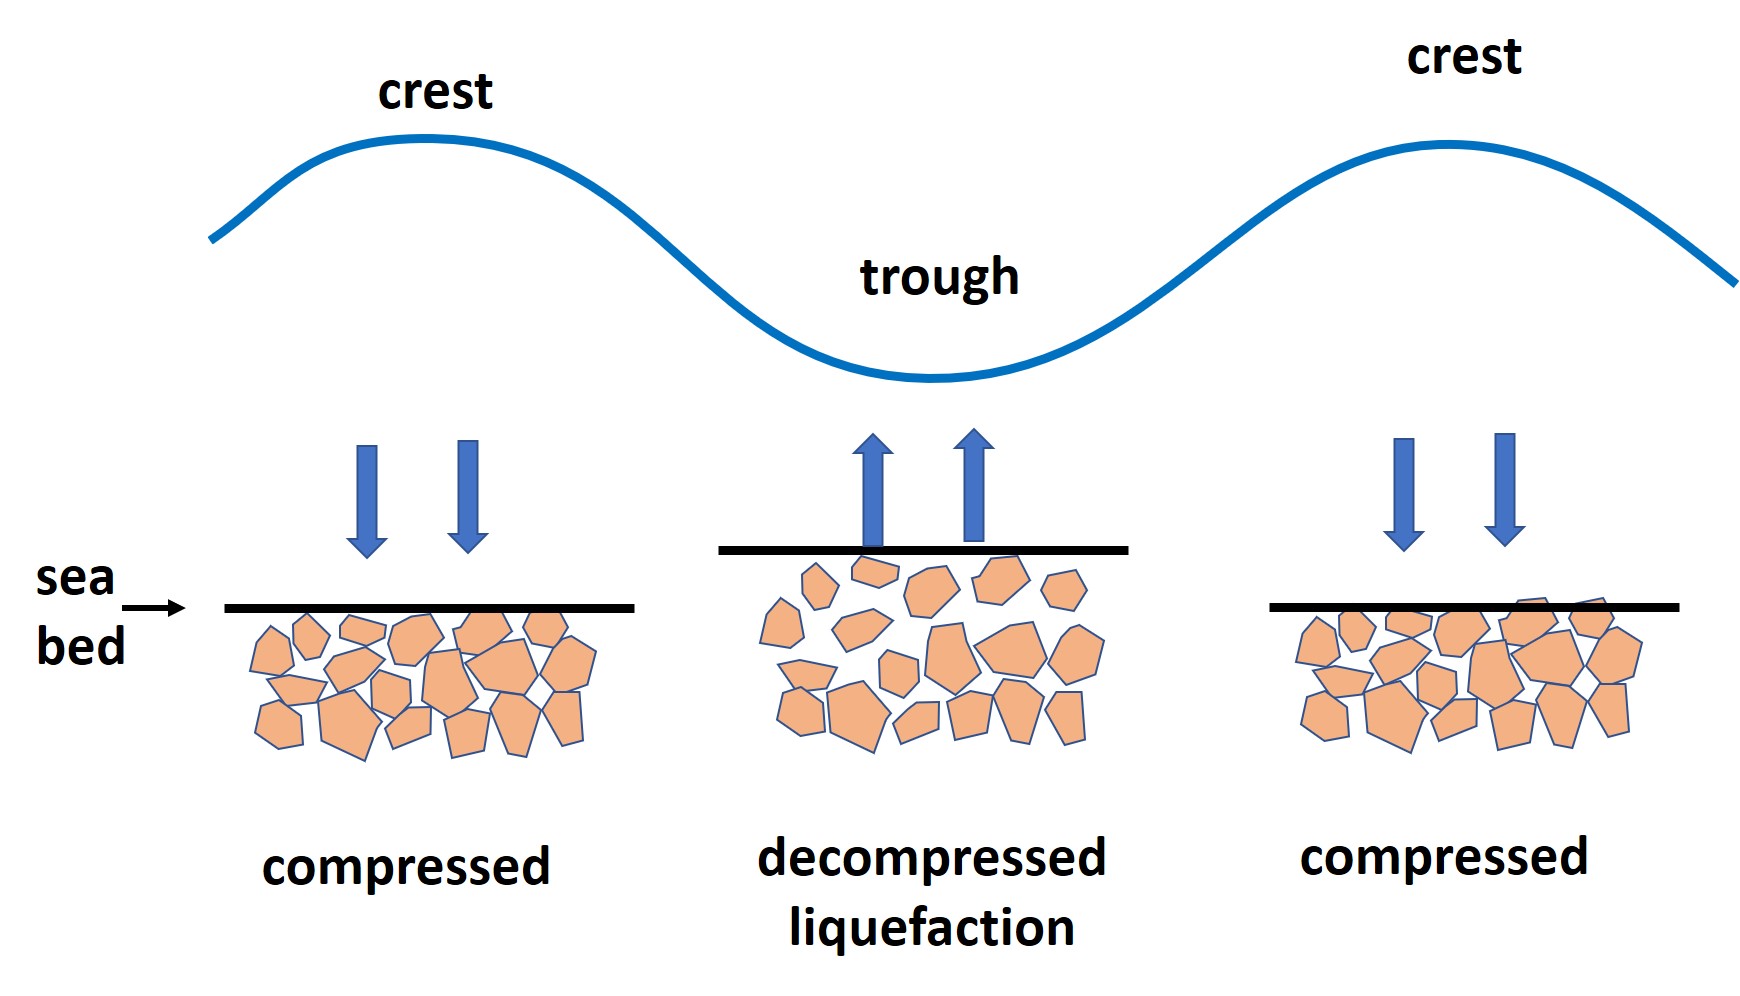
| 16:13, 31 January 2023 | TransientLiquefaction.jpg (file) | 161 KB | Principle of transient soil liquefaction. After De Groot et al. 2006. | 1 | |
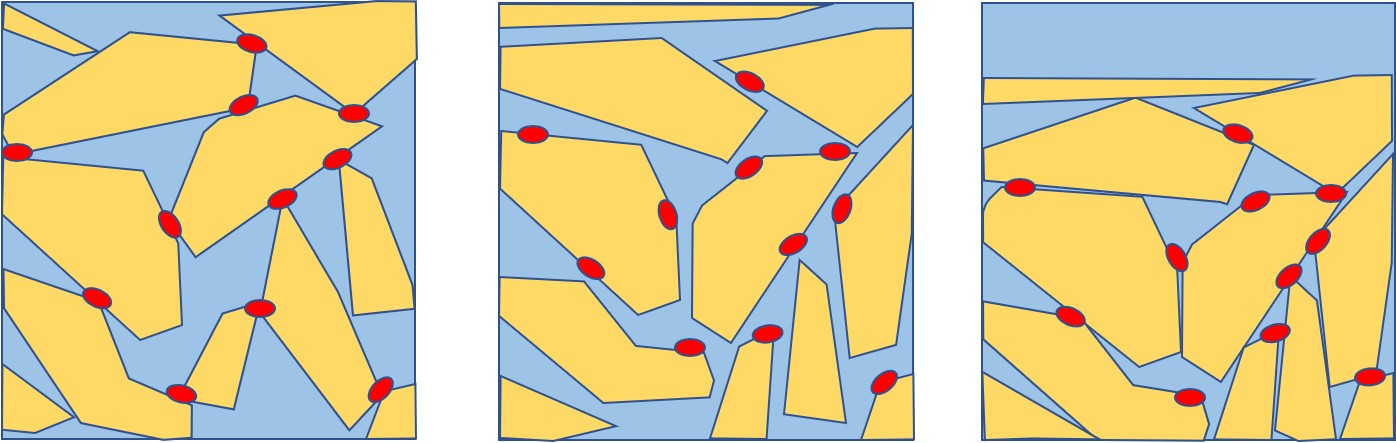
| 16:11, 31 January 2023 | ResidualLiquefaction.jpg (file) |  |
114 KB | Residual liquefaction process of a silt-clay soil. Silt grains are yellow and clay particles are red. Left panel: Initial loosely packed silt-clay soil. Middle panel: Grain contact points are broken due to wave-induced grain rearrangement and pore pres... | 1 |
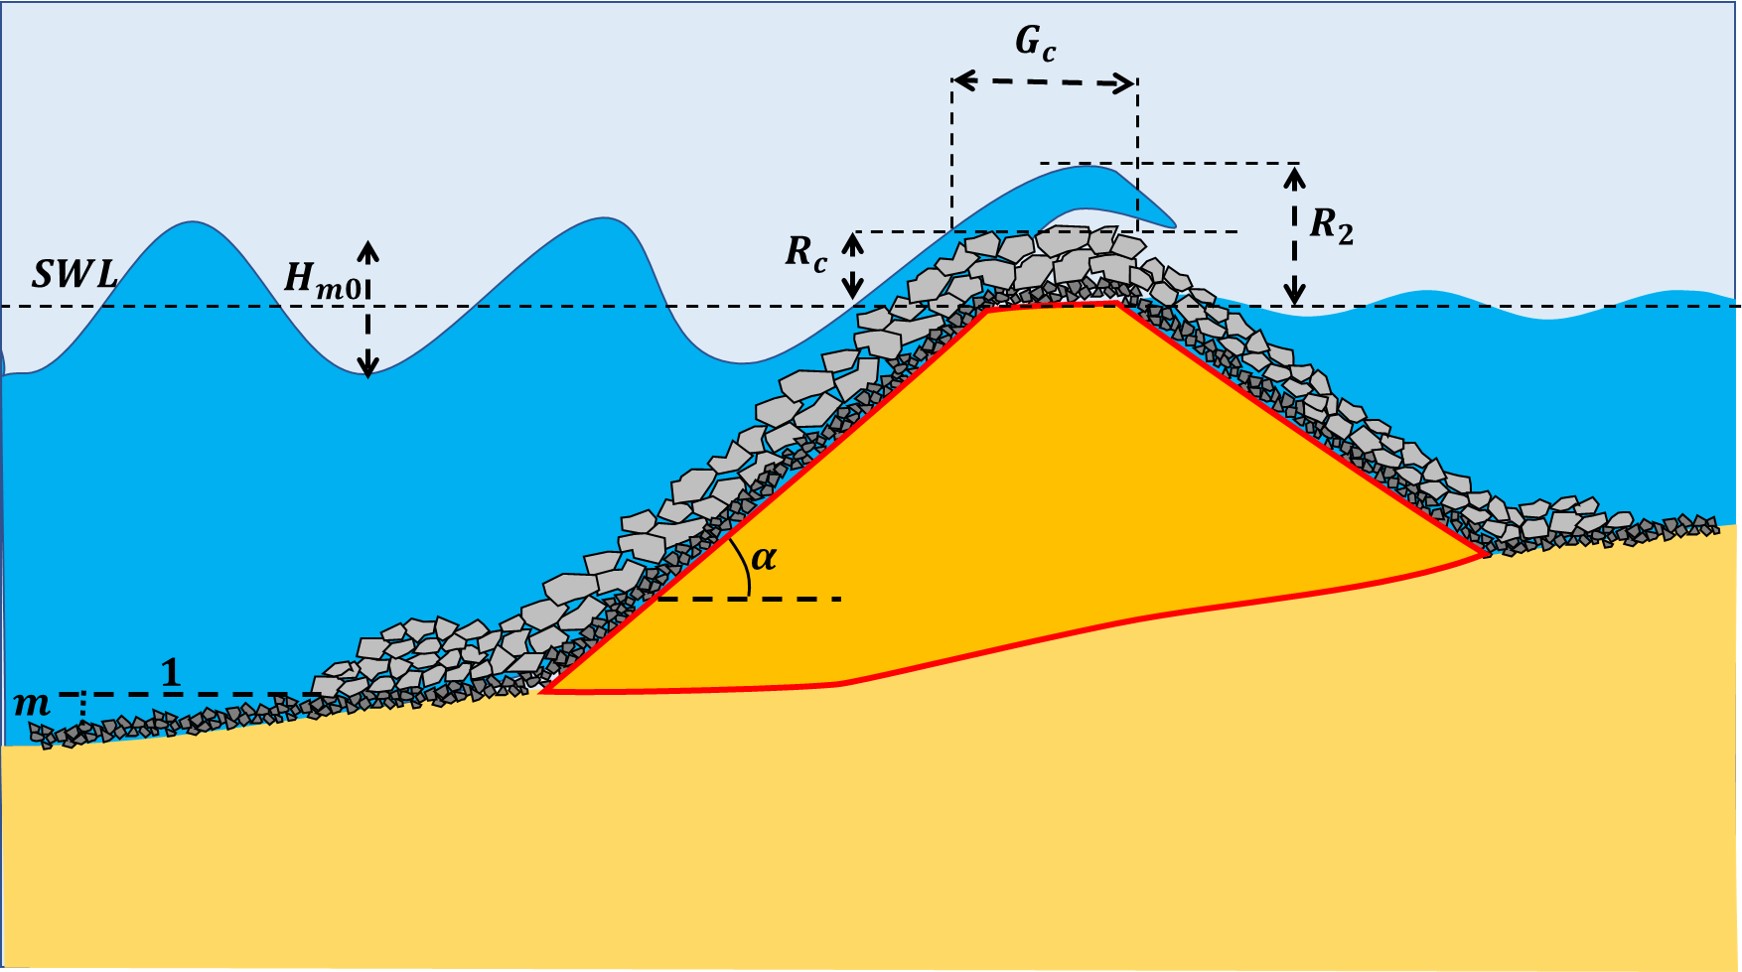
| 20:27, 27 January 2023 | BreakwaterOvertopDef.jpg (file) |  |
169 KB | Waves overtopping a breakwater; definition of symbols. | 1 |
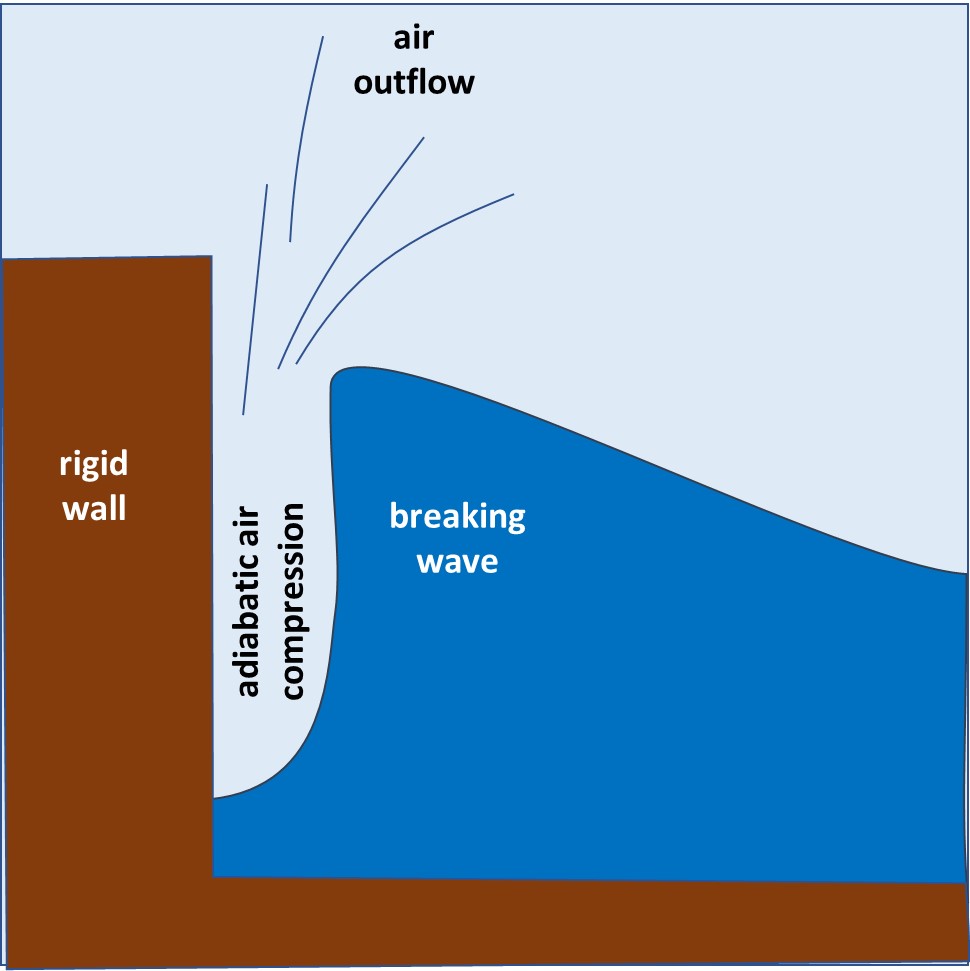
| 19:50, 29 December 2022 | WaveCollisionShock.jpg (file) |  |
63 KB | Schematic of a wave breaking on a vertical wall. | 1 |
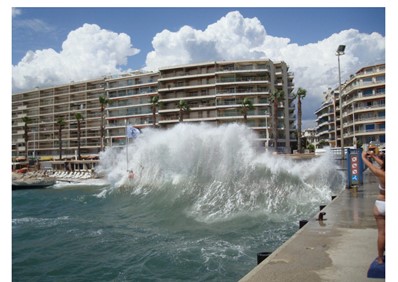
| 17:39, 29 December 2022 | WaveSplash.jpg (file) |  |
37 KB | Wave splashing on a vertical wall. Photo Niels Mejlhede Jensen. | 1 |
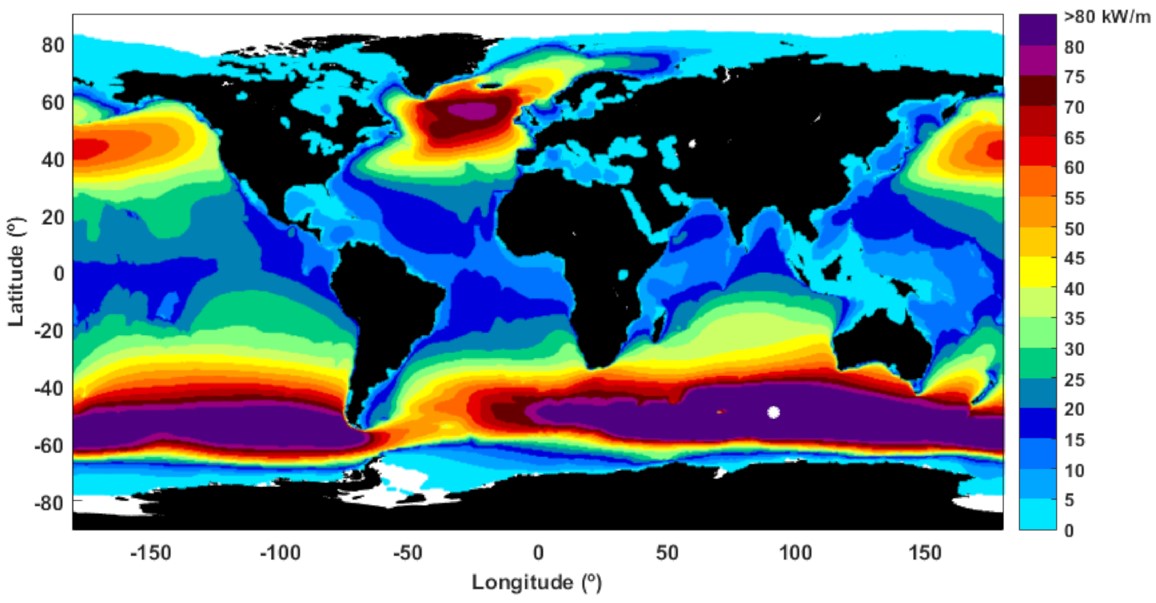
| 22:27, 28 December 2022 | GlobalMeanWavePower.jpg (file) |  |
135 KB | Mean wave power over the 30-year time interval considered (1989–2018) based on date from ERA5 (i.e.,ECMWF RE-analysis, fifth generation). From: Rusu, L. and Rusu, E. 2021. Evaluation of the Worldwide Wave Energy Distribution Based on ERA5 Data and Al... | 1 |
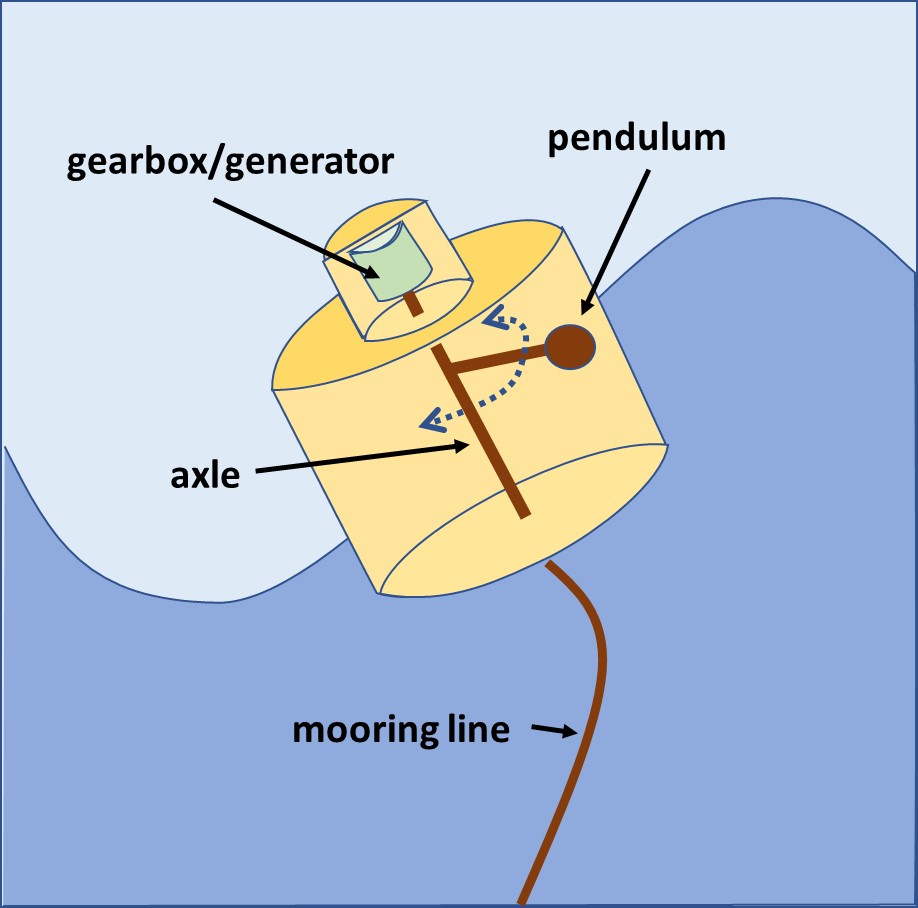
| 19:15, 28 December 2022 | VAPWEC.jpg (file) |  |
76 KB | Vertical Axis Pendulum WEC (VAPWEC) | 1 |
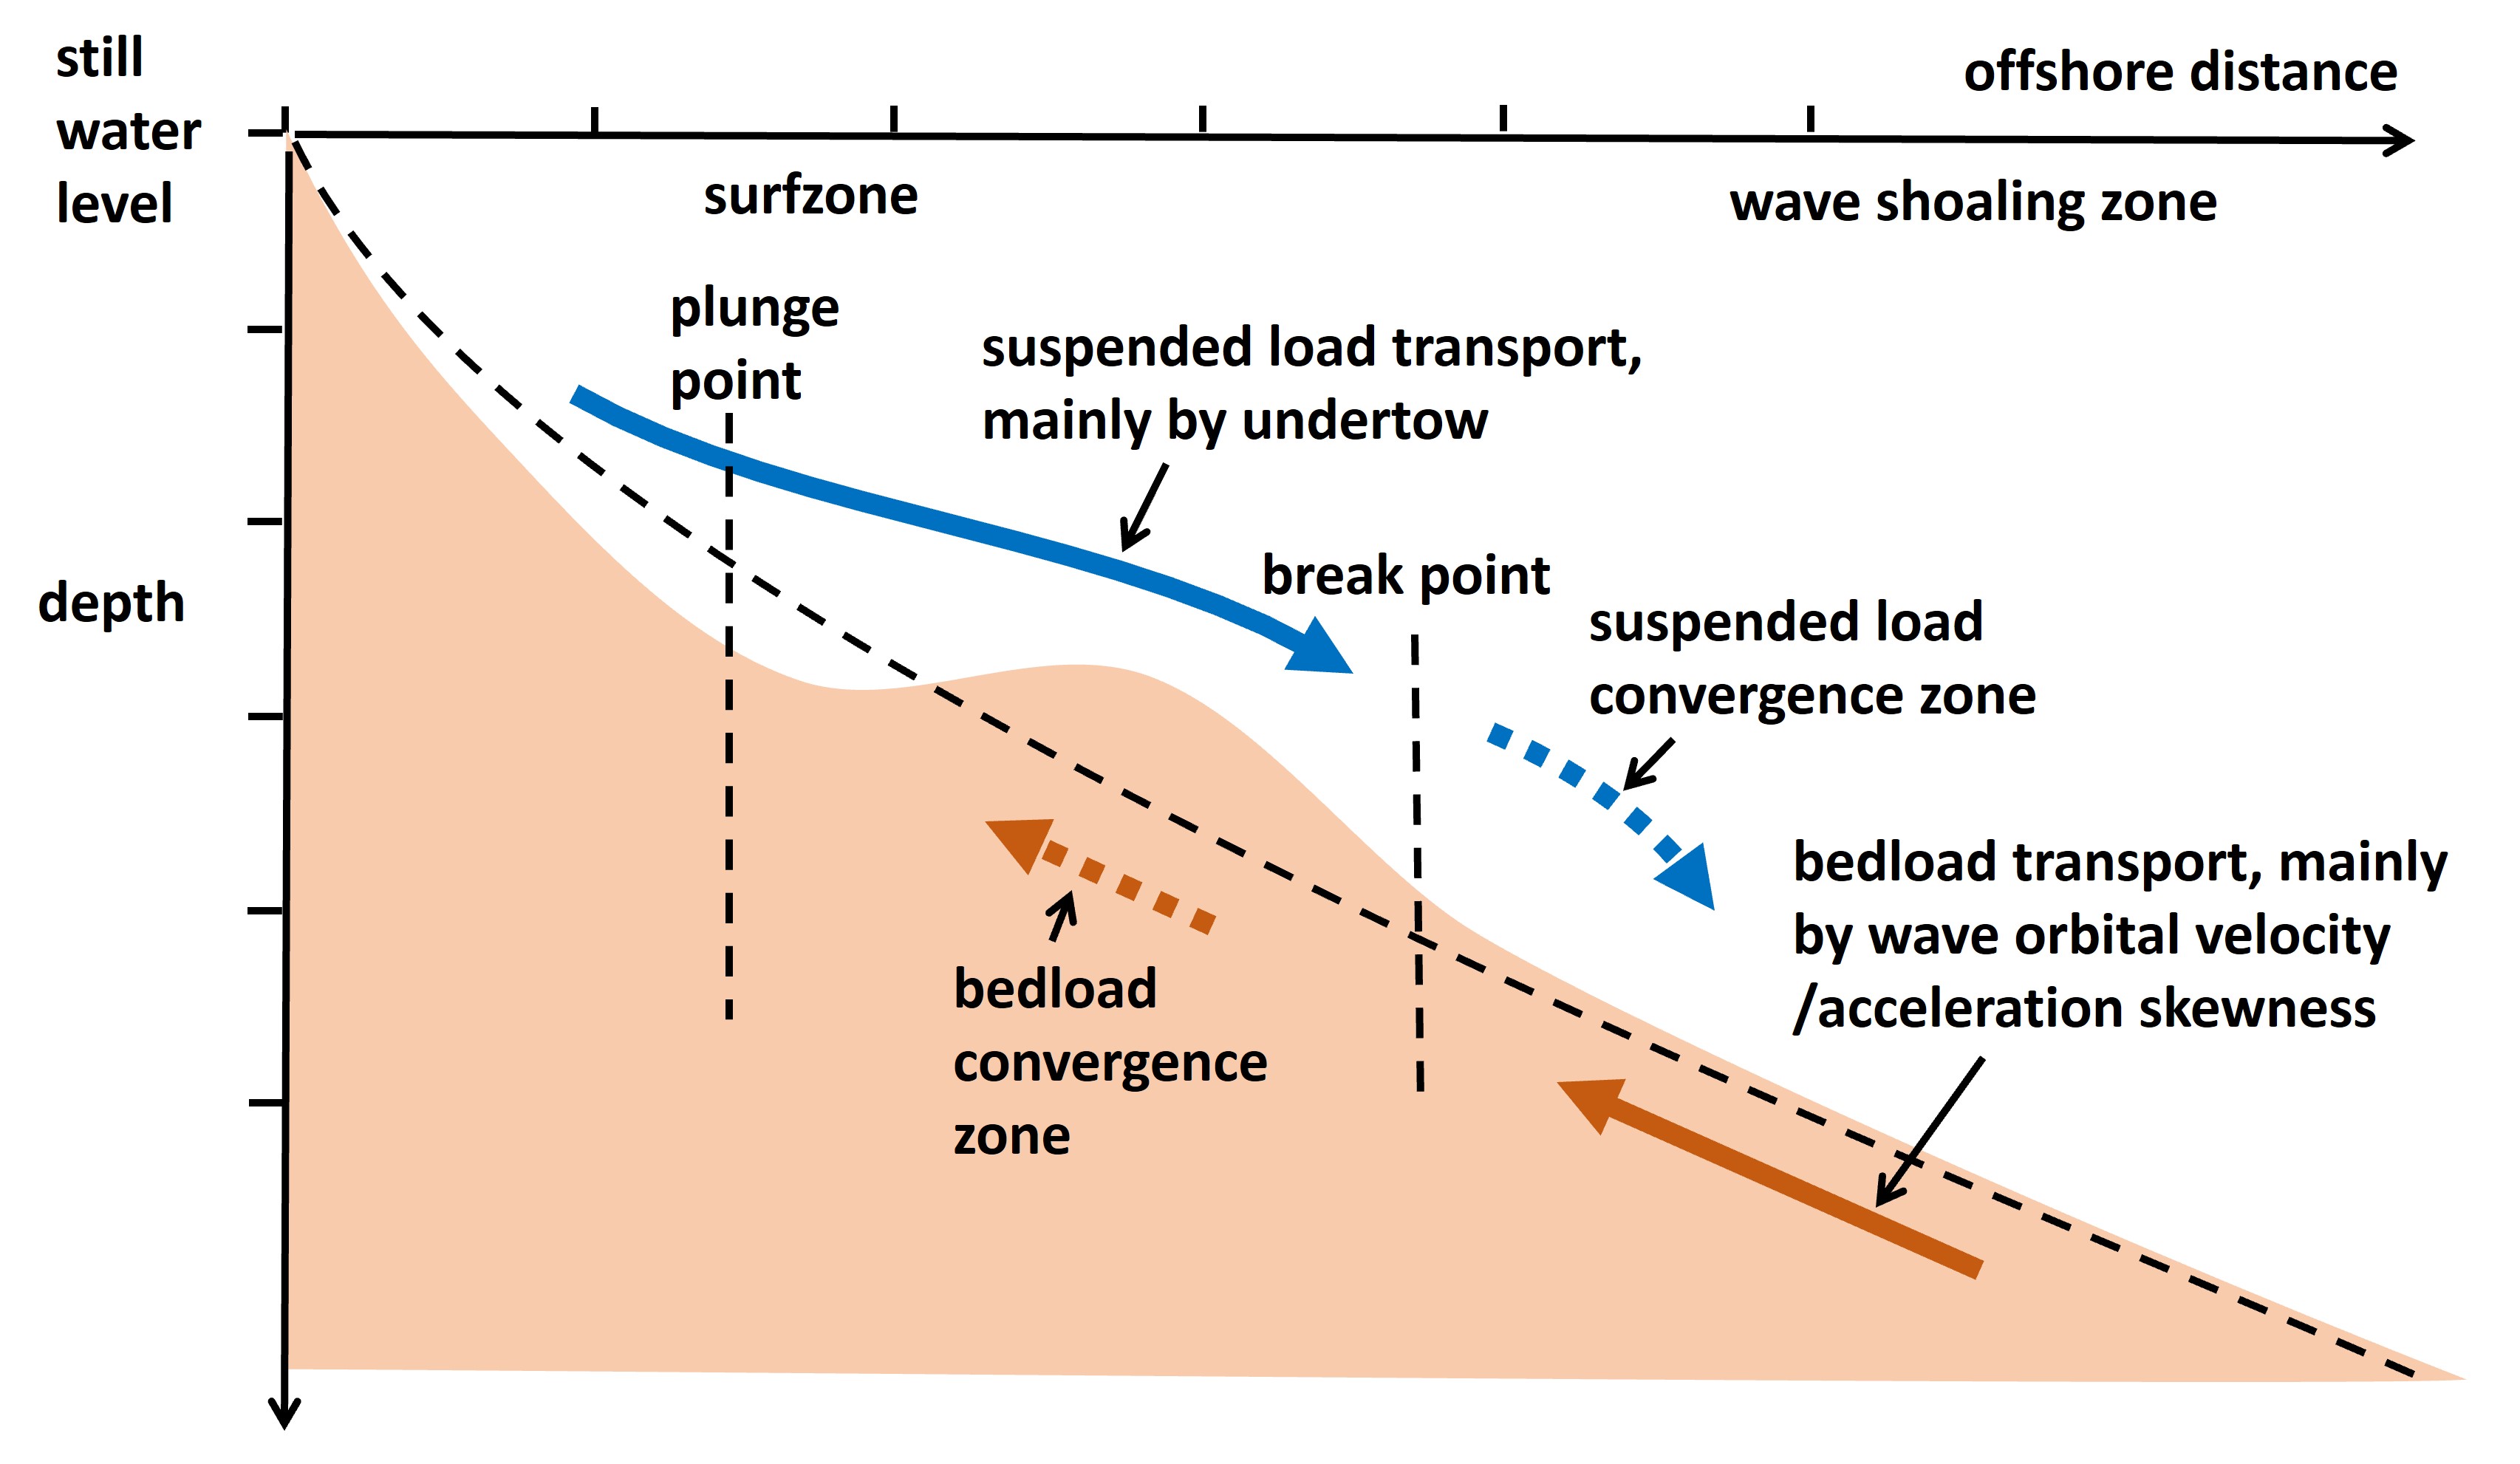
| 12:16, 27 December 2022 | BarFormationTransports.jpg (file) | 462 KB | Schematic of the major bar-building sediment transport processes. | 1 | |
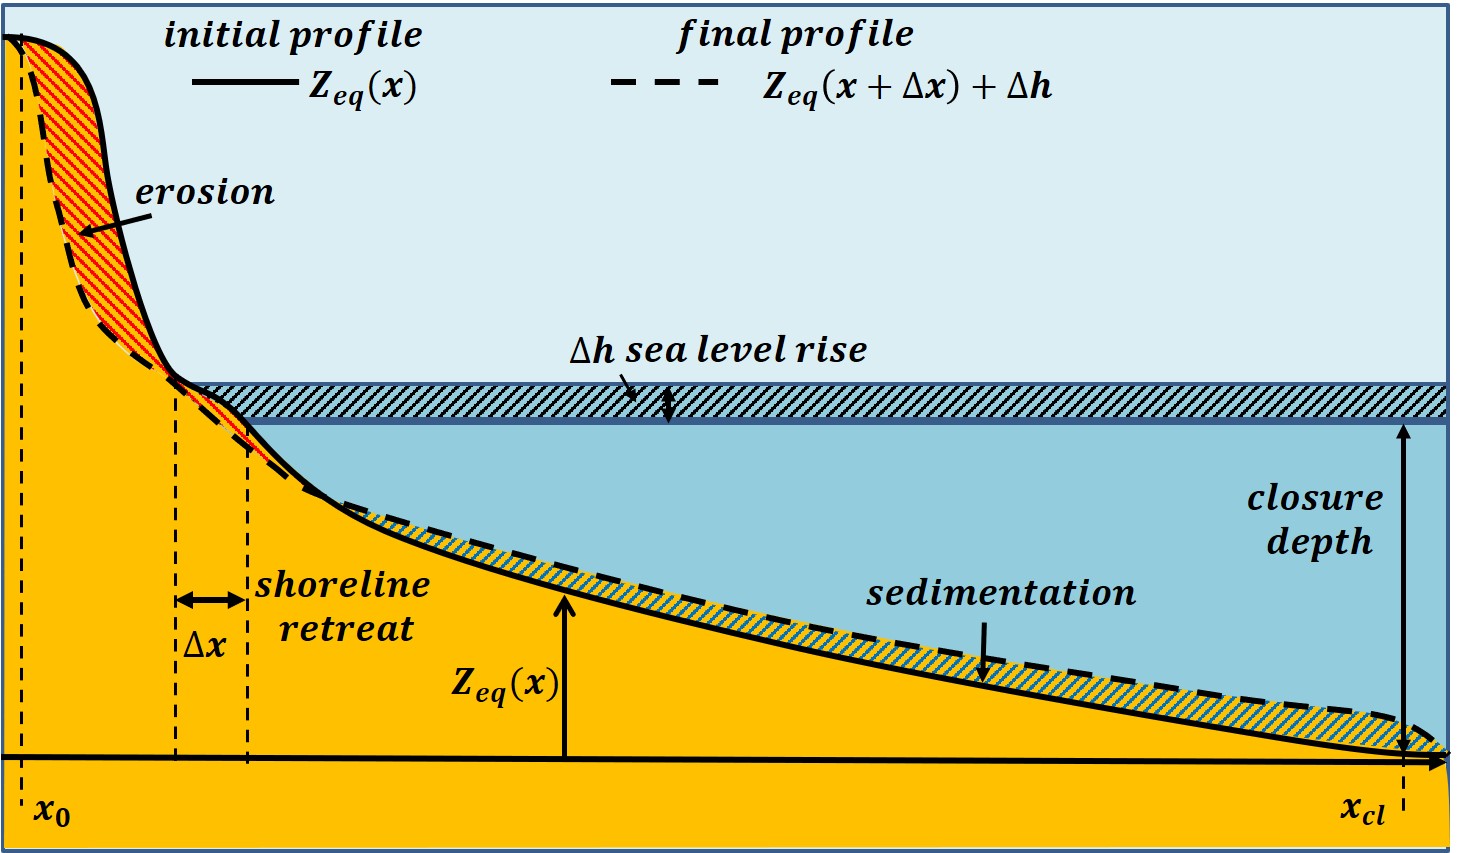
| 21:42, 11 December 2022 | BruunRuleDefinition.jpg (file) |  |
211 KB | Schematic representation of the shoreface shift in response to sea-level rise. The shaded eroded and deposited volumes are equal. The vertical/horizontal scale ratio is greatly exaggerated. | 1 |
| 16:33, 7 December 2022 | WedgeLengthObsMod6.jpg (file) |  |
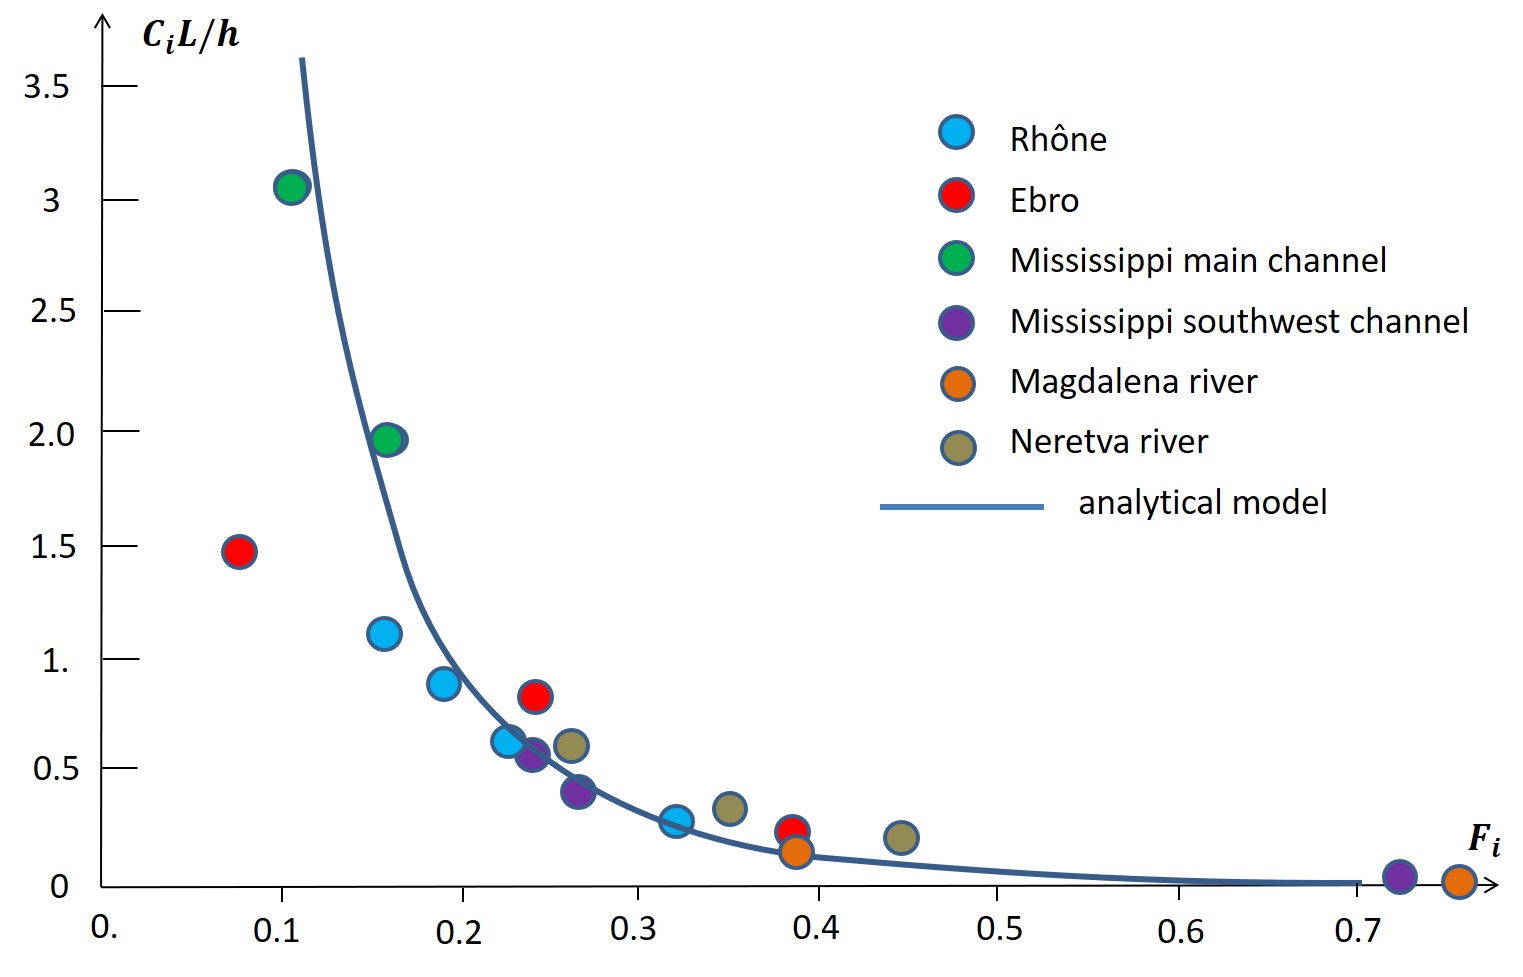
109 KB | Dimensionless salt wedge length for a prismatic estuary according to the analytic model and observed salt wedge lengths in the Rhône, Ebro, the Mississippi, Magdalena and Neretva estuaries at different discharges (corresponding to different internal r... | 1 |
| 16:35, 14 November 2022 | WedgeLengthObsMod.jpg (file) |  |
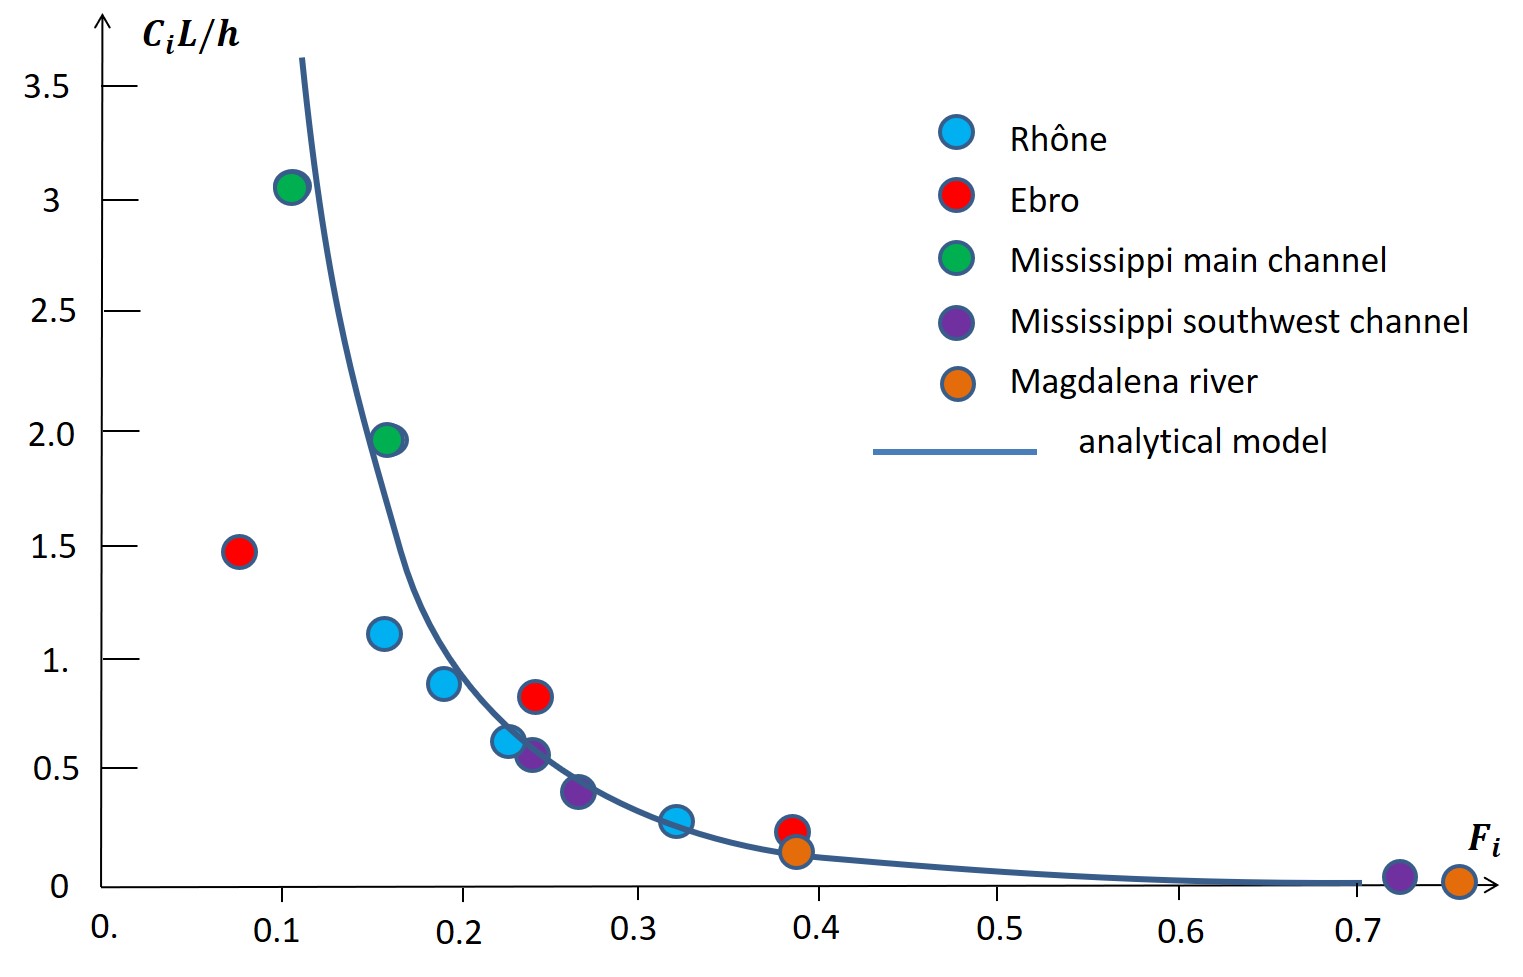
102 KB | Dimensionless salt wedge length for a prismatic estuary and observed salt wedge lengths in the Rhône, Ebro, Mississippi and Magdalena estuaries at different discharges. | 2 |
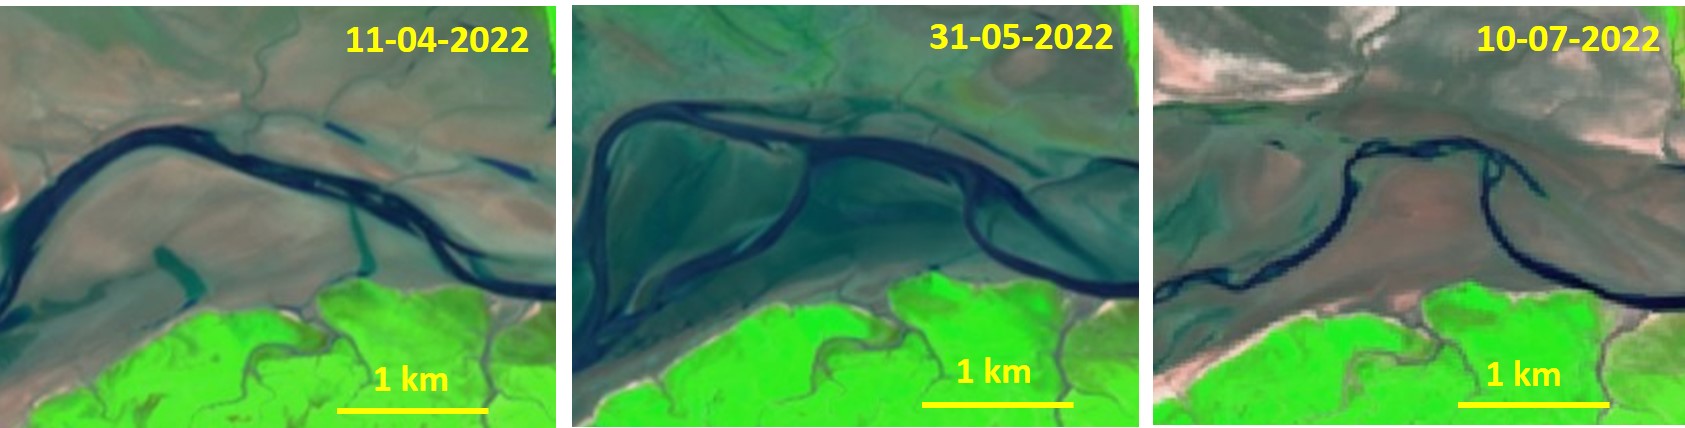
| 15:32, 11 October 2022 | MarshErosionMontSaintMichel.jpg (file) |  |
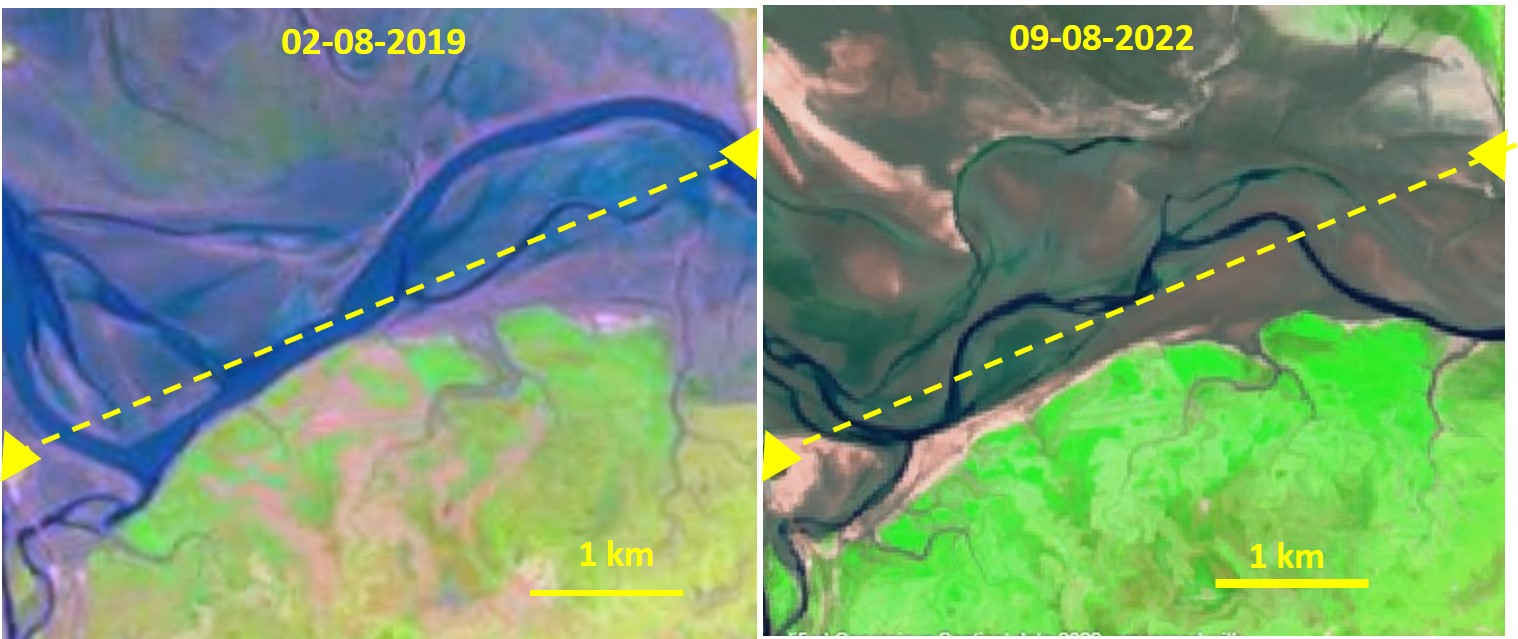
159 KB | Marsh retreat in the southern part of the bay of Mont-Saint-Michel caused by an adjacent meandering tidal channel in the period 2019-2022 and marsh accretion in the north. The left triangle indicates the Mont-Saint-Michel and the right triangle the Poi... | 1 |
| 15:08, 11 October 2022 | TidalBendFlow.jpg (file) |  |
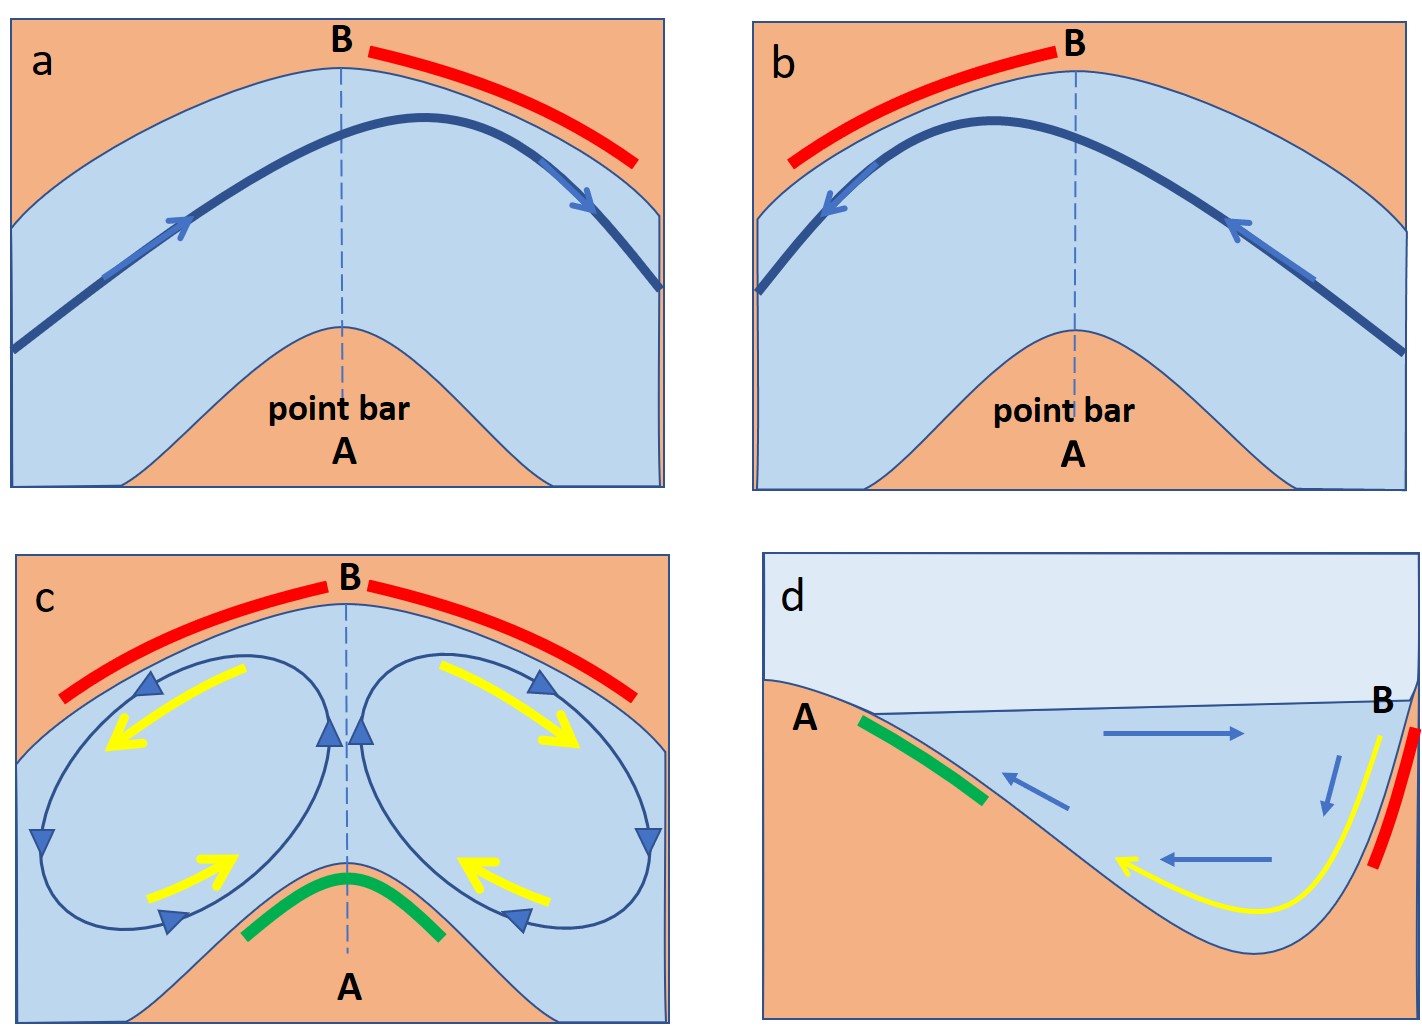
162 KB | Schematic representation of tidal flow and sediment transport in a channel bend. a: flood flow path; b: ebb flow path; c: horizontal pattern of residual fluid flow (blue) and net sediment transport (yellow); d: cross-channel pattern of residual flow (... | 1 |
| 21:27, 10 October 2022 | MeandersMontSaintMichel.jpg (file) | 113 KB | Dynamic meander pattern of tidal channels in the eastern part of the bay of Mont-Saint-Michel. Tidal channel are dark blue. | 1 | |
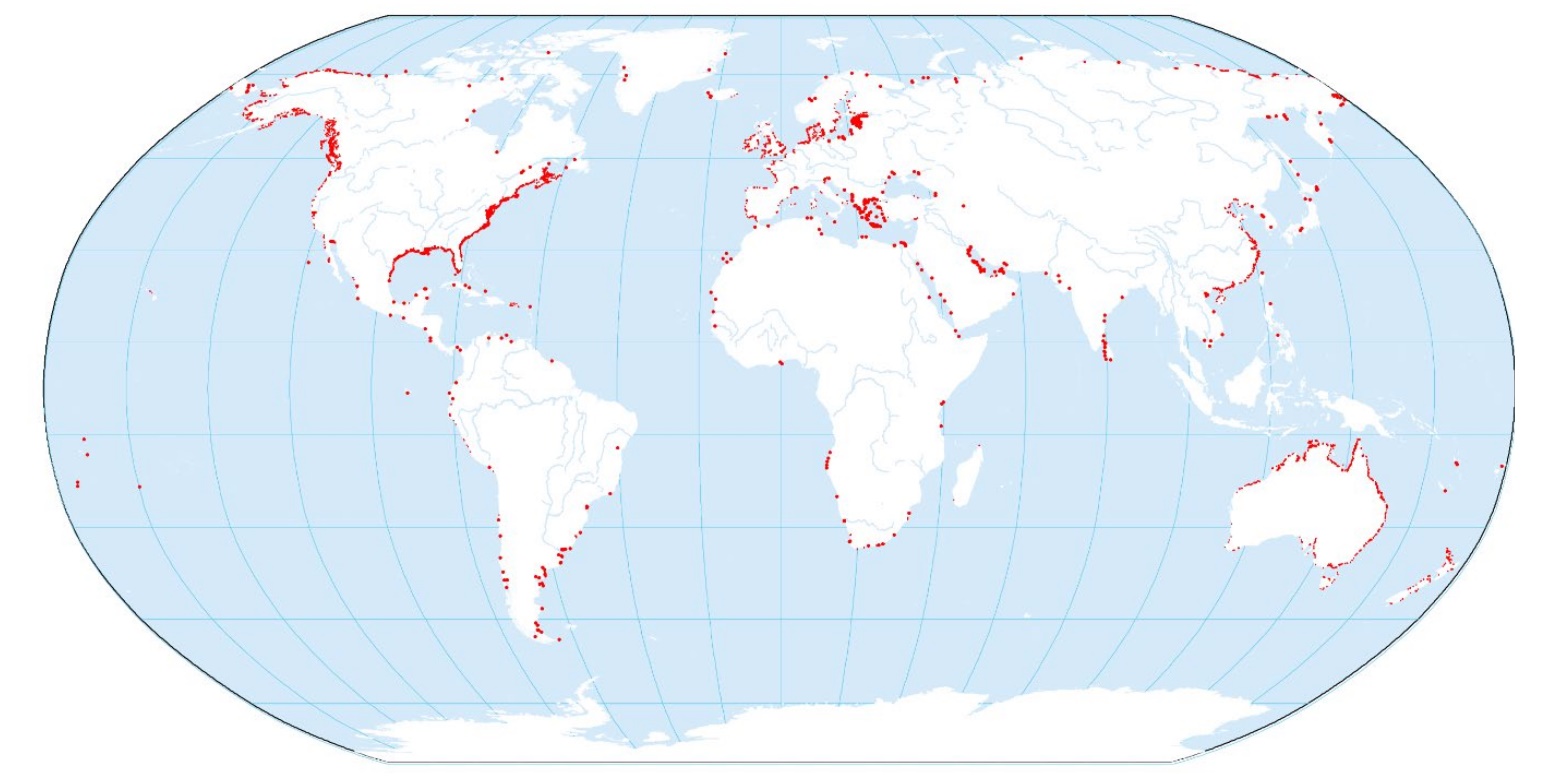
| 19:29, 9 October 2022 | GlobalDistributionSaltMarshes.jpg (file) |  |
203 KB | Global distribution of salt marshes. From Mcowen et al. 2017. Creative Commons Licence https://creativecommons.org/licenses/by-nc/3.0/ | 1 |
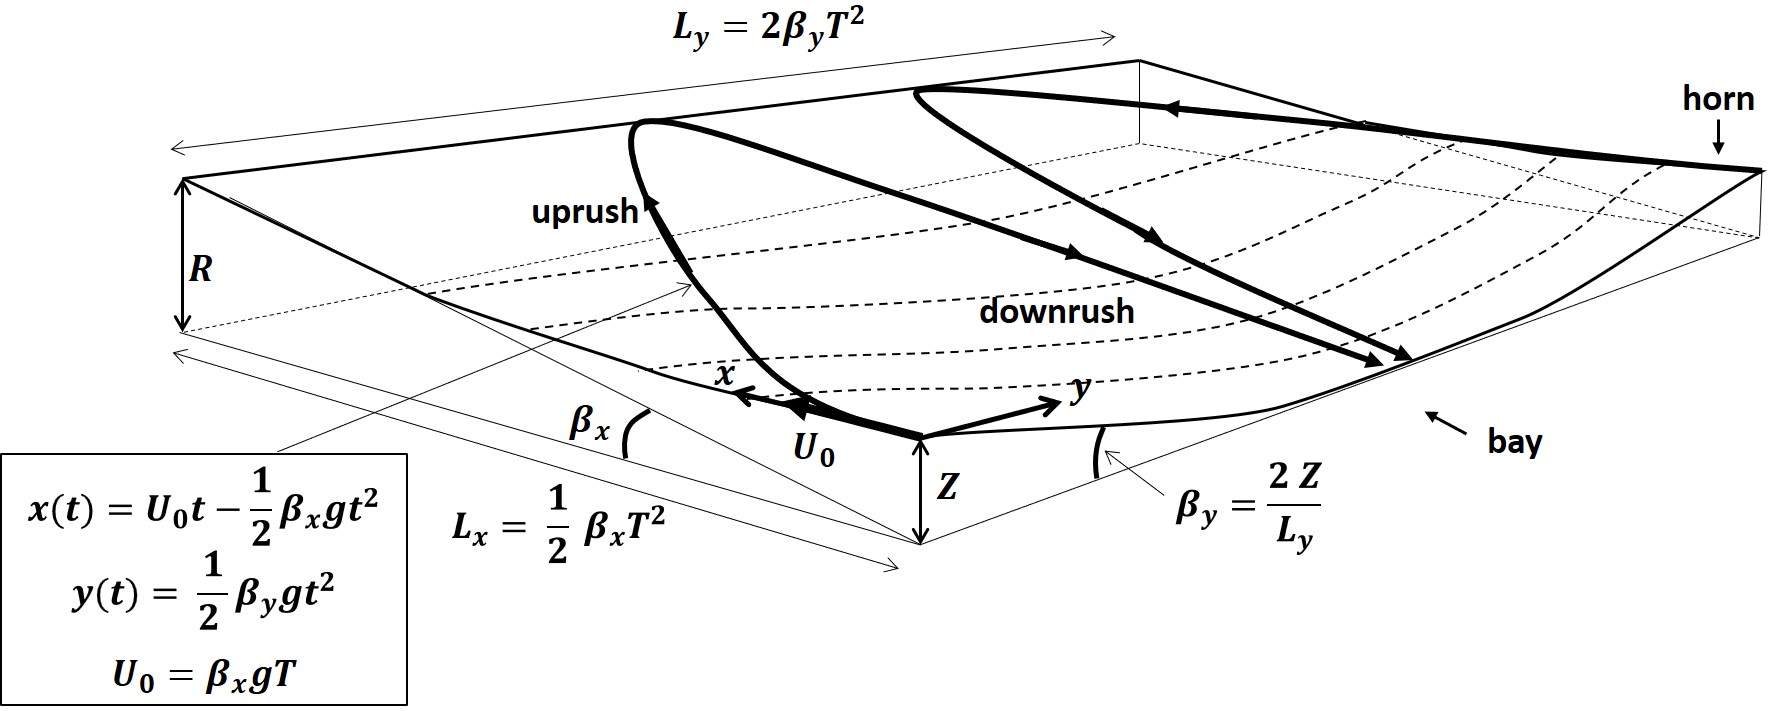
| 09:51, 9 October 2022 | BeachCuspSwashScheme.jpg (file) |  |
159 KB | Schematic representation of a beach cusp with wave uprush and downrush. | 2 |
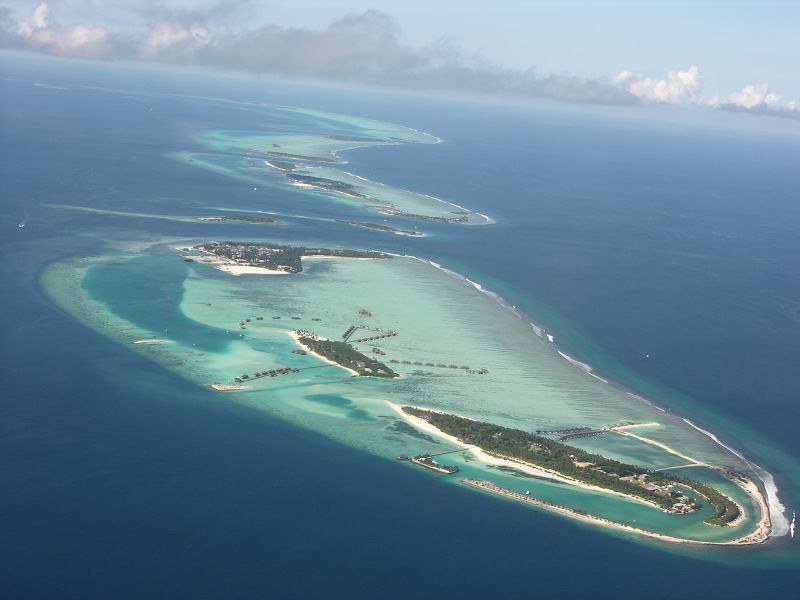
| 09:18, 6 October 2022 | Maldives FabioDiLupo.jpg (file) |  |
53 KB | Maldives archipelago. Photo credit Fabio Di Lupo, Flickr Creative Commons. | 1 |
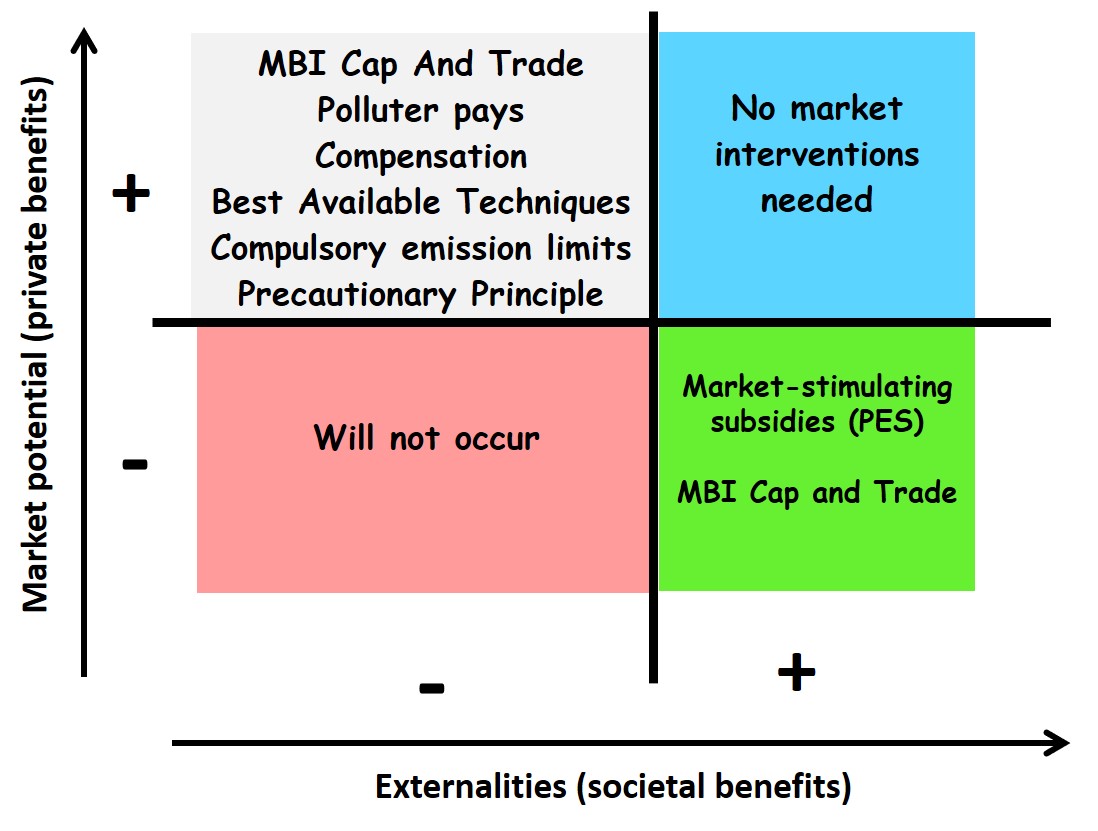
| 15:16, 1 October 2022 | BlueBioEconomy.jpg (file) |  |
120 KB | Governmental policies for a blue bio-economy, adapted after Hasselström and Gröndahl (2021) | 1 |
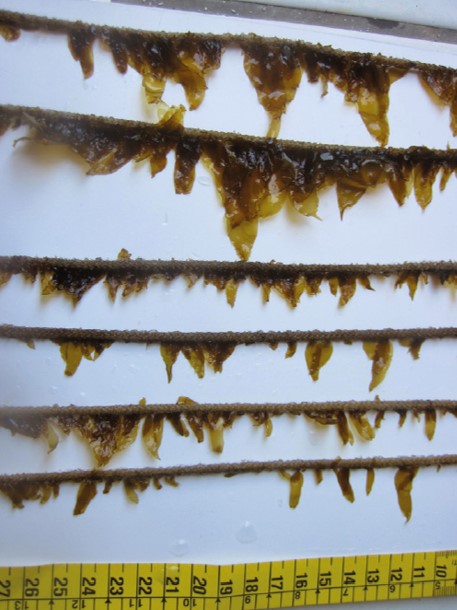
| 16:10, 23 September 2022 | SeaweedRopeCulture.jpg (file) |  |
70 KB | Lines seeded with juveniles sporophytes of Sacharina Latissima. The most common cultivation method consists of tying seedlings to monofilament lines strung between mangrove stakes which are pounded into the substrate. Image from Bermejo et al. (2022),... | 1 |
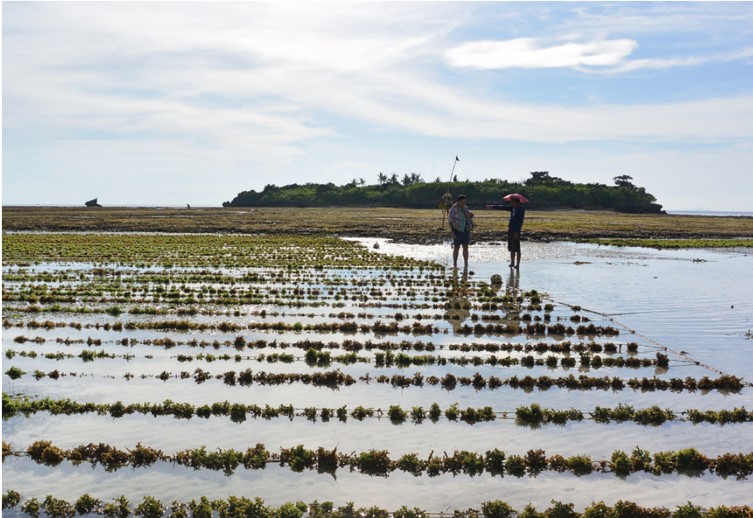
| 15:24, 23 September 2022 | SeaweedFarm.jpg (file) |  |
120 KB | Cultivation of ''Kappaphycus'' in the Philippines. Image from Bermejo et al. (2022), photo credit Elisa Capuzzo. Creative Commons Attribution (CC BY) license (https://creativecommons.org/licenses/by/4.0/). | 1 |
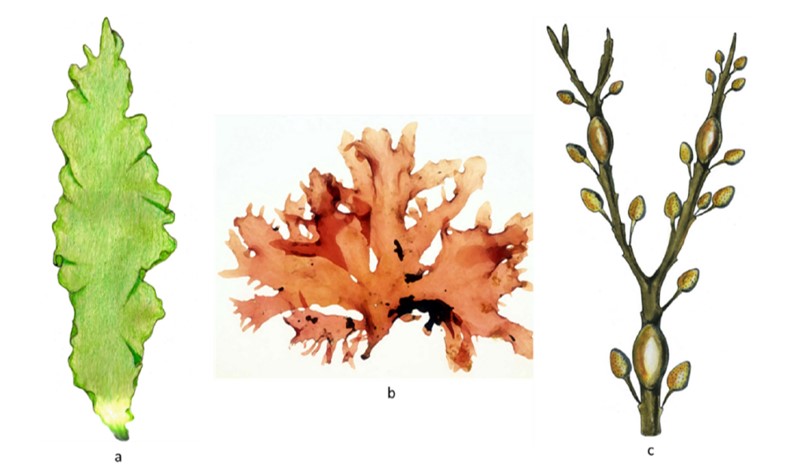
| 16:34, 21 September 2022 | SeaweedSpecies.jpg (file) |  |
56 KB | Examples of the three main taxonomic groups: a. phylum Chlorophyta (green algae); b. phylum Rhodophyta (red algae); c. phylum Ochrophyta, class Phaeophyceae (brown algae). From Pereira (2021) Creative Commons Attribution (CC BY) license (https://creati... | 1 |
| 09:41, 18 September 2022 | BreakwaterDiffraction.jpg (file) |  |
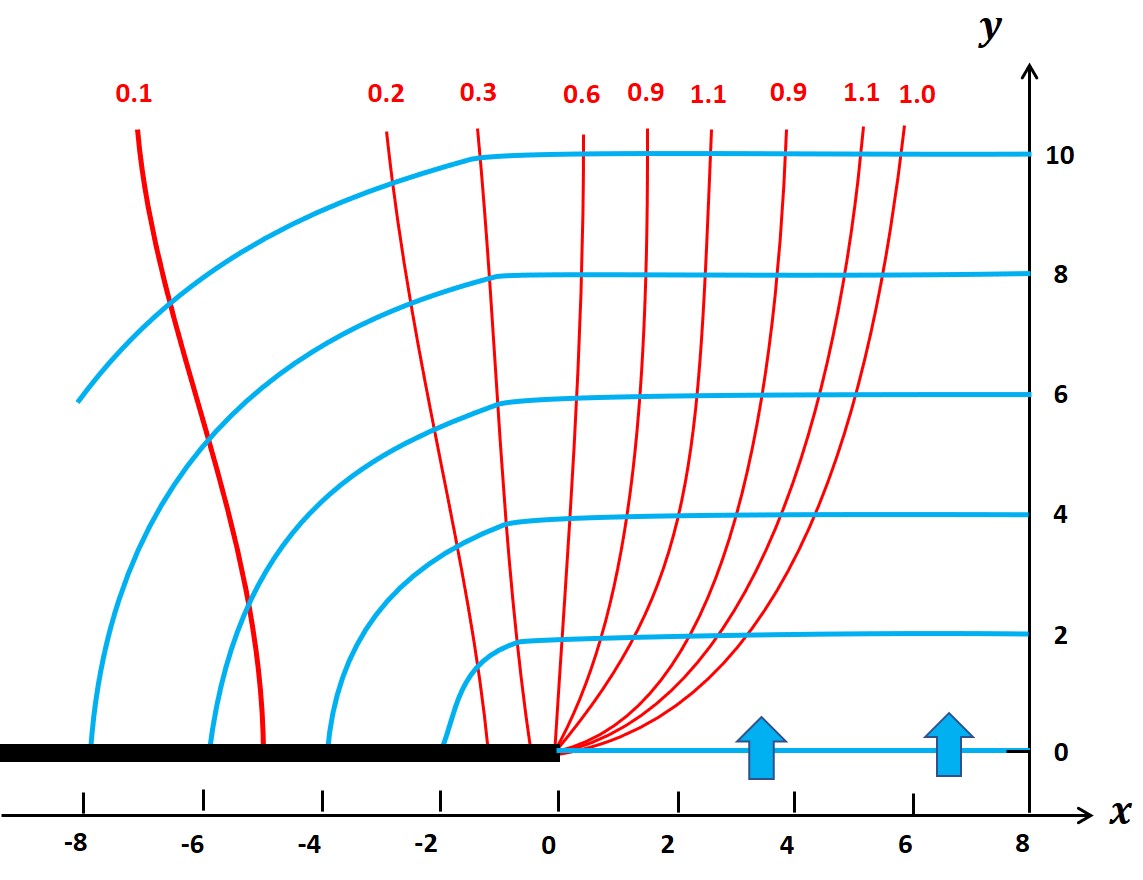
120 KB | Analytical solution of the diffraction of a linear water wave propagating over uniform depth in <math>y</math>-direction behind a rigid breakwater extending from <math>x=-\infty</math> to <math>0</math>. Blue curves are wavefronts and red curves are li... | 1 |
| 22:05, 9 September 2022 | GreatGarudaPlan.jpg (file) |  |
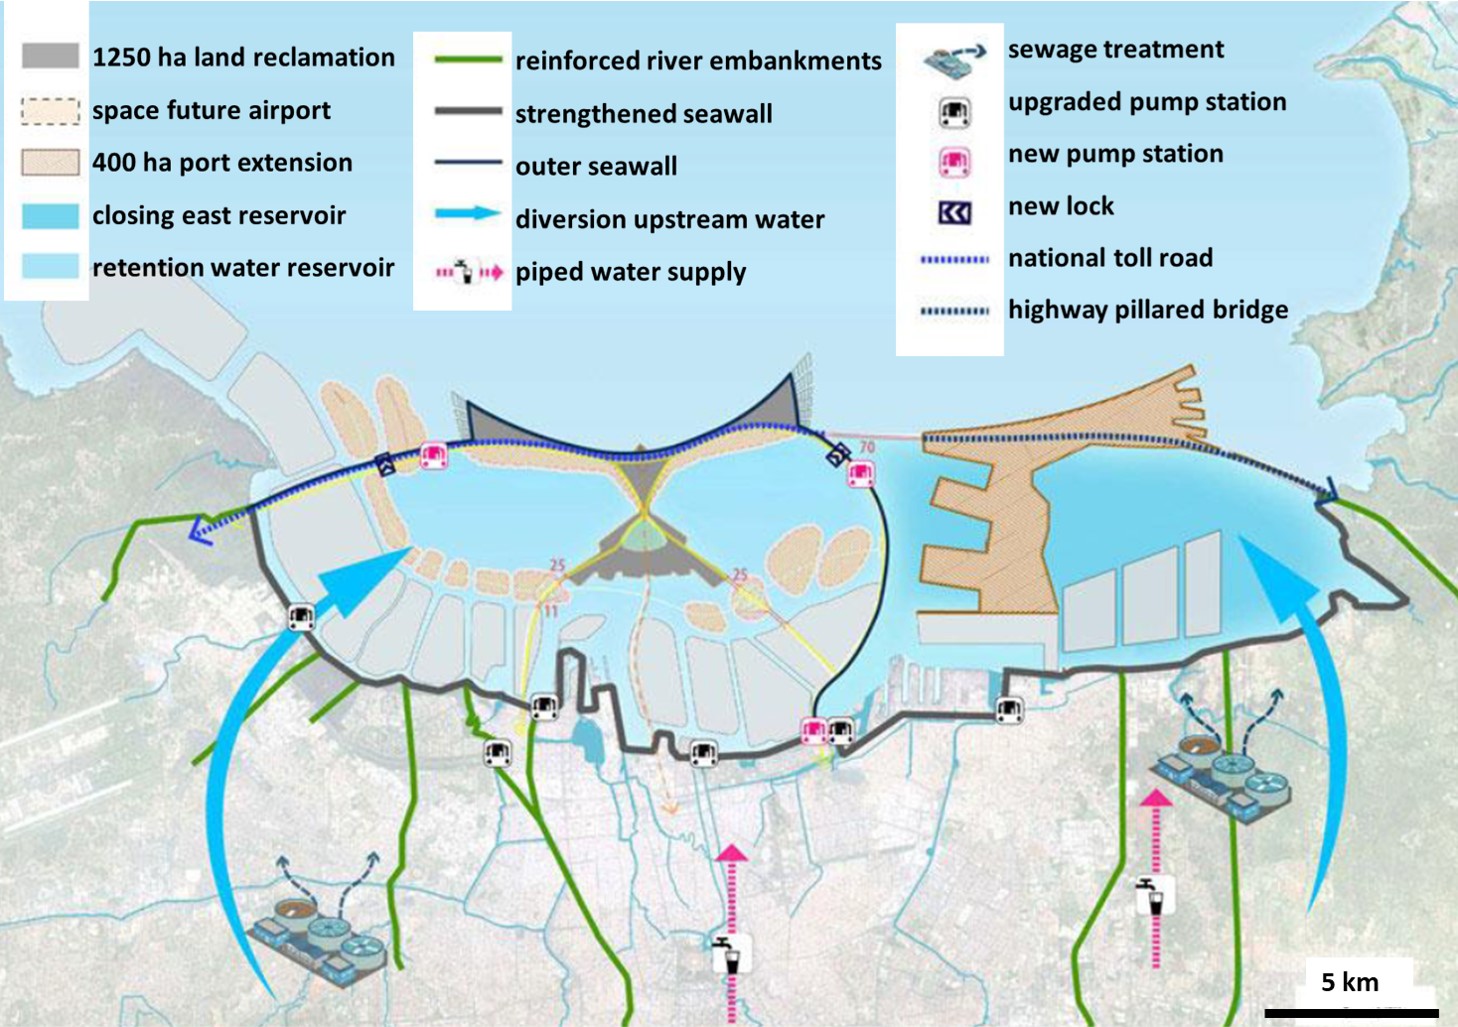
296 KB | Lay-out of the Great Garuda Plan, Jakarta | 1 |
| 21:01, 9 September 2022 | HoChiMinhCityElevation.jpg (file) |  |
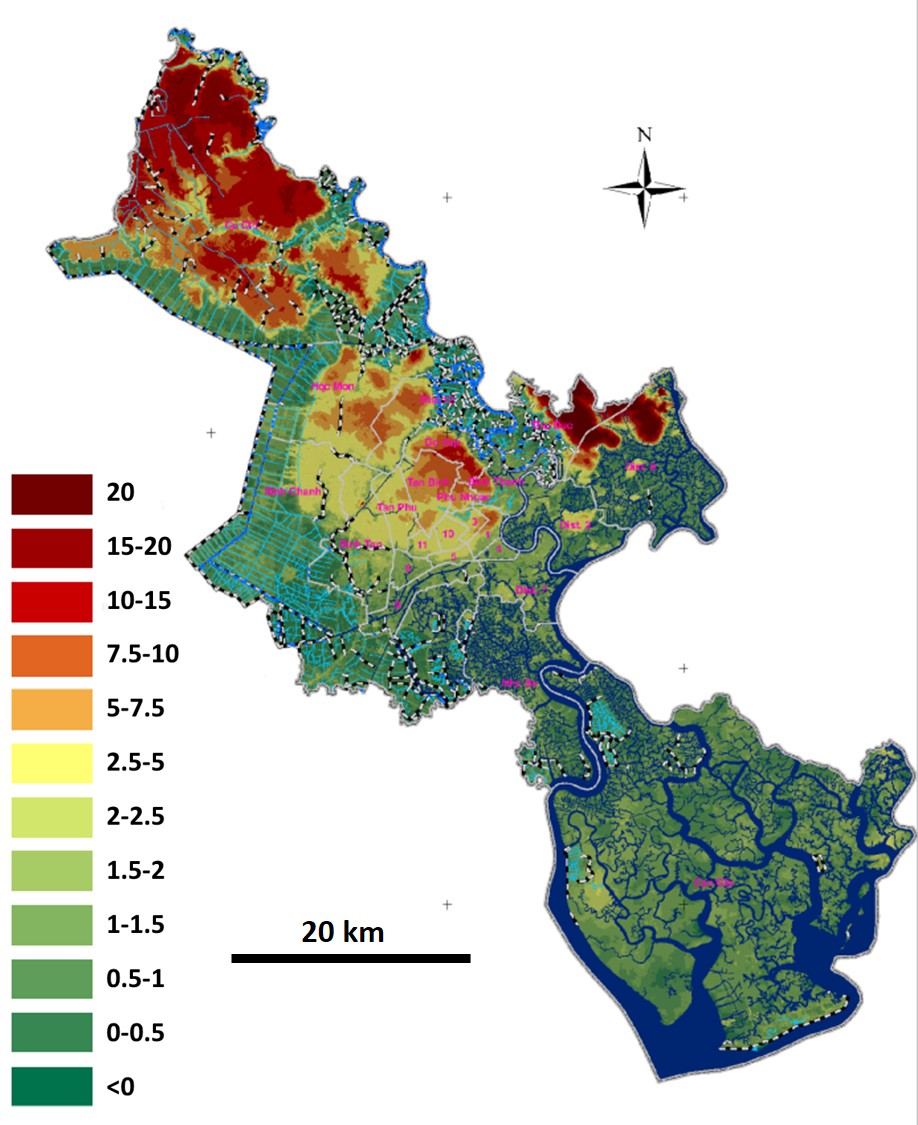
188 KB | Elevation map of Ho Chi Minh City, relative to mean sea level. From Tran Thong Nhat, 2014. | 1 |
| 21:00, 9 September 2022 | BangkokElevationMap.jpg (file) |  |
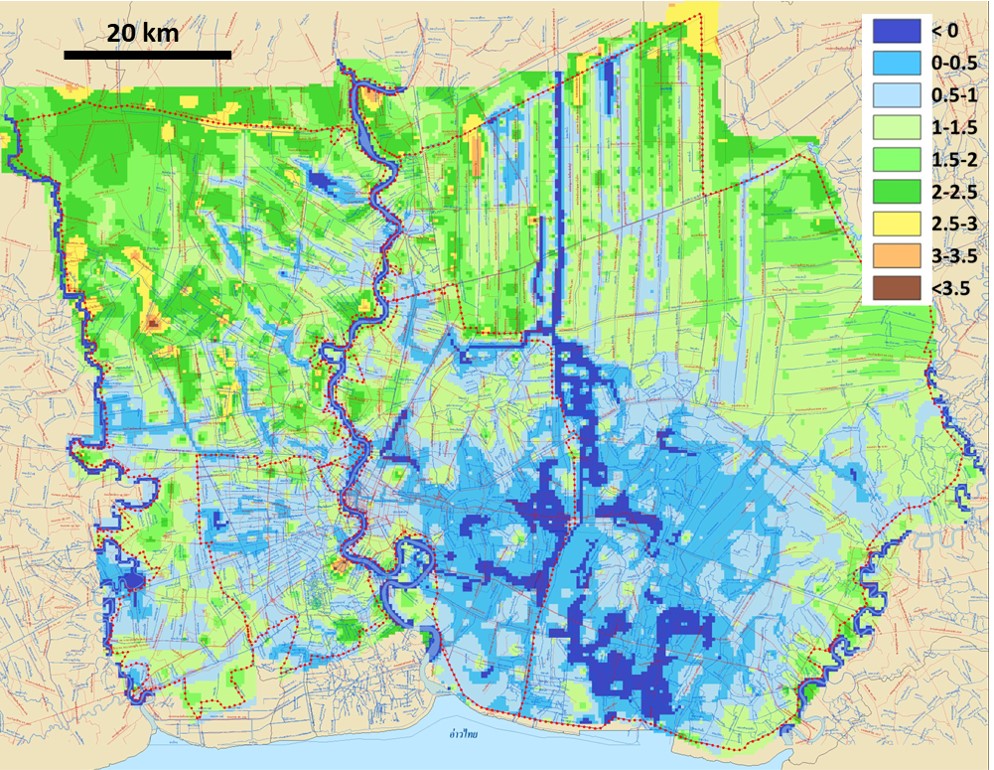
319 KB | Elevation map of Bangkok, meters above mean sea level. Image adapted from https://bkkbaseface.wordpress.com/2011/10/24/bangkok-flood-elevation-map/. | 1 |
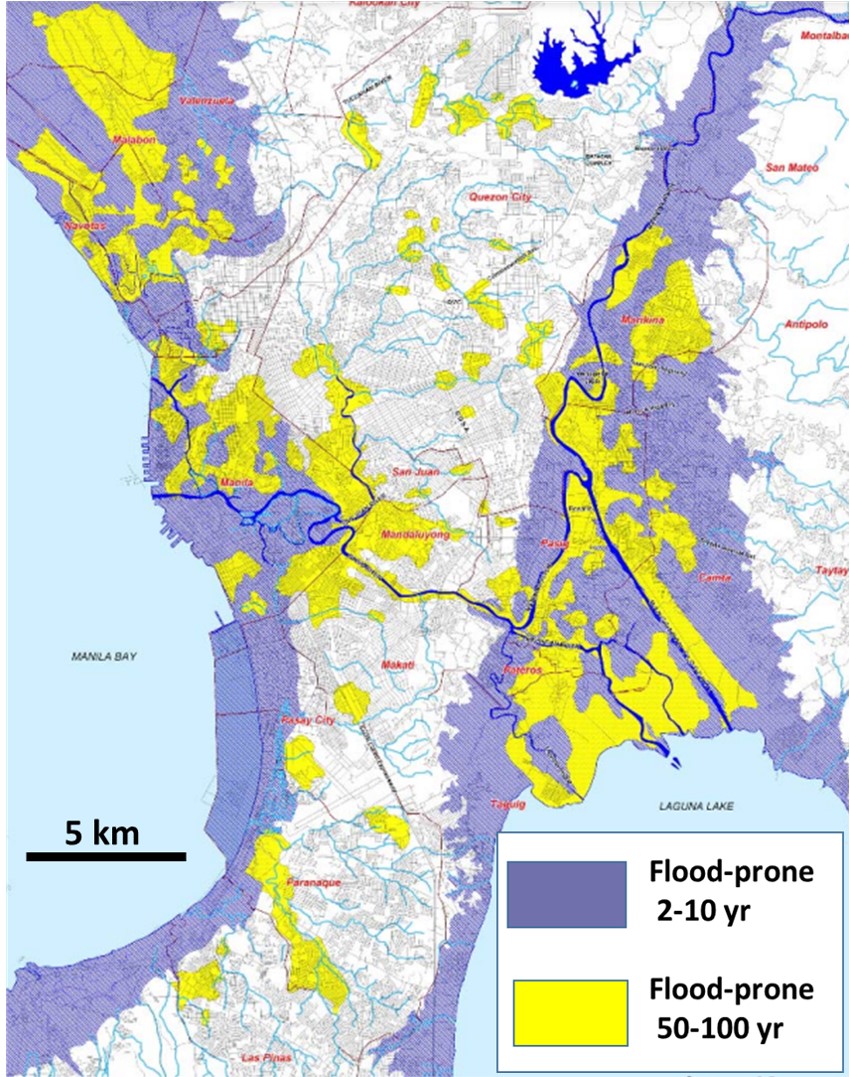
| 20:59, 9 September 2022 | ManilaFloodProne.jpg (file) |  |
279 KB | Flood-prone zones of Manila. Image credit: Government of the Philippines. Mines and Geosciences Budrea. | 1 |
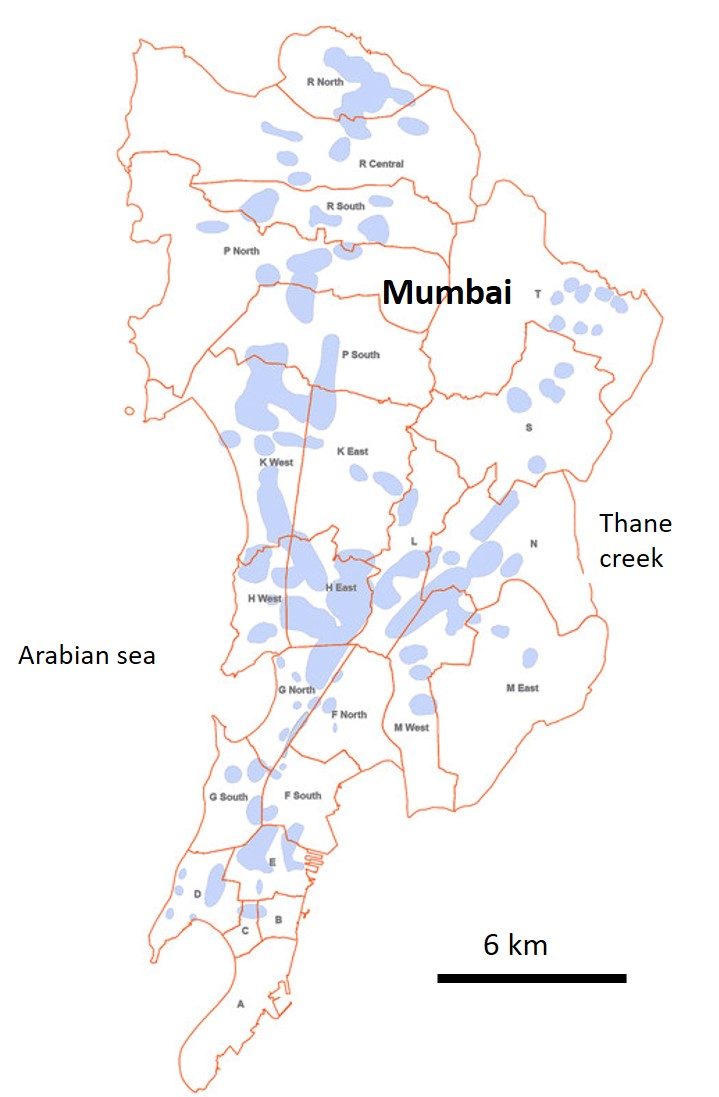
| 20:58, 9 September 2022 | MumbaiFlood2005.jpg (file) |  |
98 KB | Inundated areas during the 2005 flood in Mumbai correspond to the reclaimed low-lying zones in between the former islands. Red lines are district borders. Image from the Fact Finding Committee on Mumbai floods (MCGM 2006). | 1 |
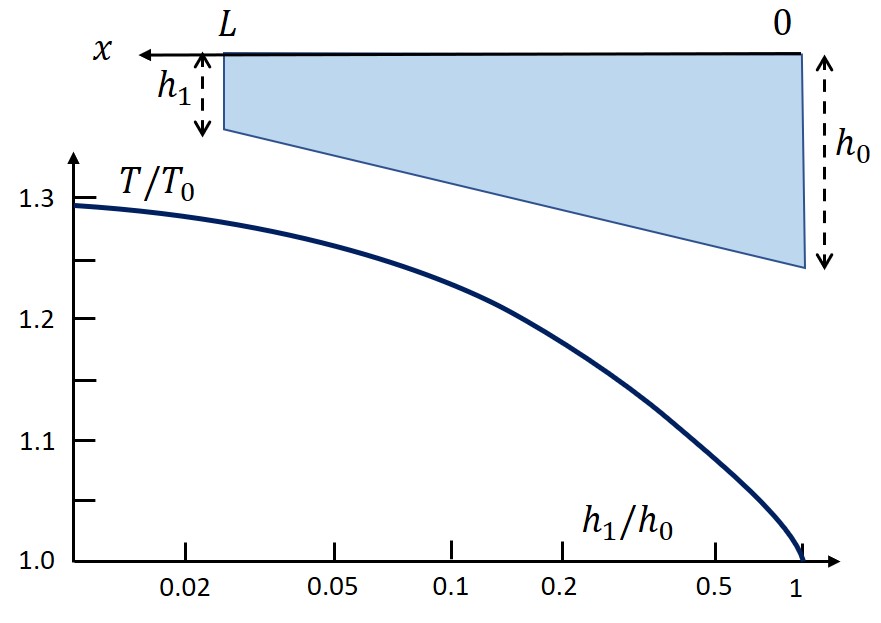
| 20:51, 4 September 2022 | SlopingFloorResonance.jpg (file) |  |
45 KB | Largest resonance period <math>T</math> for a basin with uniformly sloping floor from the mouth (<math>h_0</math>) to the head (<math>h_1</math>), relative to the resonance period <math>T_0</math> for a basin with uniform depth <math>h_0</math>. | 1 |
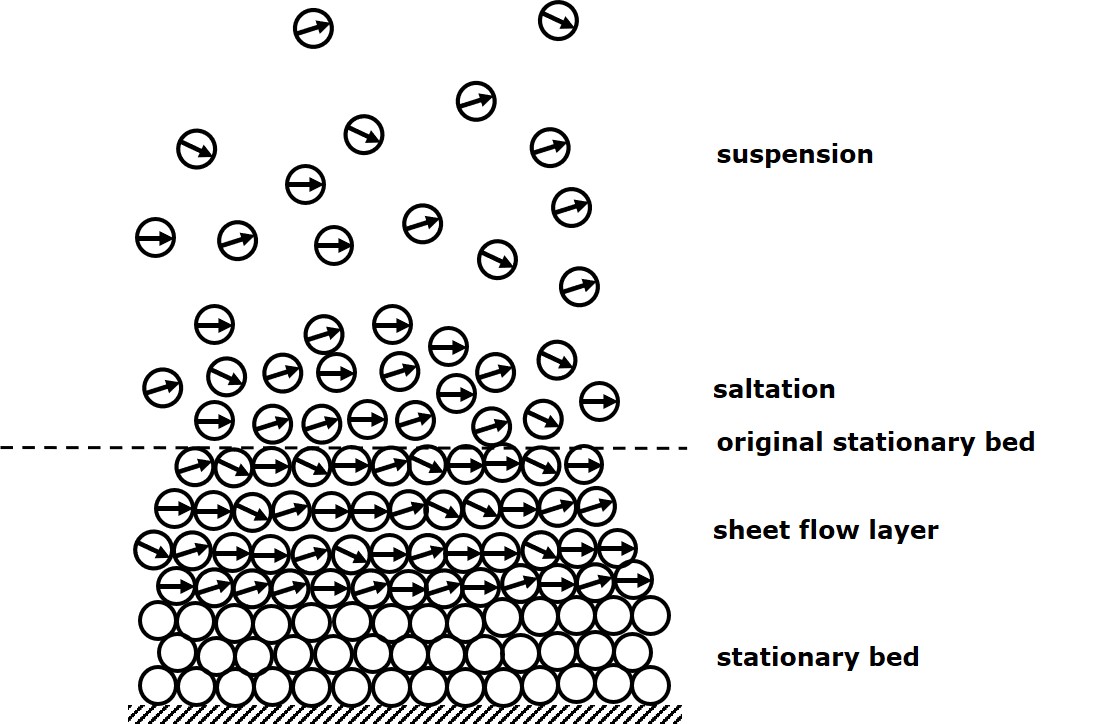
| 16:35, 31 August 2022 | SheetFlow.jpg (file) |  |
153 KB | Under strong wave action is transport in the sheet flow layer the dominant transport mode: more important than bedload transport through saltation and rolling and more important than suspended load transport. | 1 |
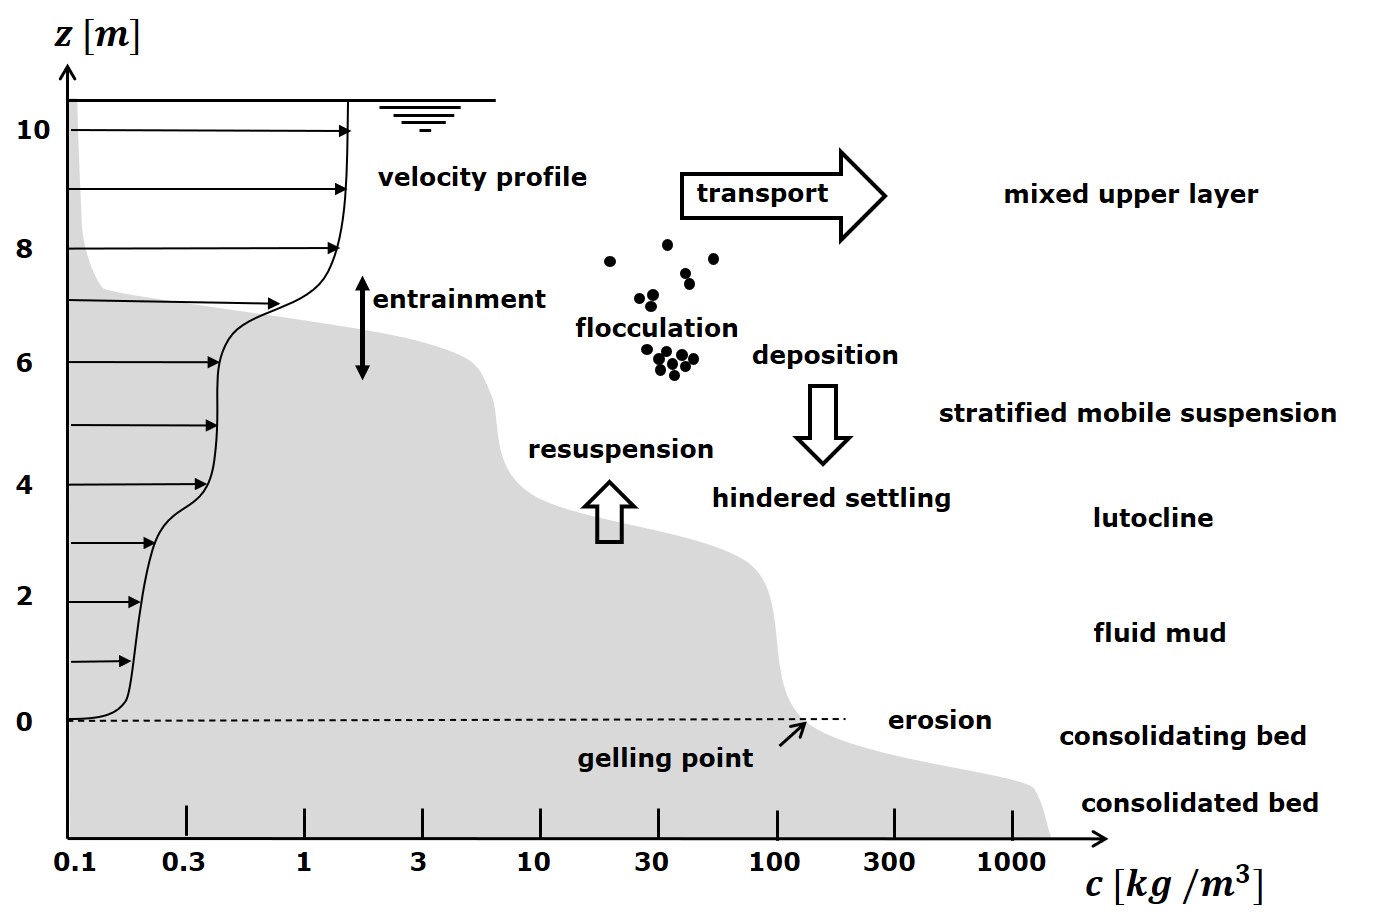
| 09:44, 31 August 2022 | Luto.jpg (file) |  |
124 KB | Schematic representation of suspended sediment layers in a turbid estuary. | 1 |
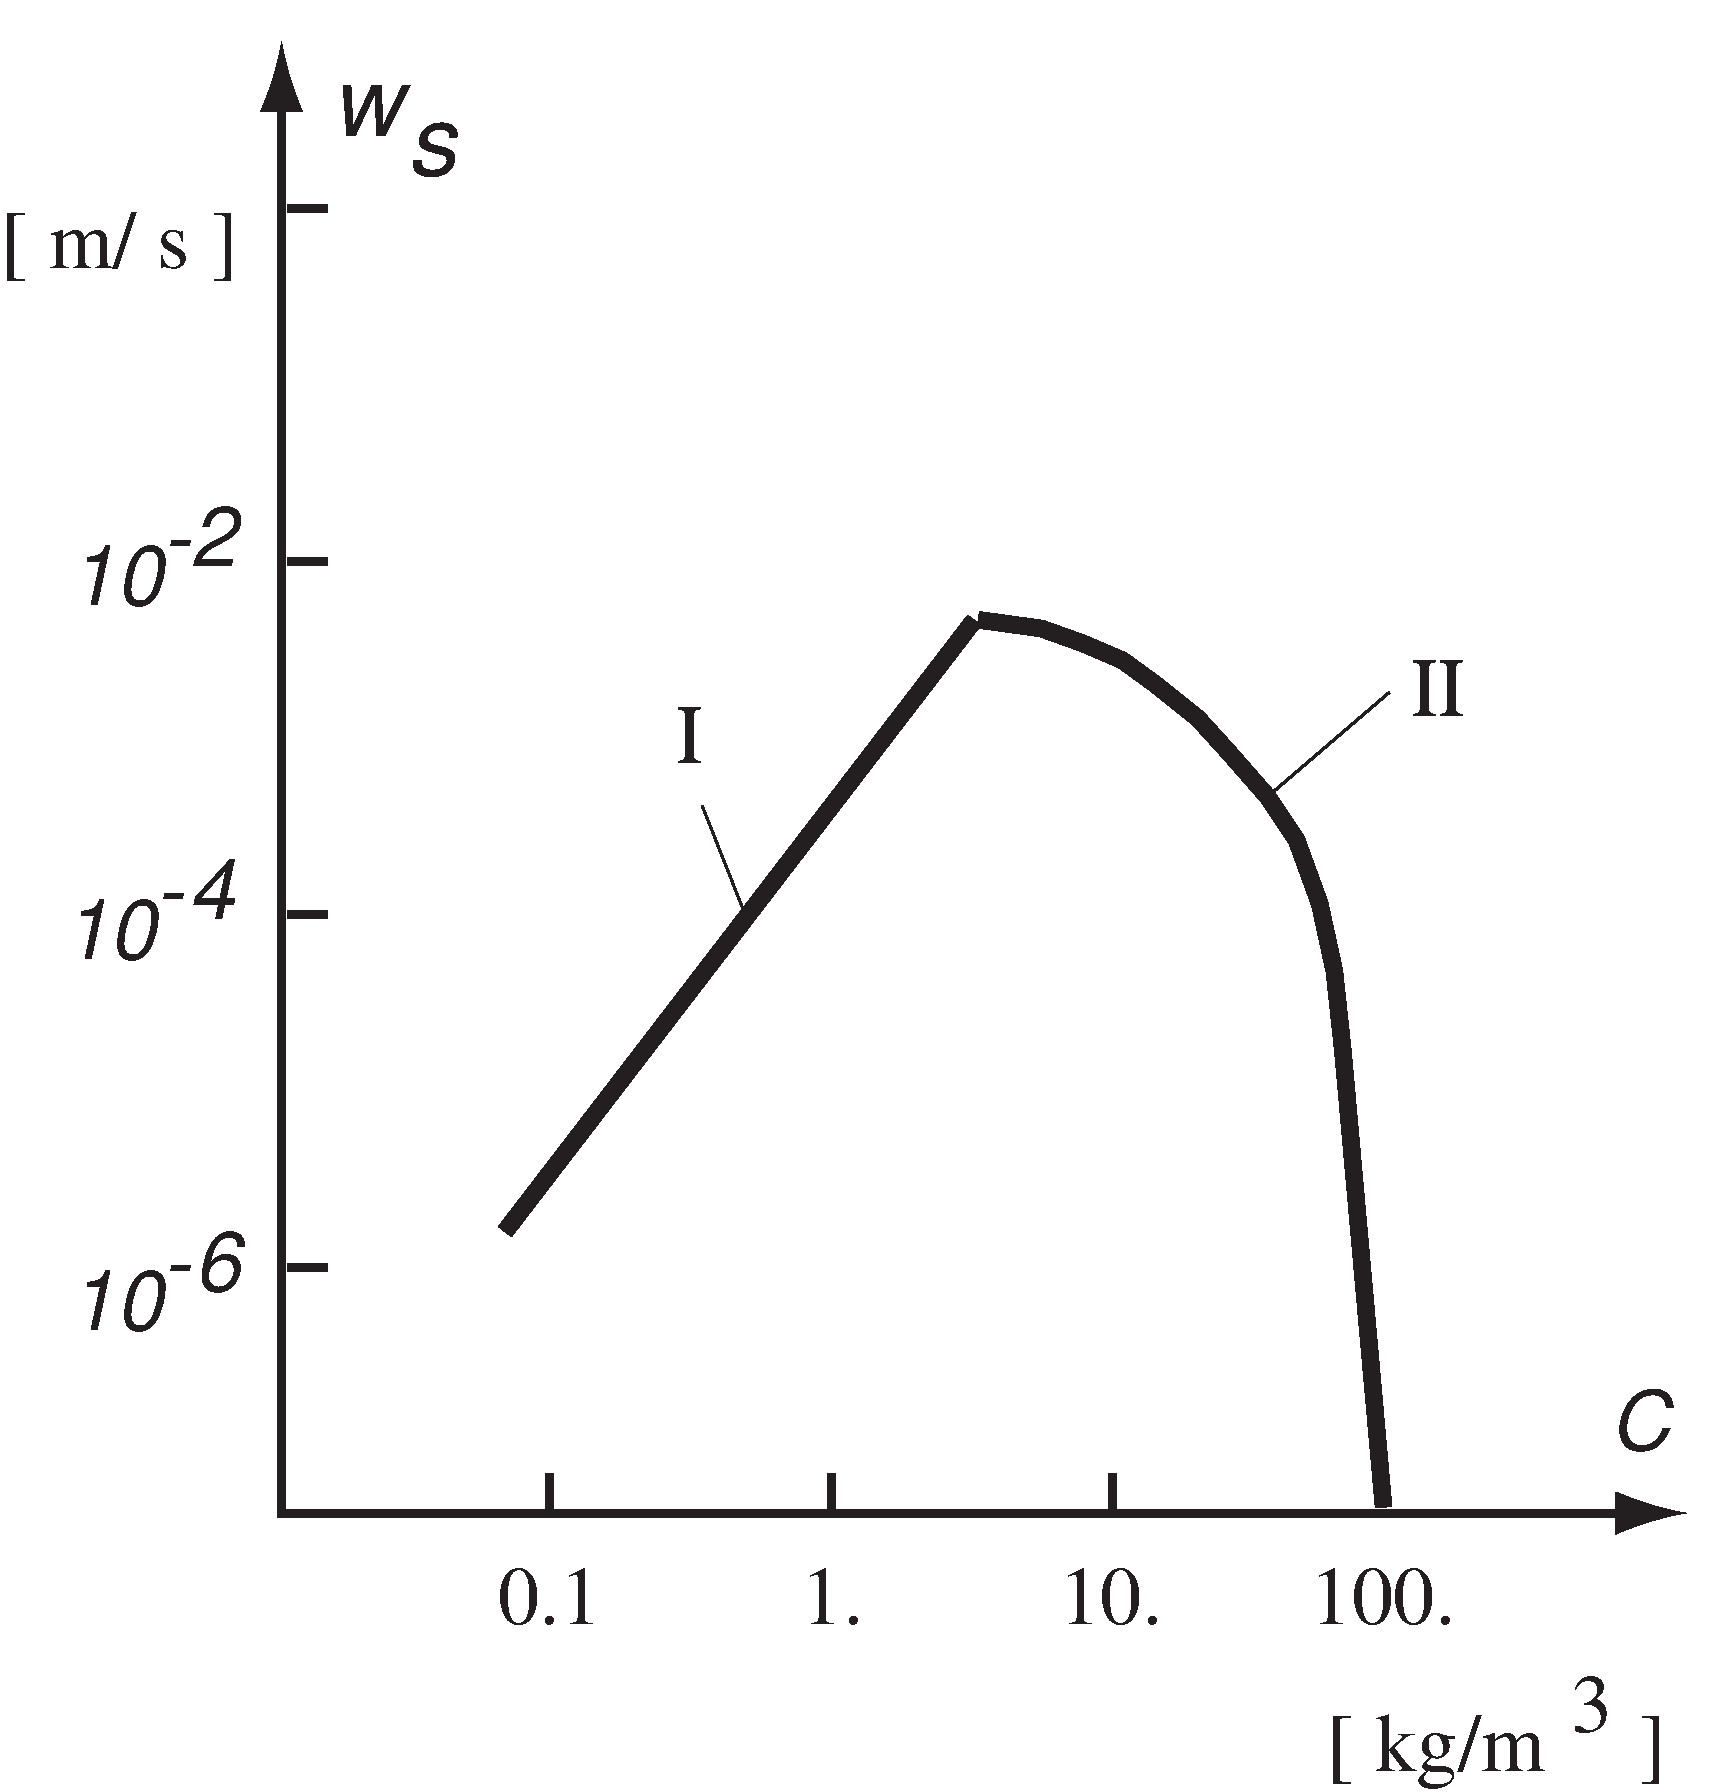
| 09:43, 31 August 2022 | Fallconc.jpg (file) |  |
107 KB | Floc settling velocity as a function of the concentration, after Mehta (1986). | 1 |
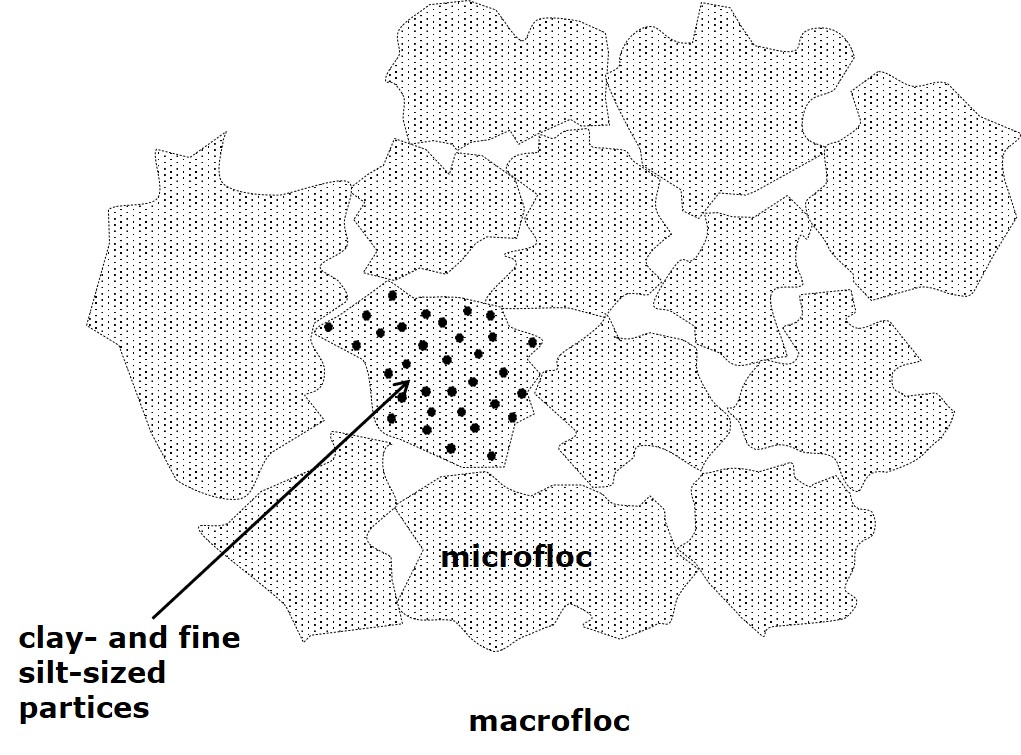
| 21:39, 30 August 2022 | Floc.jpg (file) |  |
293 KB | Schematic representation of a macrofloc made up of a multitude of microflocs. | 1 |
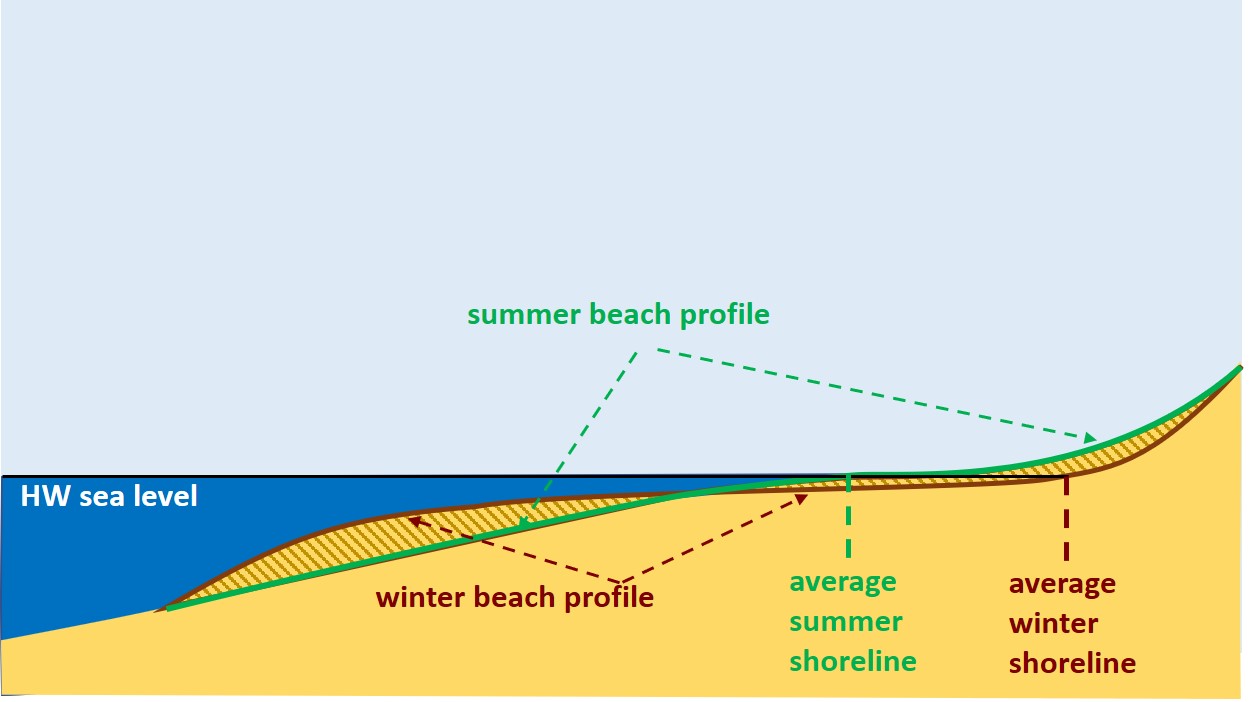
| 14:45, 26 August 2022 | SummerWinterBeachProfile.jpg (file) |  |
74 KB | Schematic representation of summer and winter beach profiles. | 1 |
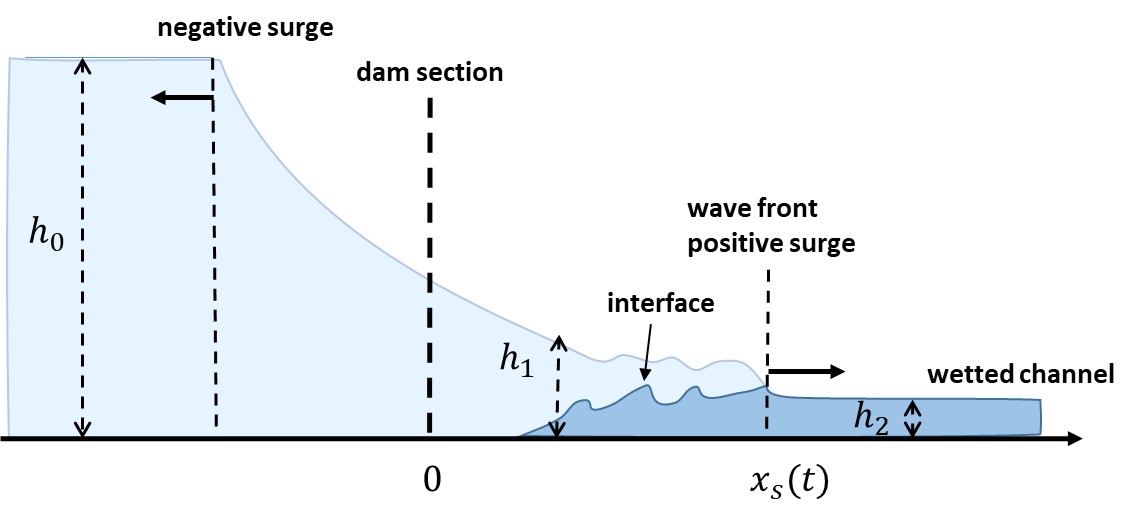
| 15:27, 10 August 2022 | DamBreakWettedChannel.jpg (file) |  |
51 KB | Schematic representation of dam-break flow into a wetted channel of small relative depth. Blue pale: Dam-break wave. Blue: Channel water. The interface is not sharp but diffuse due to strong mixing. | 1 |
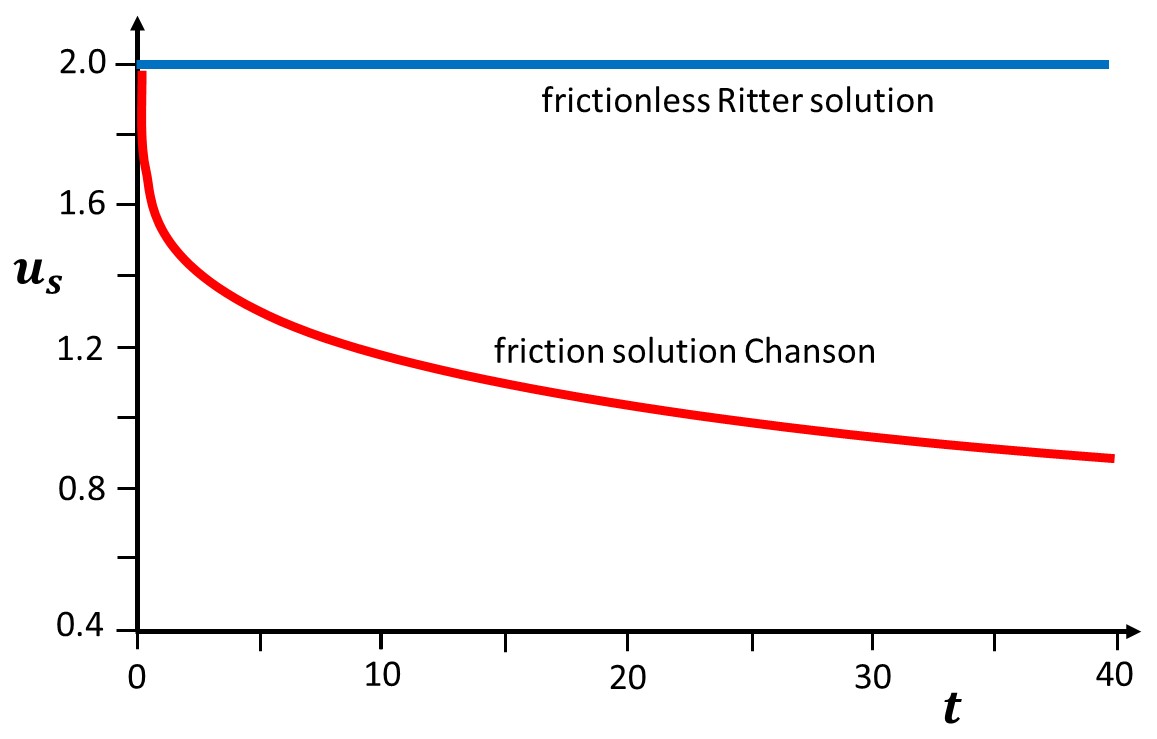
| 15:19, 10 August 2022 | DamBreakFrictionCelerity.jpg (file) |  |
63 KB | The dimensionless celerity of the dam-break wave front as a function of dimensionless time. Blue: The frictionless Ritter solution. Red: The frictional model of Chanson (2009). | 1 |
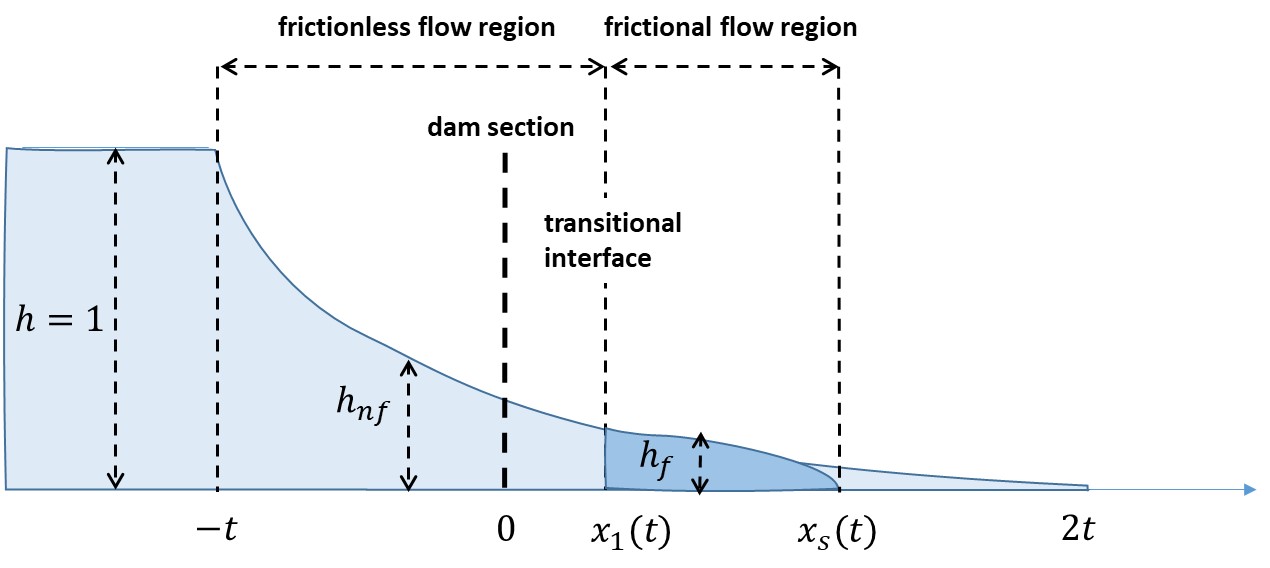
| 15:17, 10 August 2022 | DamBreakFrictionScheme.jpg (file) |  |
61 KB | Schematic representation of frictional dam-break flow according to the model of Chanson (2009). Blue pale: The wave shape following the frictionless solution of Ritter; Blue: The wave shape in the frictional tip region. | 1 |
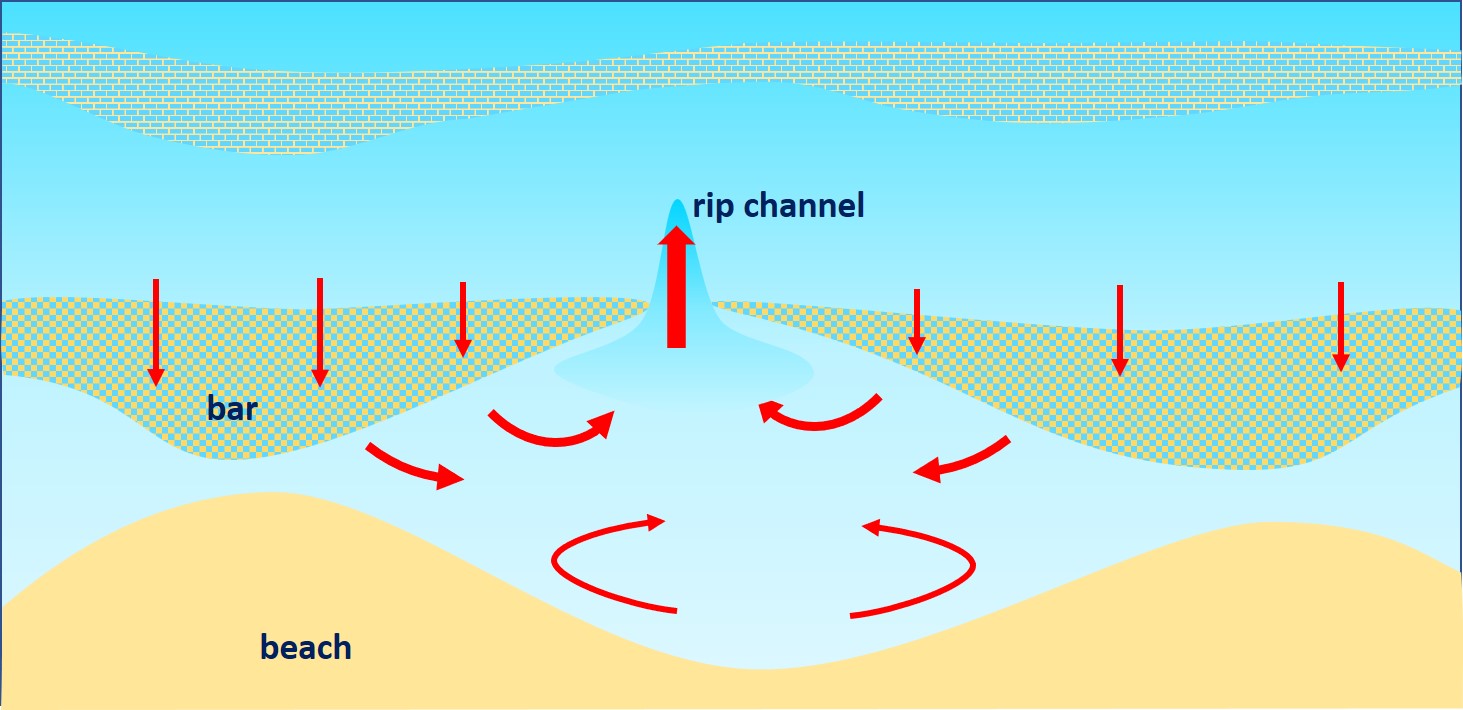
| 18:08, 2 July 2022 | MorphoRip.jpg (file) |  |
184 KB | Schematic view of a rip cell. Beach: yellow, sea: blue; shallow water: light blue; nearshore bars: hatched; flow pattern: red arrows. | 2 |
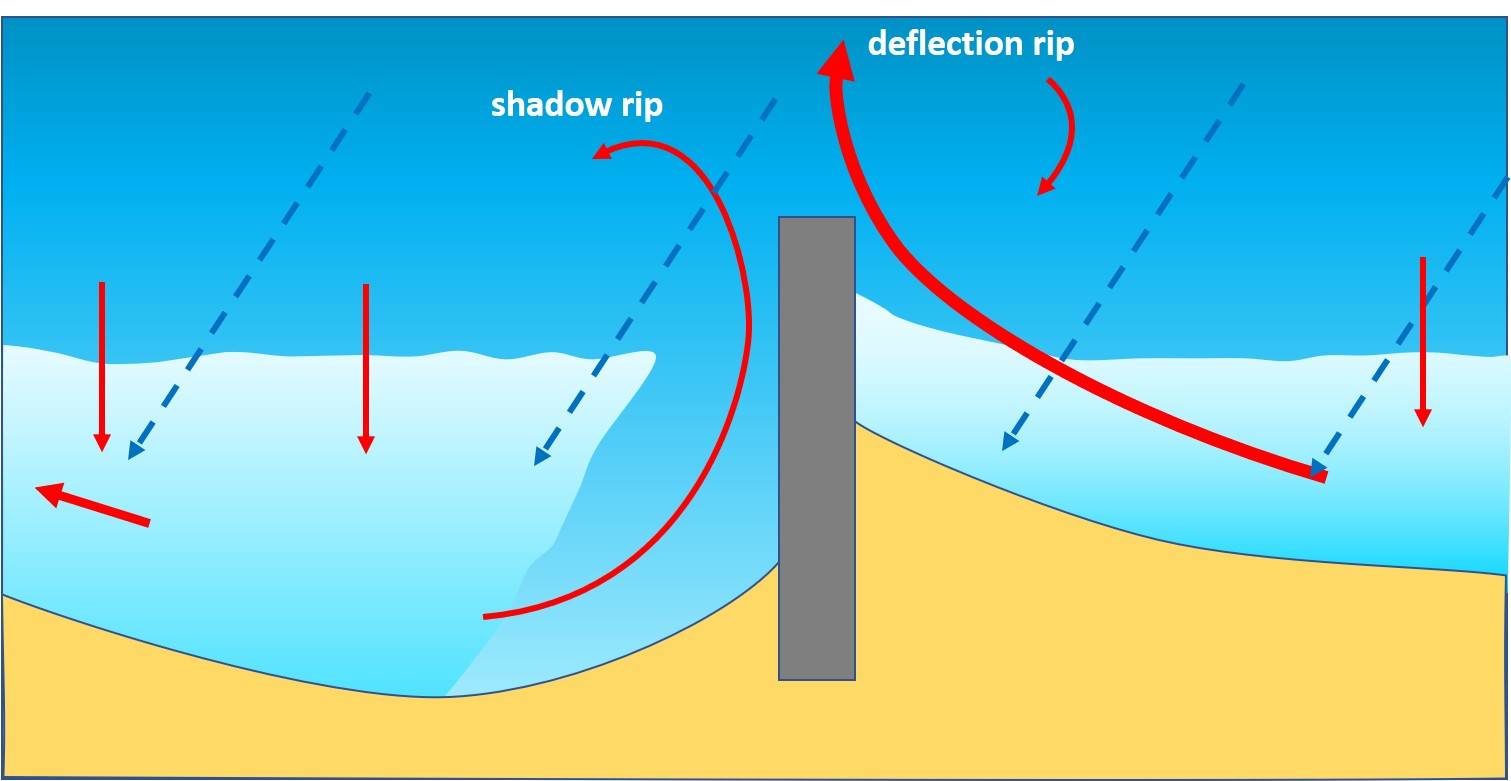
| 18:07, 2 July 2022 | TopoRips.jpg (file) |  |
108 KB | Rip currents induced by a groyne under oblique wave incidence. Updrift side (right): Deflection rip current. Downdrift side (left): Shadow rip current. Beach: yellow; sea: blue; shallow water: light blue; wave breaking: white; rip currents: red arrows;... | 2 |
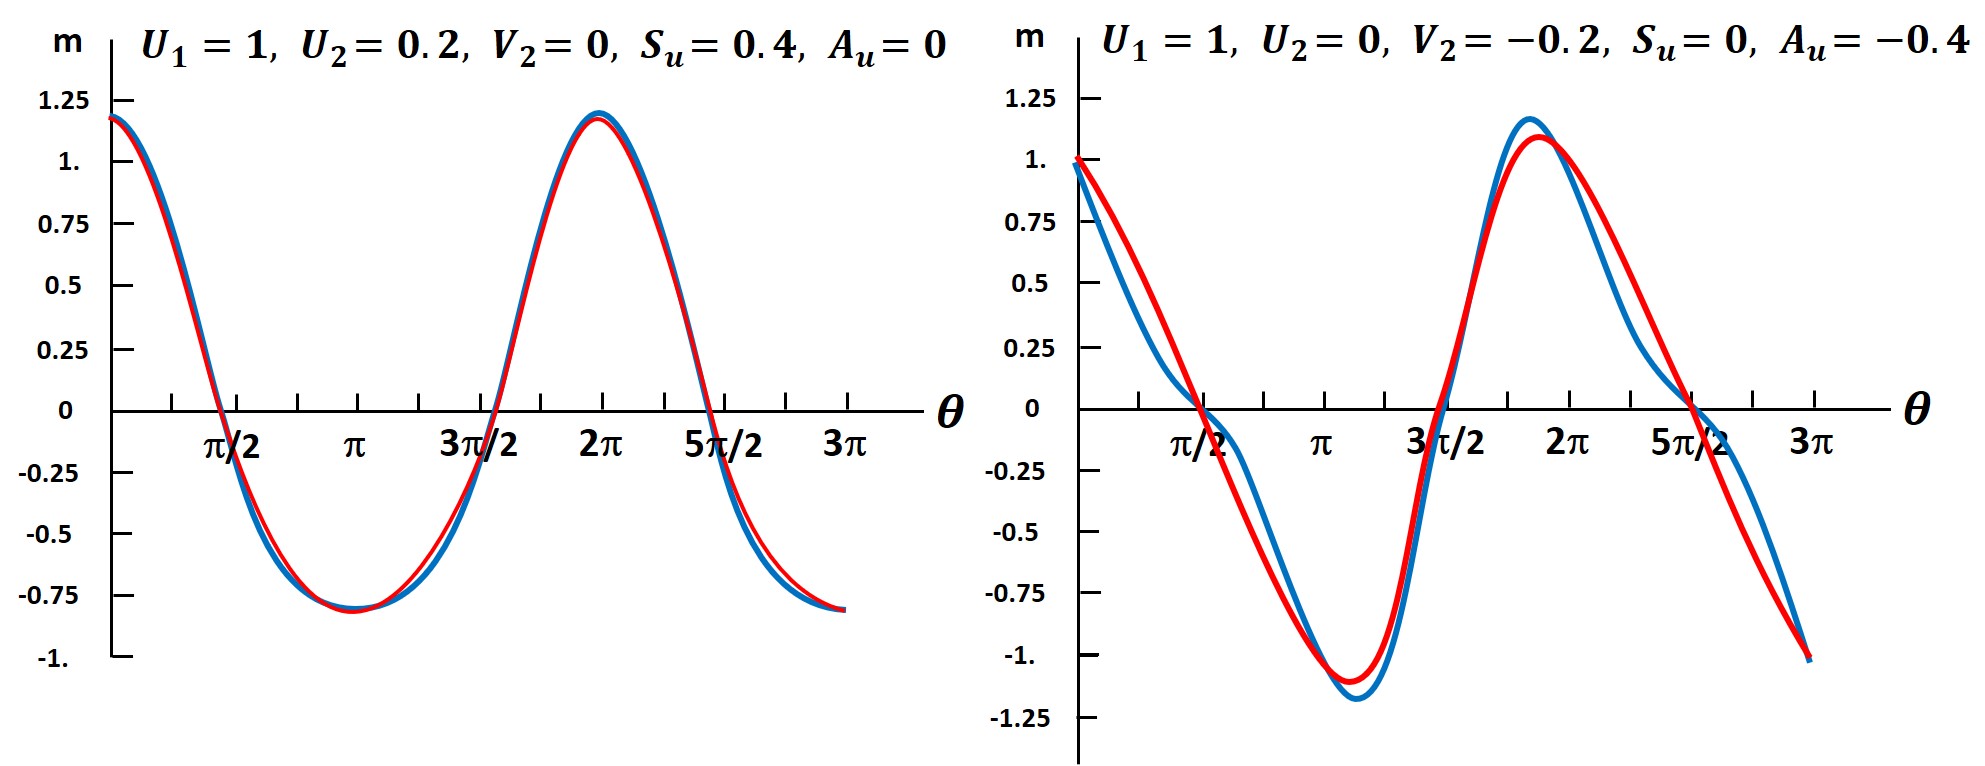
| 18:07, 28 June 2022 | WaveAsymmetries.jpg (file) |  |
149 KB | Wave orbital velocity as function of the phase <math>\theta</math>. Left panel: Velocity skewness. Right panel: Acceleration skewness. Blue lines: Eq. (A1). Red lines: Eq. (A5). | 1 |
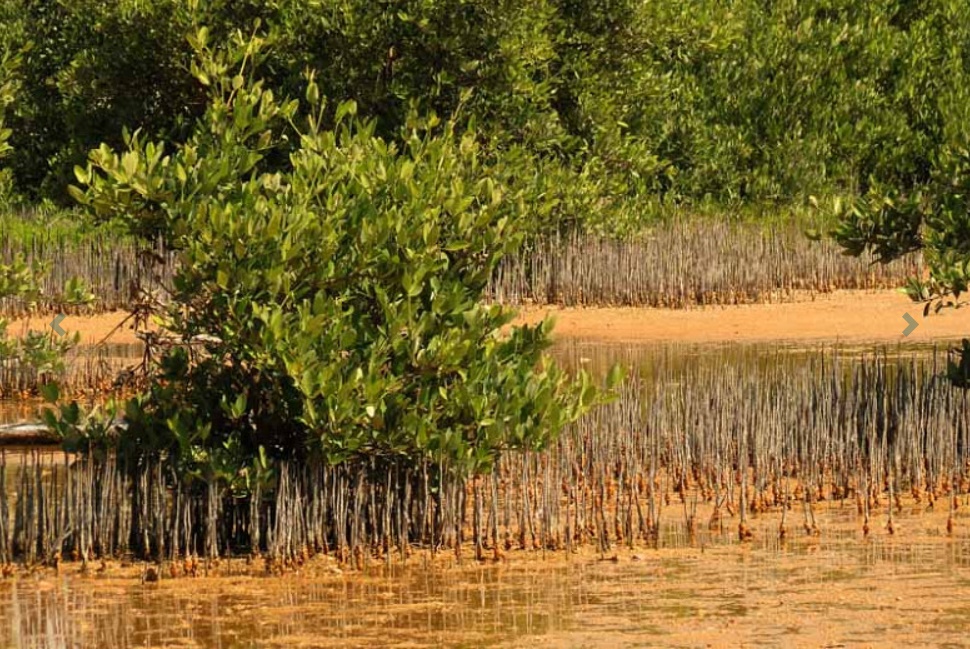
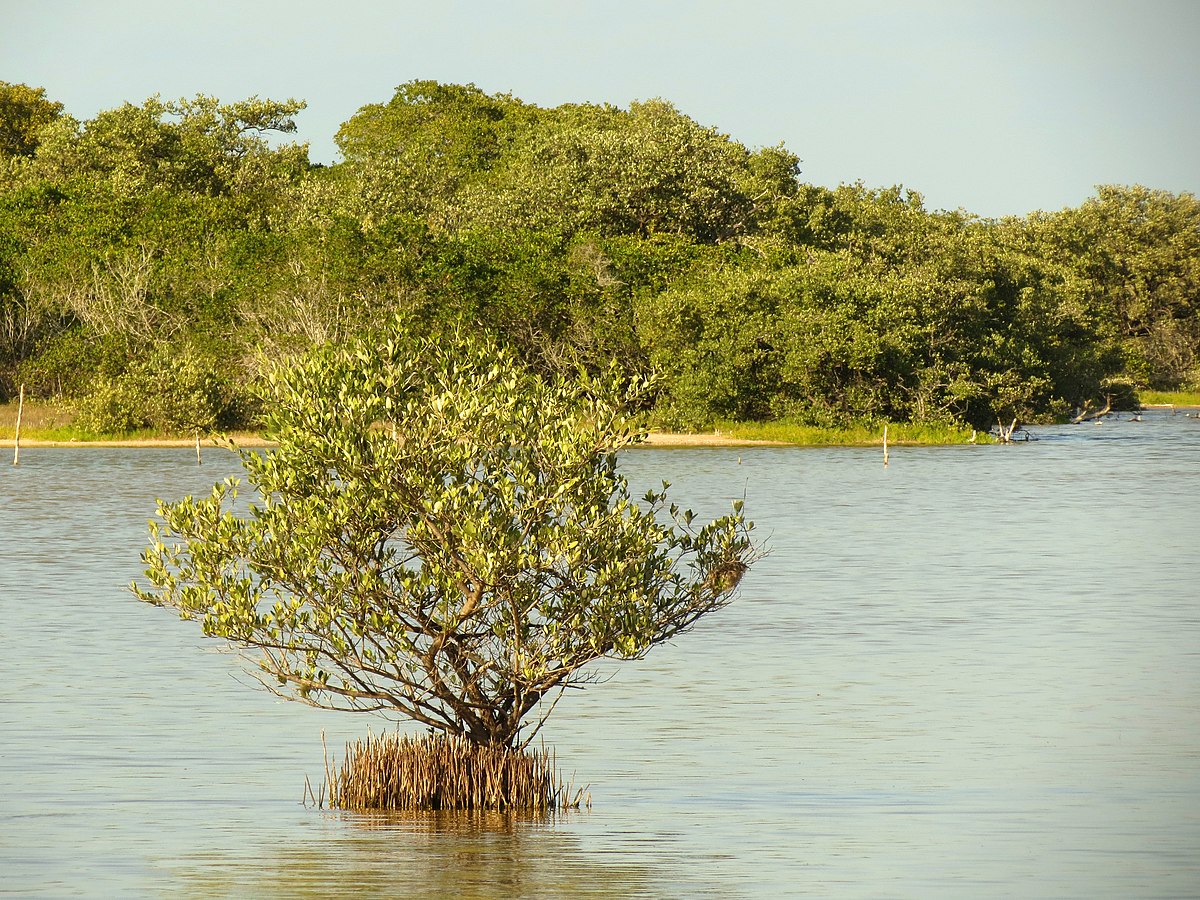
| 16:42, 25 June 2022 | BlackMangrove.jpg (file) |  |
333 KB | Black mangrove (''Avicennia'') | 1 |
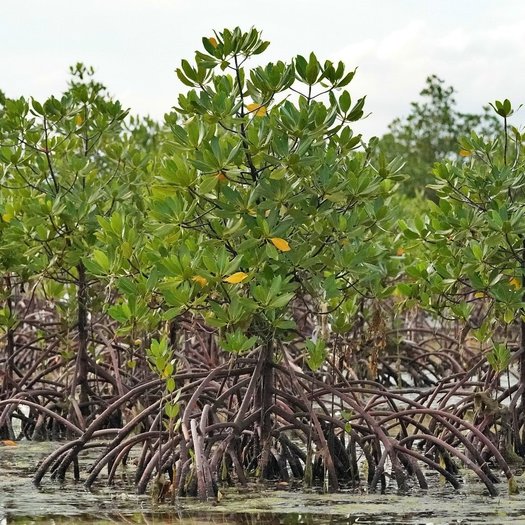
| 16:19, 25 June 2022 | RedMangrove.jpg (file) |  |
104 KB | Red mangroves (''Rhizophora'') | 1 |
| 16:18, 25 June 2022 | BlackMangrove Flickr Commons.jpg (file) |  |
397 KB | Black mangroves (''Avicennia'') | 1 |