European Context of Nutrient Dynamics
Nutrient budgets and fluxes have been established at the local (major rivers) and regional (coastal seas) scales across Europe. Two examples are provided below: (1) a N budget of the continental inputs to the North Sea[1] and (2) a N budget of major riverine inputs and transformations along the Western Scheldt river-estuarine system[2] . Other nutrient budgets have been established, among others, for the Western shelf of the Black Sea [3] and the Baltic Sea[4] . At a smaller scale, detailed estimates of the nutrient sources, transport and transformations are also available for the Seine and Humber continuums[5] ,[6] .
North Sea

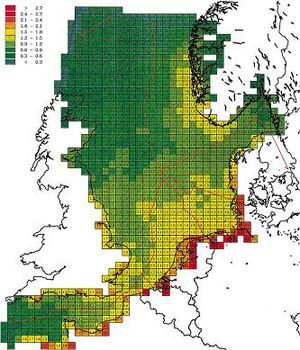
The continental inputs of nitrogen to the North Sea originate from rivers, atmospheric inputs and, to a much smaller extent, direct discharges and dumping[1]. The riverine contributions are summarized in Table 1 and, collectively, amount to almost twice that of atmospheric inputs[8]. Figure 2 shows the spatial distribution of the total atmospheric N deposition to the North Sea. The spatial pattern results from the distribution of the source areas and precipitation rates. On average, deposition amounts to 0.9 ton N per km2, with deposition up to 50% higher than average around territorial waters of Belgium, the Netherlands and Germany. Approximately 60% of total atmospheric N deposition results from combustion (nitrogen oxides) and approximately 40% from agricultural activities (ammonia) [7] .
| River | N | P | Si |
|---|---|---|---|
| Firth of Forth | 20 | 186 | 11 |
| Tyne/Tees | 14735 | 593 | 9309 |
|
Humber |
60636 | 5891 | 17928 |
| Thames | 26214 | 3786 | 14931 |
| Ems | 25736 | 614 | 6805 |
| Noordzeekanaal | 10877 | 1767 | 3912 |
| Lauwer | 333 | 143 | 25 |
| Lake IJssel/Kornwerderzand | 12320 | 461 | 3588 |
|
Lake IJssel/Den Oever |
21232 | 80 | 5170 |
| Meuse | 91159 | 4400 | 34402 |
| Rhine | 191543 | 14194 | 69623 |
| Scheldt | 31670 | 2116 | 15077 |
| Yzer | 267 | 109 | 37 |
| Elbe | 126314 | 3822 | 34520 |
| Jade | 8 | 3 | 2 |
| Schleswig-Holstein river | 8 | 3 | 2 |
| Weser | 52862 | 3420 | 18470 |
| Danish rivers | 1227 | 513 | 136 |
The Western Scheldt Estuary

The Scheldt River and its tributaries drain 21,580 km2 in northwestern France, northern Belgium and southwestern Netherlands[10] . The Scheldt estuary is a a macrotidal system, with an average residence time in brackish waters of 1 to 3 months. The mixing zone of fresh and salt waters extends over a distance of 70 to 100 km. The area of tidal influence goes up to 160 km from the river mouth and includes the major [11] .
The hydrographical basin includes one of the most heavily populated regions of Europe, where highly diversified industrial activity has developed. As a consequence, the whole catchment was heavily polluted until the mid 1970s, when water degradation culminated due to the continuous increase of nutrient and organic mater inputs. The level of wastewater treatment, especially in the upstream zones, was an important factor contributing to this degradation. The estuary was particularly affected by domestic and industrial inputs from the great Brussels, Antwerp and Gent areas[2] . Since then, better management of industrial and domestic wastewater point sources has led to a progressive improvement of the environmental conditions in the estuary. Billen et al. (2005) [12] and Soetaert et al. (2006) [13] provide two recent comprehensive reviews of this long term evolution.
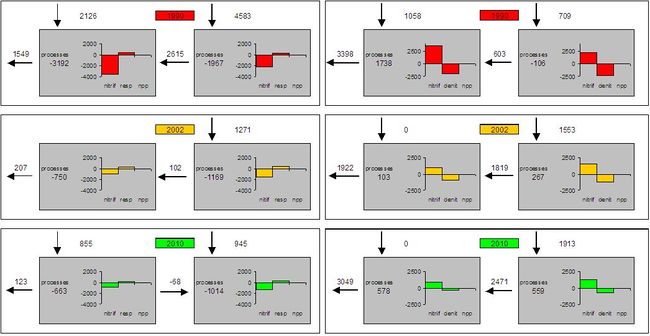
A mass budget for nitrogen has been established for the saline estuary (km 0 to100) and for the tidal river network (km 100 to 160) of the Western Scheldt for the summer months[2] . Three periods have been analyzed (1990, 2002 and 2010). This allows for the assessment of the influence the secondary and tertiary wastewater treatment in the catchment on the N dynamics. Figure 3 shows that the tidal river and the estuary contribute almost equally to the overall biogeochemical cycling of N, despite the very different volumes involved. For the simulated periods, the large decrease in N input (> 55 %) expected between 1990 and 2010 will not lead to a significant decrease of N export to the coastal zone during the summer period.
REFERENCES
- ↑ 1.0 1.1 Galloway, J., W. Chlesinger, H. Levy, A. Michaels, and J. Schnoor (1995), Nitrogen fixaton: Anthropogenic enhancement and environmental response, Global Biogeochemical Cycles 9, 235-252.
- ↑ 2.0 2.1 2.2 2.3 Vanderborght, J-P, I. Folmer, D. Rodriguez Aguilera, T. Uhrenholt, and P. Regnier (2007), Reactive-transport modelling of a river-estuarine coastal zone system: application to the Western Scheldt, Marine Chemistry 106, 92-110.
- ↑ Gregoire, M., and J. Friedrich (2004), Nitrogen budget of the northwestern Black Sea shelf inferred from modeling studies and in situ benthic measurements, Marine Ecology Progress Series 270, 15-39.
- ↑ Wulff, F., L. Rahm, A. - K. Hallin, and J. Sandberg (2001), A nutrient budget model of the Baltic Sea. Chapter 13 A systems analysis of the Baltic Sea. Ecological Studies, F. Wulff, L. Rahm, and P. Larsson Eds., (Springer Verlag) Vol 148, pp 353-372.
- ↑ Garnier, J., G. Billen, and M. Coste (1995), Seasonal succession of diatoms and Chlorophyceae in the drainage network of the Seine River: observations and modeling, Limnology and Oceanography 40, 750-765.
- ↑ Tappin, A.D., J.R.W. Harris and R.J. Uncles (2003) The fluxes and transformations of suspended particles, carbon and nitrogen in the Humber Estuary (UK) from 1994 to 1996 : results from an integrated observation and modelling study. The Science of the Total Environment 314/316, 665-713.
- ↑ 7.0 7.1 Hertel, O., C. Ambelas Skjøth, L.M. Frohn, E. Vignati, J. Frydendall, G. de Leeuw, U. Schwarz, and S. Reiset (2002), Assessment of the atmospheric nitrogen and sulphur inputs into the North Sea using a Lagrangian model, Physics and Chemistry of the Earth 27 ,1507 – 1515.
- ↑ Jickells T.D. (1998), Nutrient Biogeochemistry of the Coastal Zone, Science, 281 217 – 222
- ↑ Radach, G., and H.J. Lenhart (1995), Nutrient dynamics in the North Sea: Fluxes and budgets in the water derived from ERSEM, Netherlands Journal of Sea Research 33, 301-335.
- ↑ Wollast, R. (1988), The Scheldt estuary. Pollution of the North Sea: An Assessment, W. Salamons, B.L. Bayne, E.K. Duursma, and U. Forstner Eds., (Springer-Verlag, Berlin) pp. 183-193.
- ↑ Regnier, P., R. Wollast, and C.I. Steefel (1997), Long-Term Fluxes of Reactive Species in Macrotidal Estuaries. Estimates from a Fully Transient, Multi Component Reaction-Transport Model, Marine Chemistry 58, 127-145.
- ↑ Billen, G., J. Garnier, and V. Rousseau (2005), Nutrient fluxes and water quality in the drainage network of the Scheldt basin over the last 50 years. Ecological structures and functions in the Scheldt Estuary: from past to future. P. Meire, and S. Van Damme Eds. Hydrobiologia 540(1-3), 46-67.
- ↑ Soetaert, K. J.J. Middelburg, C. Heip, P. Meire, S. Van Damme, and T. Maris (2006), Long-term change in dissolved inorganic nutrients in the heterotrophic Scheldt estuary (Belgium, The Netherlands), Limnology and Oceanography 51, 409-423.
EXTERNAL LINKS
- ELOISE Nutrient Dynamics in European Water Systems ONLINE
- ELOISE Nutrient Dynamics in European Water Systems in pdf format
- Case studies
- LOICZ Land-Ocean Interactions in the Coastal Zone