Case study risk analysis of marine activities in the Belgian part of the North Sea
With any kind of marine activity there is also the possiblility of some risk. In this case study a risk analysis of marine activities in the Belgian part of the North Sea has been conducted. Shipping activities within this area as well as the main hazards have been considered. A release assessment has also been considered looking at accident frequency, accident consequence and spill risk.
Contents
Introduction
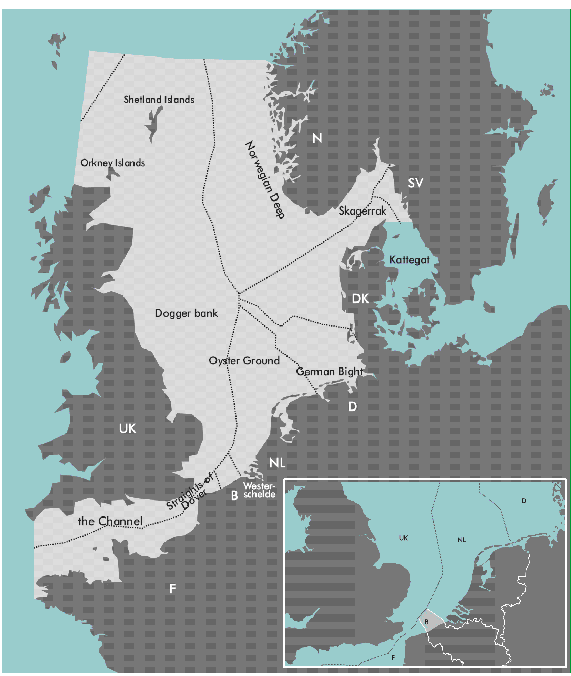
The Belgian Part of the North Sea (BPNS) is an intensely used marine area with several associated environmental risks. The total sea area of the BPNS is estimated at 3.600 km2. Although it is only a small part of the southern North Sea, it contains one of the most intensive merchant shipping routes in the world. Neighbouring North Sea countries are France, The Netherlands and The United Kingdom (see fig. 1).
Besides shipping, the BPNS is also used for a wide and increasing variety of human activities. All these human activities are posing a certain danger to the environment.
However, the frequency of incidents with environmental damage and the severity of the results are only poorly known. To be able to keep the risk (the product of probability and impact) of unwanted incidents as low as reasonably feasible and/or acceptable, appropriate technical and organisational measures need to be defined and taken. Such preventative and mitigating measures can only be taken on the basis of a sound analysis of the risks involved. It is in this light that the "Risk Analysis of Marine Activities (RAMA) in the Belgian Part of the North Sea" research was conducted.
Problem formulation and hazard identification
Focus of the risk analysis
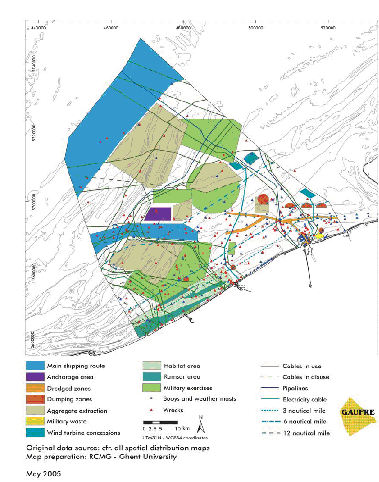
At the Belgian part of the North Sea several human activities take place that are posing a certain danger to the marine environment (see fig. 2).
Shipping will be the major contributor to marine incidents resulting in environmental damage. The RAMA project will therefore focus on the impact of accidental pollution (oil and chemicals) of shipping on the Belgian Part of the North Sea. Due to lack of data not all sea-traffic is included in the study (see table 1):
| Included | Not included | |
|---|---|---|
| Shipping | Merchant Shipping
Ferry Dredgers |
Navy
Pleasure crafts/recreational Fishing |
| Other | Aviation
Gas transport by pipelines Tourist activities Wind farms Non-shipping activities related to fisheries, recreation, sand & gravel exploitation, dredging & dumping, off-shore construction |
Except for aviation and gas transport (relative minor risk for oil or gas pollution), the environmental risk of the other activities will mainly be the impact caused by physical disturbance (sediment, noise, etc.). These impacts are beyond the scope of this study. In addition, there is a lack of knowledge associated with the west-east traffic route (transit) in the northern strip of the BPNS. This traffic is thus not included in the analysis.
Shipping in the BPNS
Due to restraints in depth and dangerous currents caused by the sand banks, the merchant shipping is restricted to certain shipping lanes (including Traffic Separation Schemes). Most of the maritime traffic is situated in the Westhinder and Noordhinder Traffic Separation Schemes (TSS) and the shipping lane to the Scheldt estuary and the Zeebrugge port (Scheur). The remaining routes are sailed by coastal vessels and ferries. The BPNS includes one anchorage area, located at the Westhinder TSS near the entrance of the obligatory pilotage area.
The source of the data is the IVS-SRK database from the Vessel Traffic administration and ferry transports (Harbour Oostende). The study covers data from a one-year period (1st April 2003 until 30th March 2004). Shipping data analysis indicates a total of 57.791 voyages (or about 320.000 ship movements) taking place on the shipping routes of the BPNS during the April 2003-March 2004 period. The general conclusions of the shipping analysis are:
- about 25 % of the total number of voyages are ferry transports;
- tankers (generally the environmentally most hazardous products) take about 12 %;
- in total approximately 1.500 different products (oils and other hazardous substances) were transported;
- crude oils are transported in relatively high quantities;
- bulk carriers also transport high quantities of dangerous goods (total average of 34 425 ton/voyage);
- 40% of the transport on the BPNS consists of dangerous goods (oils and Hazardous & Noxious Substances (HNS));
- 60% of the dangerous transport is in packaged form, 40% in bulk.
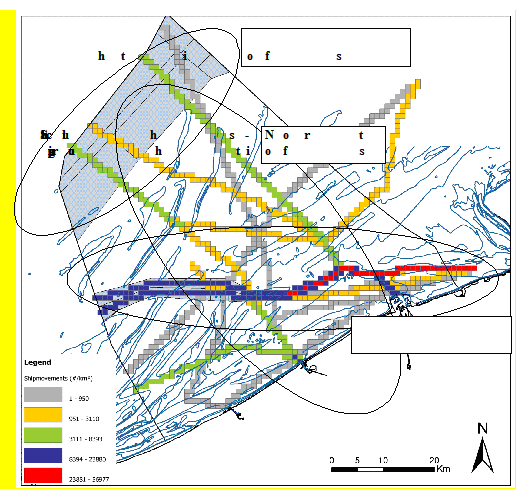
There are 3 well-defined groups of shipping routes (see fig. 3). The majority of the registered movements take place in the southern part of the North Sea (West-East cluster traffic not included).
Main hazards
During the hazard identification step, an assessment is made of what can go wrong. Given the focus of RAMA on shipping, historical ship accident data indicates that almost all open-water shipping losses (excepting causes such as war or piracy) can be categorised into the following generic accident types:
- ship-ship collisions
- powered groundings
- drift groundings
- structural failure/foundering whilst underway
- fire/explosion whilst underway
- powered ship collisions with fixed marine structures such as platforms or wind turbines
- drifting ship collisions with fixed marine structures such as platforms or wind turbines
Release assessment
Release assessment is the identification of the potential of the risk source to introduce hazardous agents (oil and HNS) into the marine environment.
In RAMA, the quantitative estimation of the probability of release has been approached from both the historical and the modelling approach. Despite the long-time series of historical accidents (1960-2003), the release assessment based on the historical approach was considered inadequate due to lack of relevant spill quantity data, difference in reporting trends which may lead to an underestimation of number of accidents.
Consequently, a release assessment based on a modelling approach was applied to the Belgian Part of the North Sea (BPNS) based on the ship movement analysis described above. This approach was based on the Marine Accident Risk Calculation System (MARCS) developed by Det Norske Veritas. This is a release assessment model quantifying maritime accident frequencies and accident consequences (for more information see Le Roy et al., 2006). Accident frequency (or probability) calculation is based on Fault Tree Analysis or historic accident/incident to calculate the "accident frequency factors" and on shipping lane data and environmental specific data. Accident consequence calculation on its turn is based on Event Tree Analysis or historic accident consequence data to calculate the "accident consequence factors". In MARCS, the environmental accident consequences include chemical and oil spills.
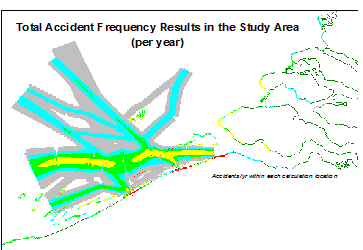
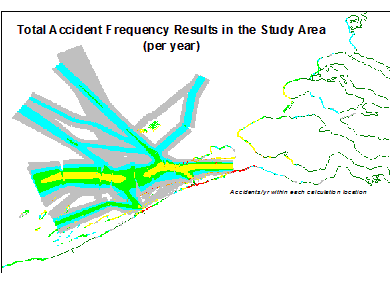
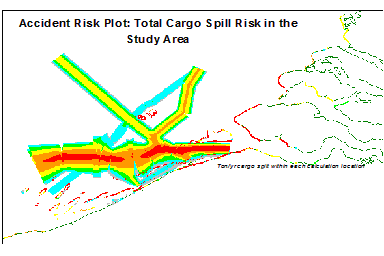
The assessment encompassed an accident frequency analysis, an accident consequence (spill frequency) analysis and an spill risk distribution assessment.
HOW OFTEN WILL IT HAPPEN OR ACCIDENT FREQUENCY ANALYSIS
|
|
HOW BAD WILL IT BE OR ACCIDENT CONSEQUENCE ANALYSIS (spill frequency)
| |
WHERE IS IT LIKELY TO HAPPEN OR SPILL RISK
|
In conclusion, the results of the marine risk analysis of the BPNS based on the MARCS model show that:
- risk parameters, such as accident frequency (accidents per year) and cargo spill risk (tonnes of cargo spilled per year) tend to follow the number of vessel-miles defined in the shipping pattern input data. The quality of this input data is therefore of critical importance to the output from this risk analysis;
- the risk reduction measures that are predicted to be effective are those that may reduce the frequency of powered grounding and collision accident types, such as pilotage, vessel traffic services and traffic separation schemes;
- the total frequency of dangerous goods spilling accidents is once every 3 years;
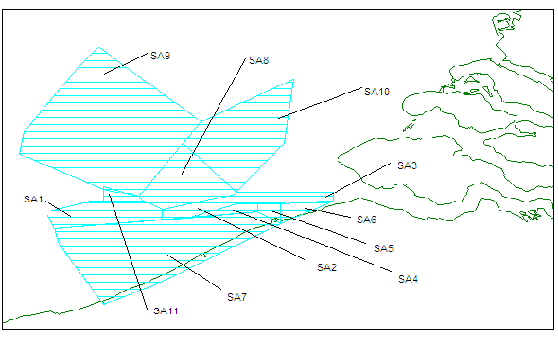
- the highest risk is predicted in subarea SA3 (the entrance of the Scheldt estuary);
- the highest risk is predicted to arise from spillage of Class 8 (Dangerous goods, with insufficient product information) from containers;
- Cargo spill risks of the two most dangerous product classes vary between 12,3 tonnes per year (Class 1: Marine Pollutants + category A products) and 101 tonnes per year (Class 2: crude oils).
Description of the effects of the incidents
Incident scenarios
The analysis of probability of occurrence of incidents and the release assessment was done for 8 different ship types, 7 types of accidents and 10 cargo types. A discussion of the effects of all these scenarios is unfeasible in the time frame of the project. Therefore a selection of two incident scenarios was made:
- worst case scenario of an oil spill (crude oils (CT2); 17.000 ton/accident);
- worst case scenario of a HNS spill (acetone cyanohydrine (CT1); 8.000 & 1.000 ton/accident).
The impact analysis is primarily aimed at estimating the impact on different biological communities. Focus has been directed towards birds, fish and benthic organisms. As far as possible the ecosystem approach is guarded during this impact analysis. If an ecosystem approach was not feasible for certain incidents, indicator species are used to estimate the impact.
Sensitivity analysis
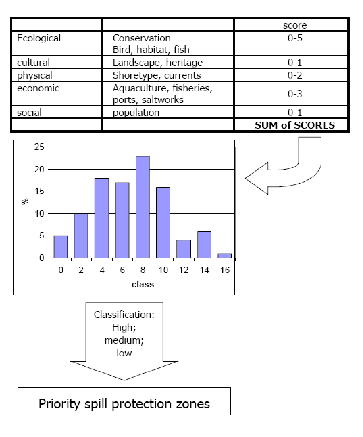
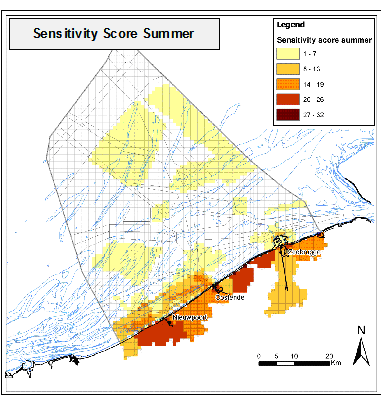
To be able to assess correctly the impacts, a sensitivity-analysis was carried out including besides biological values also socio-economical parameters. The sensitivity analysis (see fig. 7) is set up to identify the vulnerable areas in the coastal and marine zone of Belgium. As the interests (sensitivity) of the different users of the BPNS vary in time, three different scenarios leading to different sensitivity maps have been identified as the impact and response to a spill will also depend on these seasonal interests:
- general scenario: a scenario in which all parameters are evenly important;
- summer scenario: a scenario in which the tourist and recreational values of the coastal and marine areas have been given special attention (see fig. 8);
- winter scenario: a scenario in which the nature values (wintering-, foraging- and spawning areas) of the coastal and marine areas have been given special attention.
In general, the western part of the Belgian marine zone (Flemish Banks area), the area around the harbours of Zeebrugge and Oostende neighbouring the important coastal municipality Blankenberge-De Haan are the most sensitive zones for spills in terms of ecological (focus marine waters/ winter scenario) and socio-economical value (focus coastal municipalities/ summer scenario).
Effect analysis
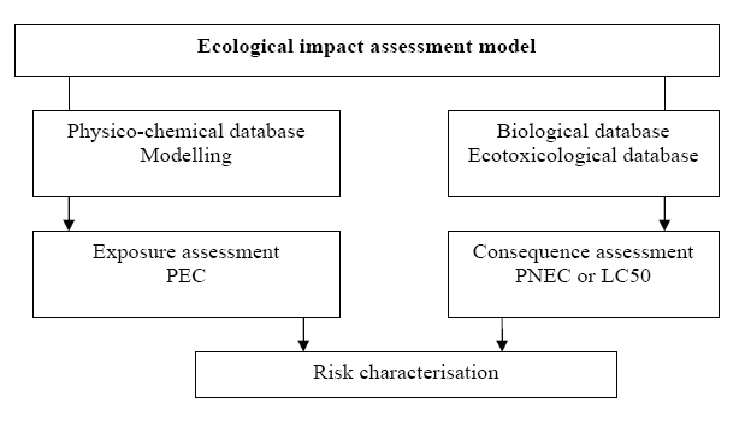
The effect analysis of the selected scenarios is restricted to an ecological impact assessment (see fig. 9). The effect analysis is subdivided into three Environmental Risk Assessment (ERA) steps:
- exposure assessment quantifying the Predicted Environmental Concentration (PEC) based on the calculated release rates and spill models;
- the consequence assessment estimating the consequences or effects of release in terms of the Predicted No Effect Concentration (PNEC) or the 50% mortality Concentration (LC50);
- the risk characterisation (ecological impact) based on the PEC/PNEC or PEC/LC50 ratio.
Due to the lack of quantitative data, assumptions have been made in both scenarios (oil & HNS). Furthermore, in contrast to oil spills, a specific operational chemical model estimating the magnitude of the HNS spill does not currently exist in Belgium. The best approach is however been obtained by using the sediment transportation model as a basis for the chemical spilled. So the ecological impact assessments can certainly be improved. However, the results can be interpreted as representing worst case effects and show the possible outcomes/magnitude of a selected oil and HNS spill. It is a first attempt of an ecological impact assessment for both an oil and HNS spill and should be refined when new methodologies become available. The effect of oil and chemical spills is different. Oil spills have an effect both in the open sea and on the beach (stranding), while the effect of a HNS spill is generally be limited to the marine area. In contrast to HNS spills, oil spills have a severe impact on the bird population. In our case study the total number of bird casualties is estimated at about 471 birds (open sea) and 3336 birds (Zwin). Due to the physio-chemical characteristics of the hazardous products the assessment of the ecological impact area is also different. A generalisation of results is thus not possible.
Risk estimation
The overall estimation of the risk is defined as the multiplication of the consequence for each damage-causing event with the frequency of that event. The frequency of an event is a result of the hazard identification and release step. The consequence of a damage-causing event is usually defined as casualty probabilities (direct loss (mortality)).
The risk of commercial shipping at the BPNS can be summarised as follows (see fig. 10):
- the highest risk can be found in the high risk subareas SA3, SA5, SA6, SA7 (range once every 13 (SA3) to 43 (SA6) years) characterised by sandbank formations and/or presence of harbour (intense shipping traffic is not the determining factor (f.ex. SA1 (every 119 yr)) ;
- in the first place oil tankers and container ships pose a high risk for almost the total BPNS due to the fact that they transport the most hazardous cargo types and that in case of a spill accident high quantities of dangerous goods are spilled at sea (related to high transported quantities) (Max. cargo spill quantity per year in SA3: 124 ton (oil tankers) & 247 ton (containers));
- secondly also transport with chemical tankers and RoRo traffic are risk full, in particular in the high risk subareas, respectively due to the hazardous characteristics of the products transported by chemical tankers (notice the low spill quantity) and a medium frequency (Max. in SA3: every 150 yr) and spill quantity (Max. in SA3: 24 ton/yr) of accidents with RoRo ships;
- the risk from bulk, general cargo and other (passenger ships & other ships) transport is rather low.
References
References for environmental risk assessment.
Please note that others may also have edited the contents of this article.
|
