File:BiomassAbundancePlot.jpg
From Coastal Wiki
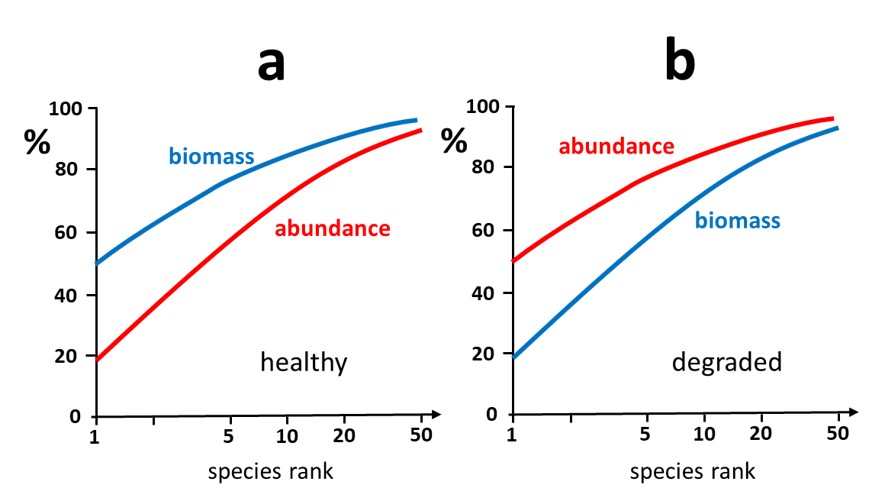
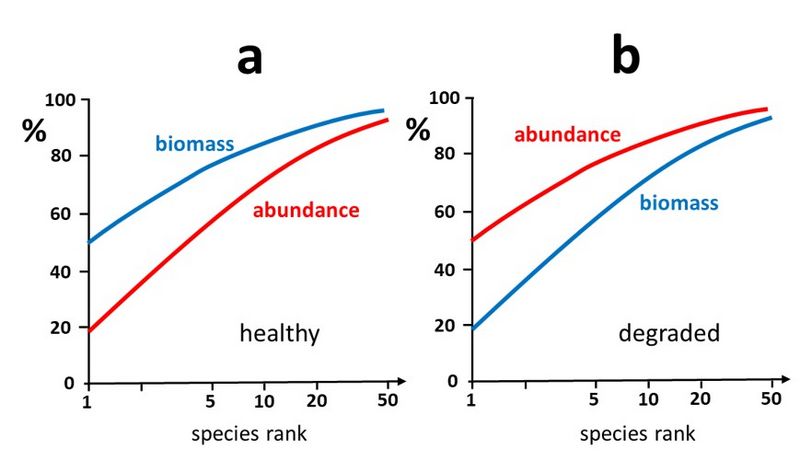
Revision as of 20:45, 18 April 2023 by Dronkers J (talk | contribs) (Comparison of k-dominance for abundance and biomass. a. Typical plot for a healthy ecosystem. b. Typical plot for a stressed degraded ecosystem. Redrawn after Warwick 1986.)
Size of this preview: 800 × 461 pixels. Other resolutions: 320 × 184 pixels | 869 × 501 pixels.
Original file (869 × 501 pixels, file size: 53 KB, MIME type: image/jpeg)
Summary
Comparison of k-dominance for abundance and biomass. a. Typical plot for a healthy ecosystem. b. Typical plot for a stressed degraded ecosystem. Redrawn after Warwick 1986.
File history
Click on a date/time to view the file as it appeared at that time.
| Date/Time | Thumbnail | Dimensions | User | Comment | |
|---|---|---|---|---|---|
| current | 20:45, 18 April 2023 | | 869 × 501 (53 KB) | Dronkers J (talk | contribs) | Comparison of k-dominance for abundance and biomass. a. Typical plot for a healthy ecosystem. b. Typical plot for a stressed degraded ecosystem. Redrawn after Warwick 1986. |
- You cannot overwrite this file.
File usage
The following page links to this file:
