Difference between revisions of "File:Poulospic7.jpg"
From Coastal Wiki
(Figure 7. Graphs representing the significant wave height (Hs) and suspended sediment concentration (SSC) over the study period.) |
(No difference)
|
Latest revision as of 16:10, 22 March 2007
Figure 7. Graphs representing the significant wave height (Hs) and suspended sediment concentration (SSC) over the study period.
File history
Click on a date/time to view the file as it appeared at that time.
| Date/Time | Thumbnail | Dimensions | User | Comment | |
|---|---|---|---|---|---|
| current | 16:10, 22 March 2007 | 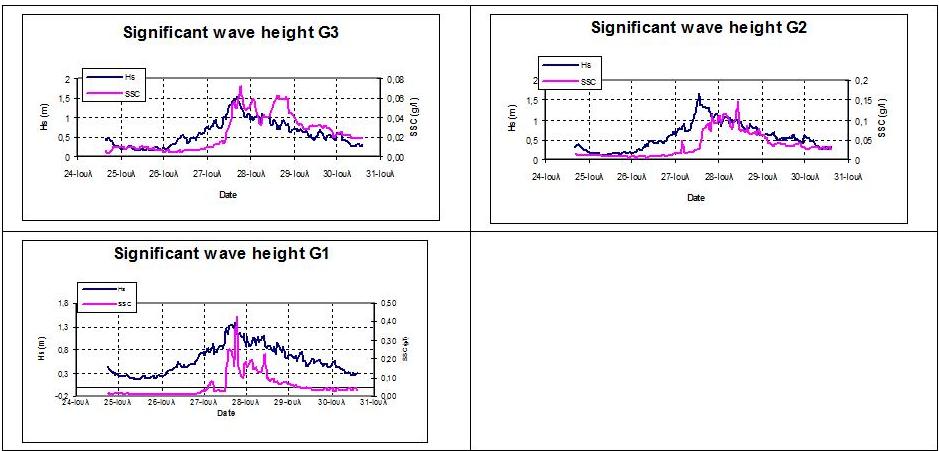 | 939 × 451 (70 KB) | Kpavlop (talk | contribs) | Figure 7. Graphs representing the significant wave height (Hs) and suspended sediment concentration (SSC) over the study period. |
- You cannot overwrite this file.
File usage
The following page links to this file:
