Difference between revisions of "Pump samplers"
| Line 18: | Line 18: | ||
==Pump-bottle sampler== | ==Pump-bottle sampler== | ||
===Introduction=== | ===Introduction=== | ||
| − | [[Image:H5635figure1.jpg|thumb|250px||right|Figure | + | [[Image:H5635figure1.jpg|thumb|250px||right|Figure 3: Pump bottle sampler]] |
| − | This simple method is based on the continuous pumping (propeller type pump) of a water-sediment mixture. On board of the survey vessel a small part of the pump discharge is used to fill a 1 liter-bottle or 2 liter-bottle in 3 to 5 minutes by using a small siphon tube ( | + | This simple method is based on the continuous pumping (propeller type pump) of a water-sediment mixture. On board of the survey vessel a small part of the pump discharge is used to fill a 1 liter-bottle or 2 liter-bottle in 3 to 5 minutes by using a small siphon tube (see 1A in Figure 3). Using this method, a relatively long sampling period and hence a (statistically) reliable concentration measurement can be obtained. When a peristaltic pump is used (discharge = 0.5 to 1 1/min), the bottle can be filled directly. |
An optical sensor can be used to determine the silt concentration in the bottle after settling of the sand particles. The silt and sand concentration can be determined as: | An optical sensor can be used to determine the silt concentration in the bottle after settling of the sand particles. The silt and sand concentration can be determined as: | ||
| Line 28: | Line 28: | ||
===Calibration=== | ===Calibration=== | ||
| − | To determine the sampling efficiency of the pump-bottle method, laboratory measurements were carried out in a flume using sand with D<sub>10</sub> = 150 um, D<sub>50</sub>= 220 um and D<sub>90</sub>= 330 um. A siphon sampler was used to determine the actual concentration (co) at the position of the intake nozzle. The sand concentration in the flume was varied from 30 to 1700 mg/1. The intake velocity of the pump-bottle system was equal to the local flow velocity in the flume (iso-kinetic sampling). The tap discharge Q<sub>s</sub> was varied from 0.2 to 2 liters per minute. Figure | + | To determine the sampling efficiency of the pump-bottle method, laboratory measurements were carried out in a flume using sand with D<sub>10</sub> = 150 um, D<sub>50</sub>= 220 um and D<sub>90</sub>= 330 um. A siphon sampler was used to determine the actual concentration (co) at the position of the intake nozzle. The sand concentration in the flume was varied from 30 to 1700 mg/1. The intake velocity of the pump-bottle system was equal to the local flow velocity in the flume (iso-kinetic sampling). The tap discharge Q<sub>s</sub> was varied from 0.2 to 2 liters per minute. 1B in Figure 3 presents the average error in the concentration as a function of the discharge Q<sub>s</sub> showing an average error smaller than 20% for a discharge Q<sub>s</sub> in the range 0.2 to 1 1/min. |
For each concentration the largest and smallest deviation are also indicated. | For each concentration the largest and smallest deviation are also indicated. | ||
Figure 1B shows a trend from a positive error for a small discharge to a negative error for a large discharge, which can be explained by means of the hydraulic coefficient of the bottle filling process. | Figure 1B shows a trend from a positive error for a small discharge to a negative error for a large discharge, which can be explained by means of the hydraulic coefficient of the bottle filling process. | ||
| Line 36: | Line 36: | ||
==Pump-sedimentation sampler== | ==Pump-sedimentation sampler== | ||
===Introduction=== | ===Introduction=== | ||
| − | [[Image:H5634figure1.jpg|thumb|250px|right|Figure | + | [[Image:H5634figure1.jpg|thumb|250px|right|Figure 4: Pump sedimentation sampler]] |
| − | [[Image:H5634figure2.jpg|thumb|250px|right|Figure | + | [[Image:H5634figure2.jpg|thumb|250px|right|Figure 5: Pump sedimentation sampler]] |
| − | The method is based on the filling of a large calibrated container (= 50 liters), in which the sand particles can settle (bottle 1), as shown schematically in Figure 1A and in Figure | + | The method is based on the filling of a large calibrated container (= 50 liters), in which the sand particles can settle (bottle 1), as shown schematically in Figure 1A and in Figure 5. Using a settling height of about 0.75 m, the sand particles larger than 50 a 60 um can be separated in about 5 minutes. A high separation efficiency can be obtained by using a conical container and a vibrator to avoid settlement of the sand particles on the inside of the container (Van Rijn, 1980<ref name=vanrijn>Van Rijn, L.C., 1980. Methods for in-situ Separation of Water and Sediment. Delft Hydraulics Laboratory, Report SH04 II, The Netherlands.</ref>). To determine the silt concentration (particles smaller than 50 um), a small water sample (bottle 2) can be tapped during emptying of the container. |
The silt and sand concentrations are determined as: | The silt and sand concentrations are determined as: | ||
| Line 50: | Line 50: | ||
===Calibration=== | ===Calibration=== | ||
| − | Laboratory measurements were carried out to determine the sampling efficiency. A siphon sampler was used to determine the original concentrations near the intake nozzle. The maximum sampling error was found to be about 15% for sand concentrations larger than about 50 mg/1 (see Figure | + | Laboratory measurements were carried out to determine the sampling efficiency. A siphon sampler was used to determine the original concentrations near the intake nozzle. The maximum sampling error was found to be about 15% for sand concentrations larger than about 50 mg/1 (see 1B in Figure 4). Probably, a minor part of the sand particles settles on the inside of the container and is washed off during emptying of the container (Van Rijn, 1980<ref name=vanrijn/>). |
| − | + | Field measurements in a tidal estuary (Western Scheldt, The Netherlands) have shown the presence of a small amount of sand particles in bottle 2. Figure 6 presents the ratio of the sand concentration from bottle 2 and 1 as a function of the sand concentration from bottle 1. For sand concentrations larger than about 50 mg/1, the sand concentration from bottle 2 is less than 20% of the sand concentration from bottle 1 and may, therefore, be neglected resulting in a considerable reduction of the laboratory analysis. Size analysis of sediment samples collected in field conditions shows that nearly all (sand) particles larger than about 50 um do settle in bottle 1 during the sedimentation period of about 5 minutes (Van Rijn, 1980<ref name=vanrijn/>). Field measurements have also shown that the silt concentration (bottle 2) can be determined with an inaccuracy of about 10% compared with a simple bottle sampler. | |
| − | Field measurements in a tidal estuary (Western Scheldt, The Netherlands) have shown the presence of a small amount of sand particles in bottle 2. Figure | + | [[Image:H5634figure3.jpg|thumb|250px|left|Figure 6: Ratio of sediment concentrations of bottle 1 and 2]] |
==See also== | ==See also== | ||
Revision as of 08:31, 27 November 2007
This article is a summary of sub-sections 5.6.3.3, 5.6.3.4 and 5.6.3.5 of the Manual Sediment Transport Measurements in Rivers, Estuaries and Coastal Seas[1]. This article describes how different pump samplers can be used to determine the silt and sand concentration in a suspended load. Three types of pump-samplers are discussed: the pump-filter, the pump-sedimentation, and the pump-bottle sampler.
Contents
Pump-filter sampler
Introduction
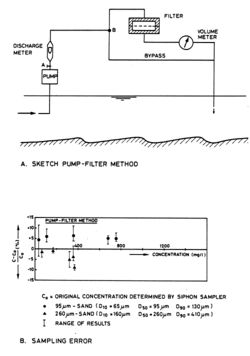
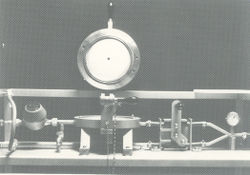
The water-sediment sample is pumped through a filter (see Figure 2) which separates all particles larger than the mesh size of the applied filter material. The method is shown schematically in Figure 1A. To separate the sand fraction, nylon filter material with a mesh size of 50 um can be used. The water volume is recorded by means of a (simple) volume meter. After taking a sample, the filter system is opened and the filter material with the sand catch is removed and returned to the laboratory for drying, weighing and size analysis. During removal of the filter, the pumping is continued using a bypass system. The filtration method cannot be used in a silty environment with silt concentrations larger than about 50 mg/1 because of rapid filter blocking by the fine silt particles.
The sand concentrations are determined as:
c=G/V
in which: G= dry mass of sediment (mg), V= volume of water sample (l).
Calibration
To determine the overall accuracy of the pump-filter method, some concentration measurements were carried out in a laboratory flume using a siphon sampler for comparison. The siphon sampler consisted of a short hose connected to an intake nozzle in the flume. The intake nozzles of both methods were installed next to each other at a fixed height above the flume bottom. In lateral direction an uniform concentration was assumed. To simulate field conditions as much as possible, the pump-filter system was operated with a static lift of 2.0 m and a hose diameter (bore) of 0.016 m and a hose length of 50 m. Filter material with a mesh size of 50 um is used for separation of the sand fraction. The hydraulic coefficient of the pump sampler was varied in the range 0.7 to 1. Figure 1B shows the sampling error in the concentration for two types of sand. The concentration range is 50 to 1000 mg/1. Each point represents an average value, while also the highest and lowest value are indicated. The maximum overall error for all measurements is about 10% (Van Rijn, 1979[2]). Field measurements indicate a sampling error in the concentration of about 20%
Pump-bottle sampler
Introduction
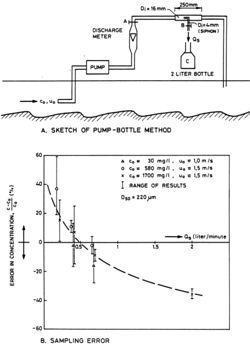
This simple method is based on the continuous pumping (propeller type pump) of a water-sediment mixture. On board of the survey vessel a small part of the pump discharge is used to fill a 1 liter-bottle or 2 liter-bottle in 3 to 5 minutes by using a small siphon tube (see 1A in Figure 3). Using this method, a relatively long sampling period and hence a (statistically) reliable concentration measurement can be obtained. When a peristaltic pump is used (discharge = 0.5 to 1 1/min), the bottle can be filled directly.
An optical sensor can be used to determine the silt concentration in the bottle after settling of the sand particles. The silt and sand concentration can be determined as:
csilt=Gsilt/V and csand=Gsand/V
in which: G= dry mass of sediment (mg), V= volume of water sample (l).
Calibration
To determine the sampling efficiency of the pump-bottle method, laboratory measurements were carried out in a flume using sand with D10 = 150 um, D50= 220 um and D90= 330 um. A siphon sampler was used to determine the actual concentration (co) at the position of the intake nozzle. The sand concentration in the flume was varied from 30 to 1700 mg/1. The intake velocity of the pump-bottle system was equal to the local flow velocity in the flume (iso-kinetic sampling). The tap discharge Qs was varied from 0.2 to 2 liters per minute. 1B in Figure 3 presents the average error in the concentration as a function of the discharge Qs showing an average error smaller than 20% for a discharge Qs in the range 0.2 to 1 1/min. For each concentration the largest and smallest deviation are also indicated. Figure 1B shows a trend from a positive error for a small discharge to a negative error for a large discharge, which can be explained by means of the hydraulic coefficient of the bottle filling process. For Qs= 2 l/min the ratio of the tap velocity and pump velocity (= hydraulic coefficient) is 1.5 resulting in a negative sampling error. For Qs smaller than 1 1/min, the hydraulic coefficient is smaller than 1 resulting in a positive sampling error. Optimal sampling requires a discharge of about 0.5 1/min (2 liter bottle in 1 minutes). Grain-size analysis of the sediment particles collected in the bottle showed a D50= 200 um which is about 10% smaller as the original sediment (D50= 220 um).
Pump-sedimentation sampler
Introduction
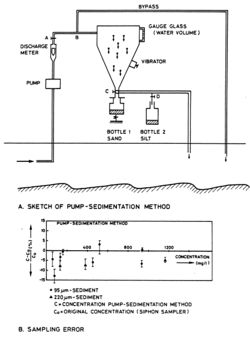
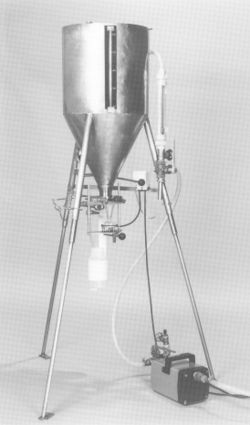
The method is based on the filling of a large calibrated container (= 50 liters), in which the sand particles can settle (bottle 1), as shown schematically in Figure 1A and in Figure 5. Using a settling height of about 0.75 m, the sand particles larger than 50 a 60 um can be separated in about 5 minutes. A high separation efficiency can be obtained by using a conical container and a vibrator to avoid settlement of the sand particles on the inside of the container (Van Rijn, 1980[3]). To determine the silt concentration (particles smaller than 50 um), a small water sample (bottle 2) can be tapped during emptying of the container.
The silt and sand concentrations are determined as:
csilt=Gsilt 2/Vbottle 2
csand=Gsand 1/Vcontainer + Gsand 2/Vbottle 2
in which: Gsilt 2= dry mass of silt sample from bottle 2 (mg), Vbottle 2= volume of water sample in bottle 2 (1). Gsand 1= dry mass of sand sample in bottle 1 (mg), Vcontainer = volume of water sample in container (1), Gsand 2 = dry mass of sand sample in bottle 2 (mg).
Calibration
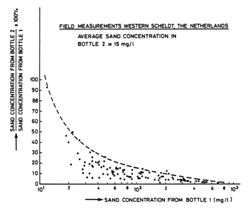
Laboratory measurements were carried out to determine the sampling efficiency. A siphon sampler was used to determine the original concentrations near the intake nozzle. The maximum sampling error was found to be about 15% for sand concentrations larger than about 50 mg/1 (see 1B in Figure 4). Probably, a minor part of the sand particles settles on the inside of the container and is washed off during emptying of the container (Van Rijn, 1980[3]). Field measurements in a tidal estuary (Western Scheldt, The Netherlands) have shown the presence of a small amount of sand particles in bottle 2. Figure 6 presents the ratio of the sand concentration from bottle 2 and 1 as a function of the sand concentration from bottle 1. For sand concentrations larger than about 50 mg/1, the sand concentration from bottle 2 is less than 20% of the sand concentration from bottle 1 and may, therefore, be neglected resulting in a considerable reduction of the laboratory analysis. Size analysis of sediment samples collected in field conditions shows that nearly all (sand) particles larger than about 50 um do settle in bottle 1 during the sedimentation period of about 5 minutes (Van Rijn, 1980[3]). Field measurements have also shown that the silt concentration (bottle 2) can be determined with an inaccuracy of about 10% compared with a simple bottle sampler.
See also
Summaries of the manual
- Manual Sediment Transport Measurements in Rivers, Estuaries and Coastal Seas
- Chapter 1: Introduction, problems and approaches in sediment transport measurements
- Chapter 2: Definitions, processes and models in morphology
- Chapter 3: Principles, statistics and errors of measuring sediment transport
- Chapter 4: Computation of sediment transport and presentation of results
- Chapter 5: Measuring instruments for sediment transport
- Chapter 6: Measuring instruments for particle size and fall velocity
- Chapter 7: Measuring instruments for bed material sampling
- Chapter 8: Laboratory and in situ analysis of samples
- Chapter 9: In situ measurement of wet bulk density
- Chapter 10: Instruments for bed level detection
- Chapter 11: Argus video
- Chapter 12: Measuring instruments for fluid velocity, pressure and wave height
Other internal links
About pump sampling:
External links
- Sub-section 5.6.3.3 of the manual (pump-filter)
- Sub-section 5.6.3.4. of the manual (pump-sedimentation)
- Sub-section 5.6.3.5 of the manual (pump-bottle)
References
- ↑ Rijn, L. C. van (1986). Manual sediment transport measurements. Delft, The Netherlands: Delft Hydraulics Laboratory
- ↑ Van Rijn, L.C. (1979) Pump Filter Sampler. Delft Hydraulics Laboratory, Report S4CW, The Netherlands.
- ↑ 3.0 3.1 3.2 Van Rijn, L.C., 1980. Methods for in-situ Separation of Water and Sediment. Delft Hydraulics Laboratory, Report SH04 II, The Netherlands.
Please note that others may also have edited the contents of this article.
|
Please note that others may also have edited the contents of this article.
|
