Acoustic kelp bed mapping in shallow rocky coasts - case study Helgoland (North Sea)
Contents
Introduction
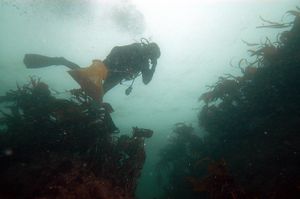
Kelp beds are named after their habitat structuring organisms which are perennial brown macroalgae of several metres length, living submersed in the light penetrated zone of temperate and polar rocky shores (Fig. 1). Kelps provide substrate, food and protection for hundreds of different marine fishes, invertebrates, or other macroalgal species. A change or loss will have drastic consequences for coastal ecosystems.In recent years worldwide reports of changing kelp beds have been published (Japan: Kirihara et al., 2006[1], Norway: Moy et al., 2003[2], France: Cosson, 1999[3], Australia: Australian Marine Conservation Society). In Europe, including Helgoland (Gehling & Bartsch, submitted[4]), there is evidence of a biomass decrease and/or change in depth distribution of some species. As the marine protected area off Helgoland is the only rocky area within the southern North Sea, this habitat is extremely important. Spatial information on the extent of the prevailing kelp beds is urgently needed as a baseline from which to judge future changes. This led to the current investigation.
Methods and techniques
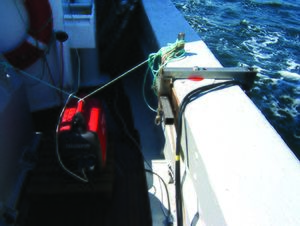
Traditionally, diving transects have been used to investigate the sublittoral zone off Helgoland (Lüning, 1970[5], Gehling & Bartsch, submitted[4]). This technique is precise with respect to species identification and abundance recording but does not provide spatial information and is very slow. To enhance monitoring speed geo-referenced underwater video transects are being evaluated (Herzog, 2008)[6]. Although this technique is much faster in the field than diving, data evaluation still has to be done manually. Acoustic devices on single beam echo sounder basis such as Roxann (Sonarvision) promise rapid measurement of transects at 4 knots and offer the possibility of automated signal processing and interpretation. Furthermore, interpolation techniques may be employed to generate spatial maps from a grid of regular transects. Normally this technique is used for seabed habitat mapping in greater depths (Brown et al., 2005[7], Humborstad et al., 2004[8]). Here, we applied the method to depths from -2 m mean low water spring and below, which is at the technical limits as the reflected pulses at low water depth return too fast to be correctly recorded. The Roxann signal processor includes a Furuno stereo transducer system (28 and 200 kHz) mounted on board the research vessels (Fig. 2). Both echosounder signals are recorded synchronously. In order to correlate Roxann data with seafloor characteristics, selected areas and transects were chosen for intense groundtruthing with the help of under water video and diving transects.
Seafloor classification system RoxAnn (Sonar Vision)
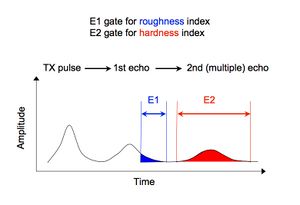
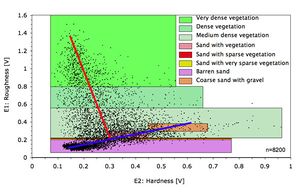
This system uses the first and second echo returns to analyse seafloor properties (Fig. 3). The transceivers transmit pulses over a variety of angles. A perfectly smooth seafloor would reflect only the energy from the 0° angle. Echoes from other angles would travel away from the transceiver. The rougher the seafloor is, the more energy is received back and thus the higher is the E1 value. Thus E1 is a measure for the roughness of the seafloor. The echoes travel from the seafloor to the sea surface (including ship's hull), back to the sea floor and again up to the sea surface where they are recorded as the first multiple (E2). The harder the seafloor, the higher becomes the E2 value, which thus is a measure for the hardness of the seafloor (Chivers et al., 1990[9], Hamilton, 2001[10]). Both parameters characterise the properties of the seafloor and are used for its classification (Fig. 4).
Implementation
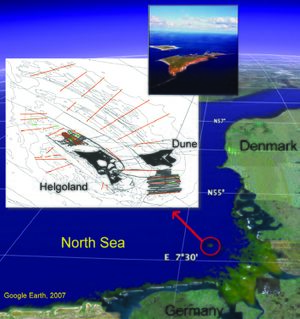
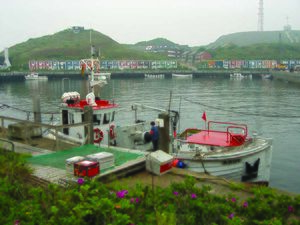
First campaigns with the RoxAnn seafloor-discrimination system took place in summer (2005 and 2006), the time of the year when kelp bed development is best. We investigated the ridges south of Dune Island and north of the main island (Fig. 5) in detail using BAH research vessel "Aade" (Fig. 6). Detailed data processing has so far only been carried out for the area south of Dune Island. This area covers 1.4 km²; total length of transects is about 30 km. A total of 28 lines were measured perpendicular to the extension of the kelp-inhabited areas. Duration of data acquisition was approx. 4 h during one day. Recorded data included DGPS data (position, date, time) and RoxAnn data (water depth, E1 and E2 values for each frequency). Ground-truthing took place within one month. This is possible as macrophyte vegetation in summer is quite stable unless there is a severe storm.
Terrain model
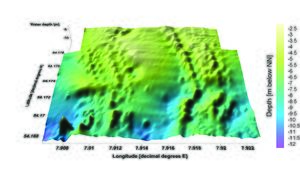
The RoxAnn data were used to create an underwater terrain model, which is now available for the first time (Fig. 7). Tidal effects were excluded on the basis of a DGPS working in real-time kinematic mode (RTK) that allows precision in the cm-range. The corresponding DGPS reference station has been installed on the main island. All depth values were filtered to exclude bad measurements and the remaining data were used to produce a data grid using the kriging method. South of Dune Island water depth values range between 2 and 14 m. The hard rock ridges emerge from the otherwise unstructured seafloor which is covered here by sand.
Sea floor classification
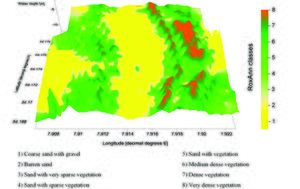
In order to generate a classified map of the seafloor, in the lab, the following classes were first established as a basis and then correlated with the E1/E2 values by comparing ground-truth information and RoxAnn data: 1. Very dense vegetation (kelp beds) 2. Dense vegetation (kelp beds) 3. Medium dense vegetation (kelps and red algae) 4. Sand with vegetation 5. Sand with sparse vegetation 6. Sand with very sparse vegetation 7. Barren sand 8. Coarse sand with gravel
The results are shown in Fig. 8. It is obvious that the elevated ridges are covered with dense kelp bed vegetation, thinning out to the margins. In some areas there is sparse vegetation on sand and the area in between the two prominent ridges is filled with sand, which is totally unvegetated. In the western part of the investigation area sand intrudes and covers the rock ridges. The classes 1-3 and 7-8 are reproducible while the discrimination of sparsely vegetated areas still delivers variable results.
Prospects
Since it can be assumed that current and wind action is responsible for the sand cover that is entering the western ridge south of Dune Island, the coverage with kelps and other seaweeds will be variable here. Thus this area is of great interest to monitor interannual changes. The main kelp-bed area, however, is located north of Dune and the main island. With these promising results as background, they will be investigated by the same method soon. The presented data are preliminary and not yet published. Please refer to the authors for further information.
See also
Internal links
- Underwater video
- Underwater video systems
- Application and use of underwater video
- Data interpolation with Kriging
References
- ↑ Kirihara, S., Nakamura, T., Kon, N., Fujita, D. & Notoya, M. (2006). Recent fluctuations in distribution and biomass of cold and warm temperate species of Laminarialean algae at Cape Ohma, northern Honshu, Japan. J Applied Phycol., 18, 521-527.
- ↑ Moy, F., Aure, J., Dahl, E., Green, N., Johnsen, T.M., Lømsland, E.R., Magnusson, J., Omli, L., Olsgaard, F., Oug, E., Pedersen, A., Rygg, B. & Walday, M.(2003). Landtidsovervåking av miljøkvaliteten i kystområdene av Norge. Årsrapport for 2002, 1-69.
- ↑ Cosson, J. (1999). Sur la disparition progressive de Laminaria digitata sur les côtes du Calvados (France). Cryptogamie Algol, 20, 35-42.
- ↑ 4.0 4.1 Gehling, C. & Bartsch, I.(submitted). Changes in depth distribution and biomass of sublittoral seaweeds at Helgoland (North Sea) between 1970 and 2005. Submitted to Climate Research.
- ↑ Lüning, K. (1970). Tauchuntersuchungen zur Vertikalverteilung der sublitoralen Helgoländer Algenvegetation. Helgoländer wissenschaftliche Meeresuntersuchungen, 21, 271-291.
- ↑ Herzog, S. (2008). Unterwasservideokartierung der Algenvegetation vor Helgoland. Hausarbeit der Universität Hamburg, 91 Seiten.
- ↑ Brown, C.J., Mitchell, A., Limpenny, D.S., Robertson, M.R., Service, M. & Golding, N. (2005). Mapping seabed habitats in the Firth of Lorn off the west coast of Scotland: evaluation and comparison of habitat maps produced using the acoustic ground-discrimination system, RoxAnn, and sidescan sonar. ICES Journal of Marine Science, 62, 790-802.
- ↑ Humborstad, O.B., Nøttestad, L., Løkkeborg, S. & Rapp, H.T. (2004). RoxAnn bottom classification system, sidescan sonar and video-sledge: spatial resolution and their use in assessing trawling impacts. ICES Journal of Marine Science, 61, 53-63.
- ↑ Chivers, R.C., Emerson, N. & Burns, D. (1990). New acoustic processing for underway surveying. Hydrographic Journal, 42, 8-17.
- ↑ Hamilton, L.J. (2001). Acoustic seabed classification systems. Victoria (Australia): Defence Science and Technology Organisation, Aeronautical and Maritime Research Lab.
Please note that others may also have edited the contents of this article.
|
