Differentiation of major algal groups by optical absorption signatures
Contents
Introduction
Phytoplanktonic microalgae form the basis of most marine ecosystems. Knowledge of the taxonomic composition of phytoplankton is important for many ecological and biogeochemical aspects. Identification of the major taxonomic groups can help to identify algal bloom organisms, to estimate the role of functional groups in the food chain and to tag or forecast harmful algal blooms (HABs) (Millie et al., 2002[1]).

Optical characteristics of algae are specific for each algal group. To discriminate algal groups in a monitoring system, techniques are needed to measure these specific optical properties. One possibility is to use the chlorophyll fluorescence excitation spectra (AOA, bbe Moldaenke, Germany). Fluorescence techniques are simple, relatively sensitive, and thus can be applied in natural waters. However, only the chlorophyll pigments can be detected. By using the absorption spectrum of a water sample also other pigments (photo-protective and photosynthetic) can be identified. Most major groups can be discriminated by a group-specific pigment combination, e.g. chlorophyll-b occurs only in chlorophytes, prochlorophytes and euglenophytes etc., and phycobili-proteines only in rhodophytes, cryptophytes and cyanobacteria. Groups with the same pigment composition can, however, be discriminated due to group-specific pigment ratios. As these pigments have specific absorption maxima which are visible in a total absorption spectrum of a water sample, they can be measured with the newly developed PSICAM technique. It allows to measure a sample of water in real time and to use this data to differentiate algal groups online.
Methods and Techniques
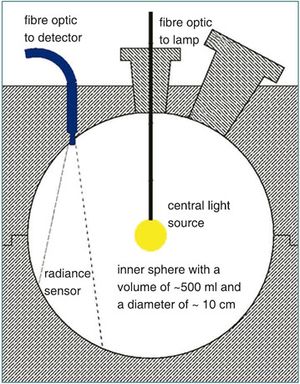
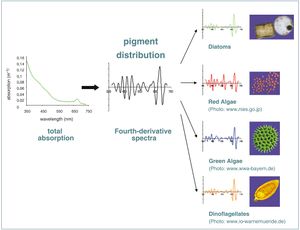
The absorption meter (point-source integrating-cavity absorption meter, PSICAM) (Fig.1) was developed to measure the low absorption by phytoplankton in natural waters (Kirk, 1995[2], Röttgers et al., 2007[3]). It can 1) measure pure absorption without the error caused by particle scattering, 2) it is sufficiantly sensitive even for very clear water, and 3) it can be used unattended in a flow-trough mode. With a PSICAM the total absorption by all water constituents can be determined, namely phytoplankton, gelbstoff and detritus. In seawater samples only phytoplankton pigments show narrow absorption peaks in the range between 350 and 700 nm. The position and the relative amount of these absorption maxima can be extracted using common spectral analysis techniques like the calculation of the fourth derivatives (Fig. 2). A database of absorption and fourth derivative spectra from different cultured algal species of all major taxonomic groups was established. It includes information of species- , class- and group-specific characteristics. The data also includes taxon-specific variations as the individual pigment composition partly depends on the genetic, photo-acclimative and photo-physiological status of the algae. This database and a robust mathematical correlation technique are used to determine the abundance of each algal group in a sample.
Implementation
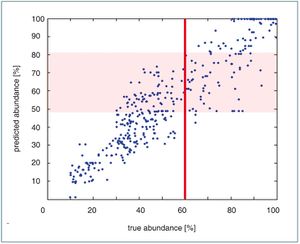
Tests were performed to assess the reliability of the algal group identification. The absorption spectra of individual cultured species from various groups were combined mathematically. In the combined absorption spectrum the abundance of each group was determined. These tests were performed for each group and for some thousand group combinations. One example of the outcome is shown in Fig. 3. The implementation of a PSICAM instrument in a Ferrybox system will allow to identify the absolute phytoplankton biomass and its major taxonomic groups online and in real time. In case of an algal bloom, this technique can identify the major group or even some individual species that are known to build HABs.
See also
Internal Links
- Instruments and sensors to measure environmental parameters
- General principles of optical and acoustical instruments
- Light fields and optics in coastal waters
- Optical remote sensing
- Optical measurements in coastal waters
- Real-time algae monitoring
- The Continuous Plankton Recorder (CPR)
- ALGADEC - Detection of toxic algae with a semi-automated nucleic acid biosensor
- Ships of opportunity and ferries as instrument carriers
References
- ↑ Millie, D. F., Schofield, O. M. E., Kirkpatrick, G. J., Johnsen, G. & Evens, T.J. (2002). Using absorbance and fluorescence spectra to discriminate microalgae. European Journal of Phycology, 37, 313-322.
- ↑ Kirk, J.T.O. (1995). Modeling the performance of an integrating-cavity absorption meter: theory and calculations for a spherical cavity. Applied Optics, 34, 4397-4408.
- ↑ Röttgers, R., Häse, C. & Doerffer, R. (2007). Determination of the particulate absorption of microalgae using a point-source integrating-cavity absorption meter: verification with a photometric technique. Limnol. Oceanogr.: Methods 5, 1-12.
Please note that others may also have edited the contents of this article.
|

