FerryBox - Continuous and automatic water quality observations along transects
Contents
Introduction
The lack of reliable monitoring systems that provide continuous observations of the marine environment in the coastal areas and shelf seas of Europe with an adequate data quality is a serious hindrance to an understanding of marine systems. Currently, operational monitoring is mainly carried out by manual sampling and analysis during ship cruises. Autonomous measuring systems on buoys allow measurement of standard oceanographic parameters (temperature, salinity, currents) and, in some cases, other parameters, e.g. turbidity, oxygen and chlorophyll fluorescence. However, existing observations mostly lack the spatial coverage and temporal resolution required to determine the state of the marine environment and changes within it. Furthermore, the automatic systems on buoys etc. are affected by biofouling and the operational costs are high due to ship costs for servicing.
Technology:
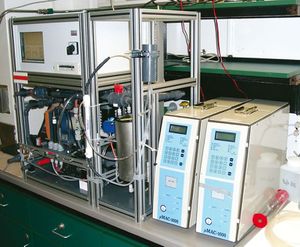
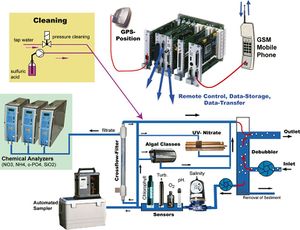
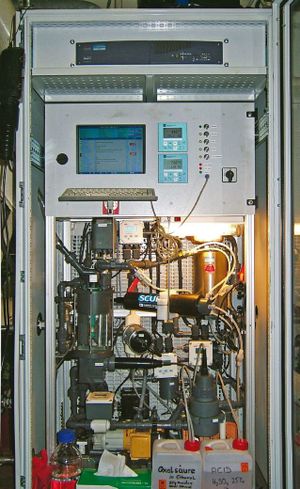
The principles of the FerryBox flow-through system are schematically shown in Fig. 2. For an unattended operation the system is controlled via position (by GPS) and an internal computer. The system is connected to a station on shore, via GSM (cell phone) for remote control and data transfer. The data transfer is in near real time after completion of a cruise at all times the ship is in a harbour. All data are archived in a data base system at GKSS and can be accessed by external users via a web interface (http://ferrydata.gkss.de).
Study area
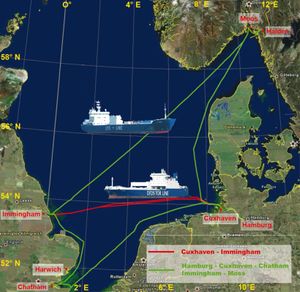
The first FerryBox system was installed on a ferry between Cuxhaven (GE) and Harwich (GB) from 2002 until 2005. After the operation of this ferry line was terminated the equipment was reinstalled on a Roll-on/roll-off vessel (“TorDania”) between Cuxhaven and Immingham (GB) in September 2006 (Fig. 4). A second system was installed on a cargo ship (“LysBris”) cruising between Germany, England and Norway in 2007. The ferry transects are depicted in Fig. 3. In the GKSS-coordinated EU project "FerryBox", running from 2002 to 2005, different measuring systems - including the GKSS FerryBox - were compared and tested on nine different European ferry routes (Petersen et al., 2005[2]). The results showed the good quality of the data and the applicability of this technology for operational monitoring purposes (see also http://www.ferrybox.org) (Petersen et al., 2007[3]).
FerryBox data on a single transect
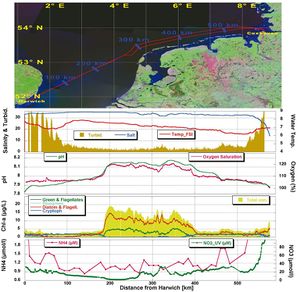
One transect between Cuxhaven and Harwich from March 27th 2004 is shown in Fig. 6. The following parameters were measured:
Salinity
Low salinities near Cuxhaven indicate the freshwater outflow of the river Elbe, whereas the decrease near Harwich is only marginal. It is also evident that lower salinities are observed along the Dutch coast compared to the English Channel due to fresh water influence of the Ijsselmeer and the river Rhine.
Turbidity
Near Harwich high turbidities are measured which is characteristic of the coastal areas at the English coast, presumably due to erosion processes. Higher turbidities are also detected in the Elbe estuary (turbidity zone).
Chlorophyll-a
The total chlorophyll concentration shows a broad maximum along the Dutch coast between km 200 and 400 (distance from Harwich). Here, the groups of green algae and flagellates and the group of diatoms and flagellates are both prevailing. This early spring bloom is probably dominated by flagellates, which, unfortunately, contribute to both groups and therefore cannot be clearly separated.
Oxygen saturation and pH
These parameters show a maximum in the areas with high chlorophyll concentrations. This is expected since this reflects the processes during primary production (CO2-uptake which increases the pH, and O2-production).
Nutrients
Ammonium (NH4) and nitrate (NO3) show elevated values near the Elbe estuary since the Elbe is a source for these substances. Near the English coast, elevated ammonium concentrations are found as well.
Seasonal results from FerryBox measurements
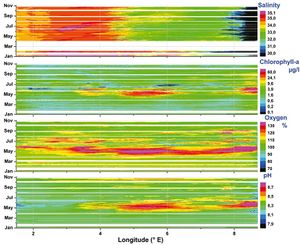
The observations of single transects with the FerryBox can be pooled in a scatter plot to give an overview of the temporal and spatial variability of a parameter. In Fig. 7 time series of salinity, chlorophyll, oxygen and pH are shown from January to November 2005
Salinity
The higher salinities in waters which originate from the English Channel prevail over the whole year. Near the Elbe estuary several freshwater intrusions into the German Bight, which lower the salinities, can be seen. This may originate from rainwater and Elbe runoff.
Chlorophyll
Fig. 7 shows that plankton blooms started in early April in the waters west of the Dutch coast. The main reasons for this are presumably a low turbidity and stratification of these waters in springtime, which supports algal growth. From this area the bloom spreads along the Dutch coast northwards. In July the main nutrients are consumed and only small chlorophyll concentrations remain. During spring and early summer algae blooms occur in front of the Elbe estuary. Here, the high nutrient concentrations which are released from the Elbe (nitrate) and which are produced in the sediments of the wadden sea tidal flats (NH4, PO4) support the bloom.
Oxygen saturation
In general, the oxygen saturation values over 100 % follow the chlorophyll pattern due to primary production. In addition, oxygen deficiencies can be seen in decaying algal blooms due to bacterial mineralisation processes.
The new FerryBox system on the cargo ship “LysBris”
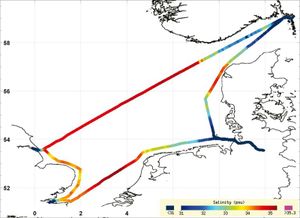
Since 2007, a second FerryBox system has been operating on a cargo ship which cruises between Germany, England and Norway on a weekly basis. Some preliminary results for salinity are shown in Fig. 5. The lower salinities in front of the Elbe estuary and in the Skagerrak (surface waters from the Baltic) can be seen clearly. In addition, it is evident that lower salinities are measured along the English coast than in the open North Sea and in the waters adjacent to the English Channel.
Algal dynamics in 2004 and 2005
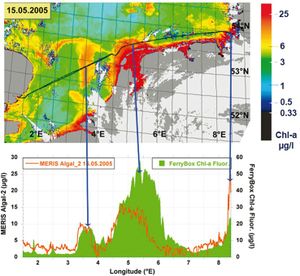
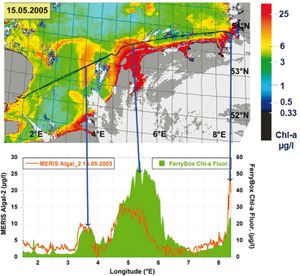
A more detailed picture of the spring bloom in the years 2004 and 2005 is shown in the two contour plots in Fig. 8. In general, the chlorophyll variations are similar to those in Fig. 7: The bloom starts west of the Dutch coast and subsequently spreads northwards. However, the start of the bloom in 2005 occurs later in the year (early April) than in 2004 (end of March), the bloom does not spread so far in 2005, and the intensity of the bloom is higher in 2005. In addition, in 2005, a much more intensive bloom was observed in the German Bight off the Elbe estuary, starting in May and disappearing in mid June 2005. This bloom was characterised by considerably higher chlorophyll concentrations (factor 1.5) than in 2004. The reasons for these differences are not yet clear and are the topic of further investigations, in which not only oceanographic parameters (temperature, turbidity, stratification) and nutrient availability have to be considered but which require numerical transport and ecological models for interpretation. Comparison of remote sensing data with FerryBox measurements In order to extrapolate from the two-dimensional FerryBox transects to larger areas satellites measuring optically active substances such as chlorophyll-a, yellow substance and suspended matter can be used. Especially the MERIS spectrometer on the satellite ENVISAT provides high spatial resolution data. As the data are measured by different physical principles - absorption of sunlight (MERIS) and fluorescence (FerryBox) - it is necessary at first to make a comparison before combining the two methods. In Fig. 9, a chlorophyll image of processed MERIS/ENVISAT data of the North Sea is presented. In the bottom graph of Fig. 9, data from the satellite along the FerryBox track were extracted (orange) and compared with measured FerryBox data (green). The areas with large chlorophyll concentrations off the Dutch coast and outside the Elbe estuary are well reflected by the FerryBox measurements. However, the large peak at 5.5° E is underestimated by the satellite. The differences may be caused by (1) uncertainties in the satellite data due to shallow waters and high concentrations of suspended matter; (2) uncertainties of the in-situ method as the fluorescence of algae varies among different algal species and is highly influenced by their physiological status. Taking these problems into consideration, the agreement between the two methods is not too bad and a combination can be used for interpretation purposes. This may be important, e.g. when data from consecutive FerryBox cruises imply a breakdown of an algae bloom (Petersen et al., 2008[4]). With satellite images it can be determined whether such a breakdown occurred or if an algae field was just drifting out of the ship track. The main disadvantage of remote sensing in the North Sea is the frequent cloud coverage, which often prevents the use of satellite data.
Conclusions and outlook
In conclusion, it turns out that a FerryBox system is a cost-effective monitoring tool to get a high yield of reliable high frequency water quality data along a transect and improving on conventional monitoring strategies. The yield of reliable data is high due to low-maintenance inline sensors and easy access for servicing at the home port. The high resolution of FerryBox systems in space and time provides deeper insight into marine processes which can be used for better assessing the ecosystem and the underlying biogeochemical processes in the marine environment. Special events like strong short-term algae blooms, which will be detected only occasionally by standard monitoring methods, can be studied in detail and related to variations in influencing factors such as temperature, wind and nutrient load. However, due to its limitations (surface measurements, certain ship tracks only) only a combination of research ship cruises, buoy measurements at strategic locations, remote sensing and numerical modelling will give the deep insight needed for an understanding of the ecosystem as a prerequisite for future management options.
References
- ↑ Petersen, W., Petschatnikov, M., Schroeder, F. & Colijn, F. (2003). Ferry-Box Systems for Monitoring Coastal Waters. In: H. Dahlin, N.C. Flemming, K. Nittis & S.E. Petersson (Eds.): Building the European Capacity in Operational Oceanography, Proc. 3rd Int. Conf. on EuroGOOS, EuroGOOS Publication series 19 (pp. 325-333). Amsterdam: Elsevier.
- ↑ Petersen, W., Colijn, F., Dunning, J., Hydes, D.J., Kaitala, S., Kontoyiannis, H., Lavin, A.M., Lips, I., Howarth, M.J., Ridderinkhof, H., Pfeiffer, K. & Sørensen, K. (2005). European FerryBox Project: From Online Oceanographic Measurements to Environmental Information. In: H. Dahlin, N.C. Flemming, M. Marchand, S.E. Petersson (Eds.): European Operational Oceanography: Present and Future. Proc. 4th Int. Conference on EuroGOOS, EuroGOOS Publication series 19 (pp. 551-560). Luxembourg: Office for Publications of the European Communities.
- ↑ Petersen, W., Colijn, F., Hydes, D. & Schroeder, F. (2007). FerryBox: from online oceanographic observations to environmental information. EU Project FerryBox 2002–2005. EuroGOOS Publication series 25. Southampton: Southampton Oceanography Centre.
- ↑ Petersen, W., Wehde, H., Krasemann, H., Colijn, F. & Schroeder, F. (2008). FerryBox and MERIS-Assessment of Coastal and Shelf sea Ecosystems by Combining In situ and Remote Sensed data. Estuarine Coastal and Shelf Science, 77 (2), 296 - 307. doi: 10.1016/j.ecss.2007.09.023.
Please note that others may also have edited the contents of this article.
|
Please note that others may also have edited the contents of this article.
|
