Harbour porpoise in the Belgian part of the North Sea
After many decades of near absence, the frequency of sightings of harbour porpoises (Phocoena phocoena [1]) in the Southern North Sea and the Belgian part of the North Sea (BPNS) [2] has increased in recent years. The harbour porpoise is included as a key or indicator species in a number of legal instruments oriented towards an improved environmental status. It is therefore important for managers, policy- and decision-makers and professionals who work in the marine environment to rely on the best available scientific information about the distribution, biology and ecology of the harbour porpoise in the BPNS and adjacent areas. Although information on the harbour porpoise is very exhaustive throughout its entire distribution area, specific information for the BPNS is less abundant and often scattered.
The present document attempts to gather the scientific information on the harbour porpoise (Phocoena phocoena) and its distribution in the Belgian waters and the Southern North Sea and provides a structured overview of research with a focus on research conducted on the Belgian part of the North Sea (see Abundance and distribution of the harbour porpoise in the Belgian part of the North Sea. This information is highly relevant in the context of conservation, monitoring and evaluation of harbour porpoise populations that frequent the BPNS. More detailed scientific (full-text) sources are included as further reading for the interested user.
Contents
Introduction
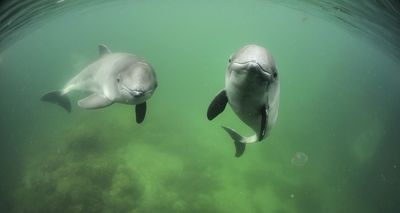
The harbour porpoise (Phocoena phocoena) is one of the smallest cetacean species. This species is part of the group of the toothed whales (Odontoceti), which forms the order of the cetaceans together with the baleen whales (Mysticeti). The harbour porpoise belongs to the family of the porpoises (Phocoenidae), which are distributed worldwide in cold and temperate waters. Harbour porpoises are distributed in the Northern Hemisphere where they feed on sandeels and whiting, which are found on the seabed mostly in areas of strong tidal currents (see below in Distribution of the harbour porpoise in the North Sea; see also distribution in EMODNET-Biology [4]). The North Atlantic harbour porpoise (P. phocoena phocoena) is one of the three subspecies of the harbour porpoise. The other two subspecies are the North Pacific harbour porpoise (P. phocoena vomerina) and the Black Sea harbour porpoise (P. phocoena relicta). They are mostly spotted alone or in mother-calf pairs. Despite being a top predator itself, the harbour porpoise is reportedly scavenged by seals and other cetacean species and actively predated by the grey seal Halichoerus grypus) [5] [6] [7] [8] [9]. Until the beginning of the 20th century harbour porpoises were exploited for their oil and flesh in the North Sea [10].
In the last years the frequency of sightings of harbour porpoises in the Southern North Sea has increased, a trend that is mainly explained by a southward shift in their distribution area in the North Sea. This shift is in line with other findings such as the shift in distribution of prey fish, which are becoming more abundant in the Southern North Sea and Belgian part of the North Sea (BPNS) (Hammond et al., 2013 241480). The harbour porpoise is key or indicator species in a number of legal instruments oriented towards an improved environmental status (e.g. Marine Strategy Framework Directive (MSFD) [11] and the Habitat Directive [12] of the European Commission; the OSPAR [13] Ecological Quality Objective (EcoQO), the Agreement on the Conservation of Small Cetaceans in the Baltic, North East Atlantic, Irish and North Seas (ASCOBANS) [14]). This information is therefore highly relevant in the context of conservation, monitoring and evaluation of harbour porpoise populations that frequent the BPNS. Hence, it is important for managers, policy- and decision-makers and professionals who work in the marine environment to rely on the best available scientific information about the distribution, biology and ecology of the harbour porpoise in the BPNS and adjacent areas. Although the general information on the harbour porpoise is very exhaustive for its global distribution area, specific information for the BPNS is less abundant and often scattered.
Morphology and physiology
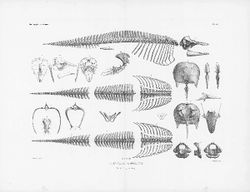
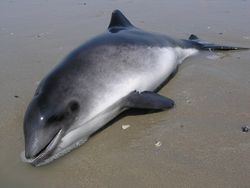
The harbour porpoise is a small cetacean species, with a body mass between 47 and 65 kg for mature animals [16]. Figure 2 shows the skeleton and bones of the harbour porpoise. It has a low, rounded triangular fin and a non-distinctive beak and forehead. The colour of this species merges from dark to lighter grey. Despite its small size compared to the larger cetacean species, the harbour porpoise body shape is adapted in such a way that it can also resist the cold waters by its robust, chunky form and thick blubber layer. As is the case for all toothed whales (Odontoceti), the harbour porpoise has the ability of echolocation for orientation and foraging.
Further reading on general morphology and physiology of the harbour porpoise: Read et al. (1997) [17] and Huggenberger et al. (2009) [18].
Blubber
To cope in cold waters, harbour porpoises are adapted with a blubber layer consisting mainly of fatty acids. This layer plays a role in thermoregulation, short-term energy storage, buoyancy and streamlining of the body [19]. Because of their small body size and therefore a large surface-volume ratio, there is much heat loss. Therefore, harbour porpoises allocate a larger amount of their body mass to blubber, compared to other marine mammals [16]. The thickness of the blubber layer of harbour porpoises varies amongst age classes, especially in the thoracic-abdominal region of the body. Blubber in the posterior region probably plays a role in the locomotion, as little variation is found between reproductive classes. The thoracic-abdominal blubber layer is thickest in calves (ca 23 mm), because of its important role in insulation and energy storage to enhance the survival chances during the first year (in case of food shortage and lack of good foraging abilities). Insulation by blubber is very important in calves, because there is a larger amount of heat loss due the larger surface-volume ratio in young animals compared to adults. Because of their small size, the surface-volume ratio of calves and mature harbour porpoises is larger compared to other marine mammals. In mature males and non-lactating females the blubber has an intermediate thickness (ca 17 mm). Pregnant and lactating females have the thinnest blubber layer (ca 14 mm). In contrast to other marine mammals, the blubber layer of harbour porpoises is an enantiomeric property, meaning that blubber thickness decreases with increasing body size [19].
Further reading on thermoregulation in cetaceans: Read et al. (1997) [17] and Perrin et al. (2009) [20].
Biosonar and acoustics
Toothed wales (Odontoceti) use biosonar for foraging and orientation, in order to determine the position of potential prey or obstacles. This adaptation called echolocation is necessary to live in water where light barely penetrates or where food is distributed at higher depth or in unpredictable patterns [21]. The harbour porpoise has special physiological adaptations of the body to emit acoustic signals and receive the returned echoes. The acoustic signals (clicks) are unique to each species (see frequency) and therefore allow to discriminate the harbour porpoise from other Odontoceti. However, this adaptation does not imply that odontocetes do no use their vision at all, as a study with blindfolded porpoises showed a reduction in swimming speed [22]. Further research is required on the topic of vision.
Physiology of acoustics
Kastelein et al. (1997) [23] investigated the pathway of sound in the harbour porpoise and, like many previous researchers [24], [25] and [26], found that underwater echolocation signals are especially received via the pan-bone (acoustic window formed by an oval-shaped opening in the interior face of the mandibular bone). When blocking off the external auditory meatus by placing ear cups on the meatal orifices, the hearing sensitivity is not significantly affected. Also, this does not lead to damage to the tympanic membrane, confirming earlier findings that the external auditory meatus of porpoises are partly blocked with mucous substances, lipids or fibrous tissue [23].
Harbour porpoises have an alternative way to receive acoustic signals by detecting bone conductor signals at various places on the body. Like in other odontocetes, its underwater hearing covers a wide frequency range and it has an efficient directional hearing capacity. The tympanic bulla (enclosing the middle and inner ear) is connected to the skull by cartilage, connective tissue and fat (instead of a bony connection). This connection improves directional hearing under water. Being able to detect bone conductor signals suggests that sound is well conducted from the auditory meatus, or the surrounding tissues, to the inner ear of harbour porpoises. The detection of bone conductor signals presented at various locations on the harbour porpoise’s body is frequency-dependent [27].
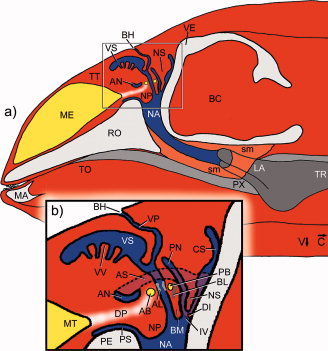
Cranford et al. (1996) [28] found strong evidence for nasal sound production in echolocation in odontocetes. Although the exact mechanism is unclear, Cranford et al., 1996 [28] identified the monkey lips/ dorsal bursae complex (MLDB) as the location of sound production (see figure 3). A pair of elliptical fat bodies (dorsal bursae) in the monkey lip on each side of the head, are located just above the nasal plugs in the airways. Sound vibrations are generated in the fat tissue of the dorsal bursae by forcing air and fluid over the edges of the nasal plugs by means of a pneumatic mechanism. The vibrations are then transferred to the forehead, probably aided by the form of the skull, connective tissues, and the nasal air sacs Finally, the vibrations are transferred to the surrounding water via the melon - a body of ‘acoustic fat’ in the bulbous forehead of the porpoise – which helps to focus and orient the sound [18].
Further reading on anatomy and physiology of the biosonar and acoustics in odontocetes: Read et al. (1997) [17], Huggenberg et al. (2009) [18] and Perrin et al. (2009) [20].
Echolocation behaviour
The acoustic signals emitted by harbour porpoises, cover a very broad frequency range, from 40 Hz to 140 kHz [29]. Optimal frequencies are situated into a range between 100 and 140 kHz (Kastelein et al., 2002 33971). The signals consist of 4 components: 1) low-frequency (LF) components of high amplitude (1.4 kHz – 2.5 kHz), 2) mid-frequency (MF) components of low amplitude (between 30 kHz and 60 kHz), which may be ‘lower harmonics’ of high-frequency (HF) components, 3) broadband mid-frequency components (13 – 100 kHz) and 4) HF components (110 kHz – 140 kHz). The high frequency components are especially used for detection of objects. Continuous sine signals (40 – 600 Hz), or whistles, which have variable frequencies, have also been recorded; these are believed to be social signals [29] and [30].
Harbour porpoises emit high-frequency, narrowband ‘clicks’ or acoustic signals for echolocation purposes. The clicks have an average duration of 100 microseconds (µs), an inter-click interval of on average 60 milliseconds (ms), a frequency of 130 kHz and a maximum intensity level of 172 dB (re 1 µPa pp @ 1 m). These characteristics of echolocation signals were recorded for harbour porpoises in captivity [32], [33], [34] and [35]. Harbour porpoises are expected to have a significantly shorter detection range in echolocation compared to that of larger odontocetes, because the signal intensity is lower [31]. In general, the size of the sound production organ, which depends on the size of the animal, is inversely proportional to the transmission beam size and directly proportional to the directivity. This implicates that the small harbour porpoises have a broad transmission beam and thus a lower directivity [36]. However, the small size of the harbour porpoise may be relevant for a high-frequency use of echolocation signals, enhancing directivity [21]. A series of clicks emitted by the harbour porpoises are called ‘click trains’. It is likely that the click repetition rate depends on the animal’s vigilance. Regular click trains are produced when the animal is navigating at ease. The signal repetition frequency increases considerably to above 500 Hz, when the porpoise’s attention is drawn to an object. Both LF- and HF components are recorded in the click trains, mid-frequency range appears in high-amplitude signals [30].
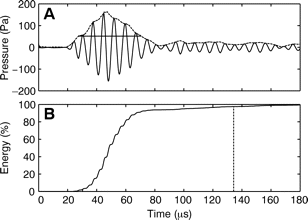
Villadsgaard et al. (2007) [31] wanted to know at what distance the harbour porpoise ‘sees’ objects in the water (vessels, fishing nets, other porpoises,... ). This information is important for the development of acoustic methods to reduce bycatch and for passive acoustic monitoring (PAM) as they depend on the biosonar performance of harbour porpoises. In table 1 the data from the comparison of the echolocation clicks of wild harbour porpoises and captive specimens are shown (modified from Villadsgaard et al., (2007) [31]. In Figure 4 (A) and (B), a typical signal envelope of a harbour porpoise (dotted line), with an outline of the extremes in amplitude, and the accumulated energy content (%) in the click over time are shown.
Further reading on echolocation behaviour by the harbour porpoise: Villadsgaard et al. (2007) [31], Read et al. (1997) [17] and Perrin et al. (2009) [20].
| Wild porpoises | Captive porpoises | |
|---|---|---|
| Fish | 40 m | 10 m |
| Gill net | 13-26 m | 3-6 m |
| T-PoD | 260-400 m | 38-85 m |
Distribution of the harbour porpoise in the North Sea
North Sea
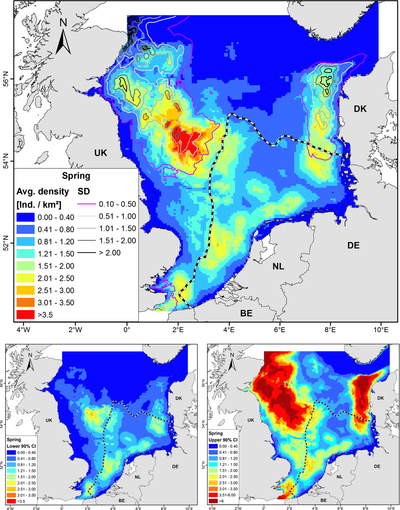
In general, harbour porpoises are found in deeper waters close to the coast [38], [39], [37]. Gilles et al., 2016 [37] developed habitat-based density models on harbour porpoises in Belgium, the Netherlands, Germany, UK and Denmark. Therefore, observations of harbour porpoises by aerial surveys were used and multiple predictors (depth, distance to sandeel grounds, distance to the coastline, sea surface temperature, proxies for fronts and daylength) were considered. These models produced seasonal maps of the predicted densities of harbour porpoises in the North Sea. Figure 5 shows the predicted harbour porpoise distribution during spring.
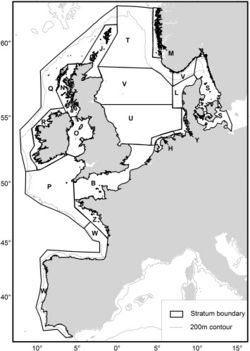
The SCANS II project in 2005 (Small Cetaceans Abundance in the North Sea and adjacent waters) [40] and [41] was the second large-scale survey in the North Sea and adjacent waters to assess the population of harbour porpoises, after the first SCANS project in 1994 [42]. This large-scale survey was conducted with the aim to determine the extent of measures that need to be taken to reduce levels of bycatch and to recover populations or maintain a favourable conservation status. The North Sea is an important source of animal protein both for marine animals and for the human population (sea fishing). Unfortunately, bycatch of small cetaceans during fishing activities is a major threat to their conservation. In European Atlantic waters and in the North Sea, the harbour porpoise is one of the species with highest bycatch levels in bottom set gillnet fisheries [40]. Aerial and shipboard surveys were carried out to estimate the abundance for each survey block, represented in figure 6. Table 2 and 3 show the results.
Densities estimated from the SCANS II survey were similar for most survey blocks and ranged between 0.274 and 0.394 ind/ km². Lowest abundance were found in offshore regions near west of Scotland and Ireland (block Q) and near coasts of SW France, Spain and Portugal (block W). Highest estimated abundances were in the south/central North Sea (block U) and off the west coast of Denmark (block L). Although the overall abundance was consistent for both SCANS surveys, the model-based density surfaces showed a notable difference in harbour porpoise distribution between 1994 and 2005, possibly caused by bycatch on harbour porpoise in some parts of the study area [41].
| Species | Beaufort | Truncation distance (m) | P | Q | S | T | U | V | W | Total | ||
|---|---|---|---|---|---|---|---|---|---|---|---|---|
| Harbour porpoise | < 2 | 1000 | Tracker | 69 | 2 | 121 | 47 | 119 | 114 | 10 | 482 | |
| Primary | 53 | 7 | 96 | 51 | 108 | 45 | 4 | 364 | ||||
| Duplicate | 15 | 0 | 28 | 14 | 19 | 15 | 1 | 92 |
| Species | B | H | J | L | M | N | O | R | Y | Z | Total |
|---|---|---|---|---|---|---|---|---|---|---|---|
| Harbour porpoise | 122 | 25 | 5 | 103 | 44 | 37 | 73 | 79 | 9 | 0 | 546 |
The difference in distribution between 1994 and 2005, may be simply due to interannual variation. However, the recent increases in sightings of harbour porpoises off the Dutch coast and harbour porpoise strandings and bycatches in the Southern North Sea strongly suggest that the difference reflects a trend. Perhaps the most likely reason for the changes in harbour porpoise distribution is a change in the distribution and/or availability of key prey species. Harbour porpoises range widely and, although their diet is varied, they feed primarily on species that are widely distributed, such as sandeel, whiting and herring. Research has shown that porpoises left areas rich in sandeels (Ammodytes sp.) and moved to an area with abundant leaner gobies (Pomatoschistus sp.) and whiting (Merlangius merlangus) [43]. Furthermore, several studies on habitat preferences of harbour porpoises in the North Sea, often links them to areas with strong currents and steep slopes that are associated with small-scale upwelling zones and as a consequence with areas of prey aggregation [39].
Heath (2005) [44] and Christensen and Richardson (2008) [45] found that during the last decades the structure of the food web in the North Sea has changed markedly because of large scale fisheries removals and the influence of decadal scale oceanic changes. Appropriate mitigation steps are required to sustain the apparent recovery of porpoises in the Southern North Sea [46].
Extensive research on the harbour porpoise is done by Germany in the Baltic Sea as it is the only cetacean species resident there (see list below):
- ASCOBANS (Agreement on the Conservation of Small Cetaceans in the Baltic, North East Atlantic, Irish and North Seas) [14].
According to the EC Habitat Directive (92/43/EEC 1992), EU Member states –specifically those with significant populations in their marine waters – have the obligation to protect the harbour porpoise (listed on Annex II) by designating MPAs, referred to as Special Areas of Conservation (SAC). Following article 17 of the Habitat Directive, each member state has to report about the conservation status of these areas every six years. A next assessment is to be completed by 2018. The harbour porpoise is also protected under the Agreement on the conservation of Small Cetaceans in the Baltic, North East Atlantic, Irish and North Seas (ASCOBANS). To this purpose, there is a need for accurate information about the abundance, spatial and temporal (seasonal) distribution, ecology, key habitat, and behaviour of the species.
Citation: European Marine Observation Data Network (EMODnet) Biology project (www.emodnet-biology.eu), funded by the European Commission’s Directorate - General for Maritime Affairs and Fisheries (DG MARE).
The mapped images, raster files and used parameters can be downloaded here.
·
Abundance and distribution of the harbour porpoise in the Belgian part of the North Sea
The harbour porpoise is a common species in the Belgian part of the North Sea (BPNS) and is reported since at least the 14th century [51], [52] and [10]. Harbour porpoises, called ‘meerzwijnen’ in Dutch during the Middle Ages, were exploited [10]. In 1340, fishermen were granted permission to harpoon porpoises because they were claimed to be a nuisance and damage the fishing nets [53]. By the mid of the 20th century, this species was less abundant in Belgian waters, but recently (since the end of the 20th century) it occurs in higher abundance in the BPNS [54]. Because of this increase in abundance, it is important to know where the key habitat(s) of the harbour porpoise are situated, as well as seasonal shifts in its distribution patterns.
Haelters et al. (2013) [55] conducted aerial surveys in the Belgian part of the North Sea between 2008 and 2013. The results of these surveys indicate that harbour porpoises occur throughout the BPNS all year. Spatio-temporal patterns however suggest a shift from the north towards the southwest and western parts in late winter and early spring (February to April). The authors found highest densities in spring with up to 2.7 individuals per km² in the west (March 2011). From May to August numbers are lower, and they tend to stay in more offshore waters to the north: lowest densities (between 0.05 and 0.16 ind./km²) were recorded during summer (August 2009). Close to shore they reach higher densities in the west than in the east. Offshore up to around 30 km, densities appear to be consistently lower. Although aerial surveys are lacking for autumn, data from porpoise detectors (PoDs, see below) seem to confirm the temporal and spatial patterns from the aerial surveys [56] and [57].
Prey
According to Haelters et al. (2011) [57] the observed patterns described above, can be explained by migration, random movement, dispersal or avoidance of areas with temporarily poorer feeding conditions or availability of prey. Due to the limited area of the Belgian waters (3454 km²) compared to the larger distribution range of the harbour porpoise (750.000 km²), the pattern of its distribution in the BPNS is variable. Also Degraer et al. (2013) [58] explained the species’ distribution throughout the year by the seasonal movement linked to the availability of food. The primary energy storage of porpoises is found in the inner blubber layer of the thorax, which has a higher temperature, compared to the outer layer. Therefore, lipids in the inner layer are more easily mobilised [21]. Because of the small size of the harbour porpoise, it cannot store as much energy as other cetaceans, so it has to eat regularly to keep warm and to stay fit. The average food consumption per day is between 2.5 and 5 kg [59]. Therefore, the harbour porpoise always stays close to its food source or follows mobile prey. So food availability is a strong drive for the movements of the porpoises. For further reading on distribution patterns of the harbour porpoise in the wider North Sea, see Hammond et al., (2002) [42], Hammond et al. (2013) [41] and Gilles et al. (2016) [37].
For further reading on feeding biology: Christensen and Richardson (2008) [45].
Noise
Just like humans, animals can suffer hearing damage or mental disturbances due to elevated noise levels, even complete deafness can occur. Underwater sound travels at a speed of 1500 m/s, and can travel up to considerable distances. The Marine Strategy Framework Directive (MSFD) of the European Commission (EC) describes goals of good environmental status related to underwater noise. The level of impulsive sounds induced by humans should be lower than 185 dB re 1 μPa at a distance of 750 m from the source and there should be no positive trend in the noise level between the 1/3 octave bands of 63 Hz and 125 Hz (Directive 2008/56/EC, article 10).
A good environmental status related to underwater noise is reached (Directive 2008/56/EC, article 9):
- When low frequency impulsive sounds do not have an adverse impact on marine organisms.
- When loud low and mid frequency impulsive sounds and continuous low frequency sounds from human activities do not have an adverse impact on marine ecosystems.
Shipping is an important source of noise affecting marine mammals, especially in areas with dense shipping traffic such as the North Sea [60].
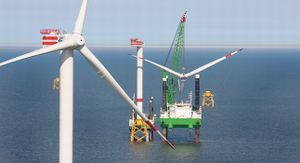
Another important source of acoustic impact is the construction of windfarms, in particular during the construction phase when mono- or pin piles are driven in the seafloor (see figure 8). For pile driving, sound pressure levels (peak to peak, SPL ) of up to 200 dB re 1 pPa at a distance of 750 m from the noise source have been measured or estimated [61], [62] and [63].
The species suffers a significant noise disturbance up to a distance of 8 km for pin piling and 16 km for mono-piling [64] and [63]. Research on the estimated average densities of harbour porpoises in the Belgian waters during March and April of 2011 showed abundance density of respectively 2.5 and 1.3 animals/ km² before and during piling [64]. Average density halved during piling probably due to a combination of disturbance by pile driving over a large part of this area and by the onset of a general seasonal movement out of Belgian waters.
Both aerial surveys and the application of the model to a reference situation during pile driving indicated a disturbance up to at least 20 km from the piling location in Belgian waters [65]. Porpoises were encountered again at the construction sites only 5.9 h to 7.5 h after completion of the pile driving phases [66].
Wind farms

During bird monitoring surveys in the operational offshore wind farm parks, a total of 35 harbour porpoises were observed between September 2010 - December 2012 on the Bligh Bank (see figure 9), a relatively high sighting rate compared to observations in the control area and before the construction of the wind farm. However, this difference was not significant [67]. The apparent attraction of the porpoises to operational wind farms is explained by the increased abundance of fish who in their turn are attracted by the new habitats formed by the hard substrate of the foundations of the wind turbines (reef effect). Another plausible explanation for the increased abundance of porpoises in the vicinity of the wind farms is thetotal prohibition of fishing and shipping (shelter effect). As present wind farm areas cover a relatively small area compared to the foraging area for the porpoises, differences in prey density within and outside the wind parks possibly do not as yet affect the local distribution patterns of porpoises on a small temporal and spatial scale. However, once all planned wind farms will be operational, these differences may become significant [58]. Such an attraction effect was already confirmed In Dutch offshore wind farms [68]. Long-term monitoring is important to follow the effect on harbour porpoise distribution and feeding ecology [58]. Underwater noise data is required to investigate the hearing sensitivities of harbour porpoises and to compare with data collected through passive acoustic monitoring (PAM) [58].
According to the research of Reubens et al. (2013) [69], cod (Gadus morhua) is attracted towards the offshore windfarms by the reef effect. Contrastingly, Debusschere et al. (2016) [70] found that sea bass (Dicentrarchus labrax) is experiencing acoustic stress because of the pile driving.
Strandings
Throughout the wide distribution area of the harbour porpoise, accidental catches in fisheries and strandings occur [72]. Data on the annual number of stranded animals collected from Belgian beaches between 1970 to the first decade of the 21st century, showed a tenfold increase. This increase started specifically during the last years of the 20th century, and suggest a recent increase in harbour porpoise numbers in Belgian and adjacent waters [57] and [72]. This apparent increase in abundance is however related to a shift in the distribution of the population, rather than an increase in the population size [59] and [40], see also above). Further, a clear seasonal pattern was shown by Haelters et al. (2012) [72]. Two peaks of strandings were observed in late winter – early spring and in summer, probably because of the higher abundance of harbour porpoises in the BPNS during that period. In June and in autumn and early winter less animals were found on the beach. Strandings of harbour porpoises are mainly caused by bycatch in fisheries. Additional causes are collisions with ships and natural mortality by starvation, disease or predation (by seals). Also, some juvenile animals and pregnant females strand because of mortality at birth or during giving birth [72].
The Management Unit of the North Sea Mathematical Models (MUMM) coordinates the research of sea birds and sea mammals that end up on our beaches or are found at sea or caught by mistake. MUMM makes sure that the carcasses of stranded marine mammals are made available for scientific research. Examining carcasses can reveal the problems facing these groups of animals. Such problems include pollution by oil, pesticides, heavy metals and PCBs, overfishing and animals being caught up in fishing nets. MUMM has equipment to transport live stranded dolphins. These animals are transferred to specialised rehabilitation centres where they are cared for and later released again. MUMM keeps a database containing up-to-date details of seals, whales and turtles observed and stranded. This database goes back to the middle ages, with some historical data on stranded whales. Information on observations and stranded sea mammals is important to assess the population of these animals [73].
Strandings on Belgian beaches are recorded in the Marine Mammals Strandings Database [74] of RBINS (Royal Belgian Institute of Natural Sciences).
Survey methods for the harbour porpoise
According to the EC Habitat Directive (92/43/EEC 1992), EU Member states – specifically those with significant populations in their marine waters – have the obligation to protect the harbour porpoise (Listed on Annex II) by designating MPAs. To do so, high-density areas of the harbour porpoises – that are relatively stable over time - need to be identified [75]. Identifying these areas of higher density requires systemic surveying of the BPNS. Surveys can be conducted by satellite tracking, visual and/or acoustic recordings. Combined acoustic and visual methods proved to be a valuable tool for monitoring the distribution of dolphins and identifying important habitats, it is a practical and cost effective tool. Among other, it provides a good basis for the development and implementation of management plans for the cSAC (candidate Special Area of Conservation) [76].
Visual surveys
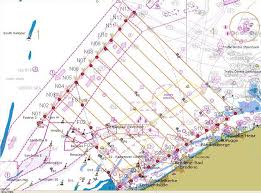
One of the oldest ways to survey marine mammals is visually counting, on boats and later also on airplanes. Different methods are created to cover and count correctly the surveyed areas. The most common used one is called ‘Distance Sampling’, which both includes point- and line-transect sampling. Figure 11 shows the transects in the BPNS used for aerial surveys. Because Phocoena phocoena is a small cetacean with a rather undemonstrative behaviour, it is difficult to detect them by visual surveys, except when weather conditions are good [42]. This sampling technique has some disadvantages, as animals may be missed by the observers (perception bias) or because they show diving behaviour (availability bias) [57]. Another disadvantage is the attraction or scaring away of the harbour porpoises by the survey vessel or aircraft [42].
Survey areas are stratified into blocks based on logistical constraints and existing information on the species distribution. Aerial surveys are especially executed in blocks covering coastal waters, which are either less accessible by ships and/or which have high densities of P. phocoena [42]. Aerial surveys also cover larger areas in the same amount of time, compared to shipboard sampling. Zigzag cruise tracks are flown to give a known, non-zero coverage probability to each point in the survey block. This aims at an unbiased estimate of abundance, regardless of the distribution of animals within the block. Zigzag designs are also sometimes preferred over regular parallel transect placement due to the complexity and fragmentation within parts of the survey area, like for Viquerat et al. (2014) [78] where a line-transect survey was conducted in the Kattegat, the Belt Seas and the Western Baltic to assess harbour porpoise (Phocoena phocoena) abundance in the so called 'GAP area' between the North Sea and the Baltic Proper.
The aircraft's or boat’s position and time are recorded automatically every few seconds onto a laptop computer connected to a GPS. Sighting information and details on environmental conditions are normally entered manually by the data recorder. Applications are the determination of the abundance of harbour porpoises with evaluation of the effect of bycatch, which was done in the south-western Baltic Sea [79] or estimations of densities and abundance to create distribution maps, such as on the entire Dutch Continental Shelf [80]. Two important projects were the SCANS surveys I in 1994 and II in 2005 (small cetacean abundance in the North Sea and adjacent waters). The objectives were to identify concentrations of P. phocoena and other small marine mammals in this area and to estimate their abundance in order to provide essential information for conservation, management and future monitoring [42] and [41].
Satellite tracking
In the last decade, satellite tagging has been conducted in order to investigate harbour porpoise movement, behaviour, and presence in relation to environmental factors [81], [38], [82], [83], [84]. Satellite tracking can provide detailed information on individual movements for up to a year and has the advantage of combining temporal and spatial information on a broader scale, while visual surveys can only be conducted in daylight under calm weather conditions, which generally limits large-scale surveys to the summer months. Sveegaard et al., 2011b 241475[82] analysed satellite data recorded between 1997 and 2007 from the North Sea through Skagerrak, Kattegat, and Belt seas to the western Baltic. Results showed that harbour porpoises are not evenly distributed, but congregate in nine high-density areas within the study area. The use of satellite telemetry for identifying areas of high harbour porpoise density can be used as a key of importance when designating marine protected areas (MPAs).
Acoustic surveys
Harbour porpoises make distinctive narrowband echolocation click-sounds to navigate and search for prey. They have a dominant high-frequency click, around 130 kHz, that discriminates them from other ocean sounds which makes it easier to capture their signals [31] and [75] (For more information about the acoustics of the harbour porpoise, click here). The use of an acoustic detection system has the advantages of being independent by weather, observer variability and available manpower; it constitutes a reliable, cost-effective alternative. The disadvantages are the lack of prove that reliable absolute-density estimates can be derived from acoustic surveys and whether or not the porpoises are attracted or deterred by survey vessels. Another bias is pointed to the diel and seasonal echolocation activity of the porpoises and their changing dive rates [75]. There are two different methods to use. One is a static, passive acoustic monitoring (PAM) device with self-contained click detectors and acoustic data loggers, all moored at sea. They are called T-PoDs (Timing Porpoise Detectors) and register the echolocation signals of those cetaceans. The other method is towing of hydrophone arrays behind or underneath the research vessel.
T-PoDs
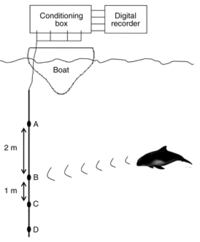
T-PoDs are recently more and more in use for its advantages comparing to visual surveys, as it can be used at a constant rate, and under adverse weather conditions. Figure 12 shows the setup of a T-PoD.
Verfuß et al. (2007) [85] used acoustic detections to determine graphical and seasonal differences of the harbour porpoises. With 42 measuring positions with T-PoDs at five to seven meter below the water surface, he found out that the species was present in the German Baltic Sea all year round, with decreasing detections from west to east, as well as increasing porpoise detections during the breeding and mating seasons (spring and summer), and a subsequent decrease in winter time. A seasonal pattern in acoustic detection rates was also recorded by Benke et al. (2014) [86]. Due to low porpoise densities in the Baltic Sea, acoustic monitoring appears to be the most effective method of detecting changes in harbour porpoise distribution. Passive acoustic monitoring was also applied in the Belgian waters by Haelters et al. (2011) [57], also suggesting a seasonal pattern (highest abundance in late winter-early spring).
The diel cycle of the harbour porpoise is being analysed using the T-PoDs to detect the appearance of the harbour porpoises throughout the day [87]. By analysing the results of the recorded click times, they found a significant variation in all echolocation variables within the diel cycle.
Carstensen et al. (2006) [88] and [66] Brandt et al. (2012) wanted to relate the echolocation of the harbour porpoises to their densities and their behaviour on the potential impact of the construction of offshore wind farm parks. They both found out, according to the acoustic activity, that there was marked difference in habitat-use of the porpoises, as harbour porpoises were moving away from pile driving sites. After some while, an increase in the number of porpoises occurring inside the operating wind farm could be detected with T-PoD monitoring devices [68].
Towed hydrophones
An automatic porpoise detection system [89] was developed to detect the high frequency sounds produced by harbour porpoises (see figure 13). The distinctive clicks they make are captured by high-frequency hydrophones and are then transmitted to a computer, which displayed single or multiple tracks of clicks [75]. As the hydrophones are towed by the research vessel (see figure 13), they can monitor a much bigger area than the static T-PoDs. During SCANS II [40] they used this method to detect the shift of harbour porpoise distribution within the North Sea, with the main concentration shifting from the northwest in 1994 to the southwest in 2005.
Recent studies have used this method to compare and confirm research on the harbour porpoise with other methods. Sveegaard et al. (2011) [75] used towed hydrophones to compare existing data from satellite tracking with the individual acoustic surveys to measure a relative abundance and identify key-habitats of the harbour porpoises. In Gillespie et al. (2005) [90] low porpoise detection rate in the survey of the entire Baltic Sea block was found and compared with the low density found by the aerial survey conducted in 1995 in this area. In the future, they want to be able to estimate absolute abundance.
References
- ↑ WoRMS Editorial Board (2016). World Register of Marine Species. Available from http://www.marinespecies.org at VLIZ. Accessed 2016-08-31. doi:10.14284/170.
- ↑ [Marine Regions. http://www.marineregions.org/gazetteer.php?p=details&id=26567.
- ↑ http://www.ascobans.org/en/news/15-may-2016-celebrating-international-day-baltic-harbour-porpoise
- ↑ EMODNET-Biology. http://www.emodnet-biology.eu/portal/index.php.
- ↑ Haelters, J.; Kerckhof, F.; Jauniaux, T.; Degraer, S. (2012)., The Grey Seal (Halichoerus grypus) as a predator of Harbour Porpoises (Phocoena phocoena)? Aquat. Mamm. 38(4): 343-353.
- ↑ van Bleijswijk, J.; Begeman, L.; Witte, H.J.; IJsseldijk, L.L.; Brasseur, S.M.J.M.; Gröne, A.; Leopold, M.F. (2014). Detection of grey seal Halichoerus grypus DNA in attack wounds on stranded harbour porpoises Phocoena phocoena. Mar. Ecol. Prog. Ser. 513: 277-281.
- ↑ Bouveroux, T; Kiszka, J; Heithaus, R; Jauniaux, T.; Pezeril, S (2014). Direct evidence for gray seal (Halichoerus grypus) predation and scavenging on harbor porpoises (Phocoena phocoena). Mar. Mamm. Sci. 30(4): 1542-1548.
- ↑ Jauniaux, T.; Garigliany, M.-M.; Loos, P.; Bourgain, L; Bouveroux, T; Coignoul, F.; Haelters, J.; Karpouzopoulos, J; Pezeril, S; Desmecht, D. (2014). Bite injuries of Grey seals (Halichoerus grypus) on Harbour porpoises (Phocoena phocoena). PLoS One 9(12): dx.doi.org/10.1371/journal.pone.0108993.
- ↑ Leopold, M.F.; Begeman, L.; van Bleijswijk, J.D.L.; IJsseldijk, L.L.; Witte, H.; Gröne, A. (2015). Exposing the grey seal as a major predator of harbour porpoises. Proc. R. Soc. Lond. (Biol. Sci.) 282(1802): 20142429.
- ↑ 10.0 10.1 10.2 De Baets, P. (2013). Walvissen op de Vlaamse kust en in het Scheldebekken. Biekorf 113(4): 385-413.
- ↑ MSFD. http://eur-lex.europa.eu/legal-content/EN/TXT/?uri=CELEX:32008L0056.
- ↑ Habitat Directive. http://eur-lex.europa.eu/legal-content/EN/TXT/?uri=CELEX:31992L0043.
- ↑ OSPAR. http://www.ospar.org/.
- ↑ 14.0 14.1 ASCOBANS.http://www.ascobans.org/.
- ↑ [http://www.marinespecies.org/aphia.php?p=image&pic=15757.
- ↑ 16.0 16.1 McLellan, W.A.; Koopman, H.N.; Rommel, S.A.; Read, A.J.; Potter, C.W.; Nicolas, J.R.; Westgate, A.J.; Pabst, D.A. (2002). Ontogenetic allometry and body composition of harbour porpoises (Phocoena phocoena, L.) from the western North Atlantic. J. Zool. (1987) 257(4): 457-471.
- ↑ 17.0 17.1 17.2 17.3 Read, A.J.; Wiepkema, P.R.; Nachtigall, P.E. (1997). The biology of the harbour porpoise. De Spil Publishers: Woerden. ISBN 90-72743-07-5. XV, 410 pp.
- ↑ 18.0 18.1 18.2 18.3 Huggenberger, S.; Rauschmann, M.; Vogl, T.J.; Oelschläger, H.H.A. (2009). Functional morphology of the nasal complex in the Harbor Porpoise (Phocoena phocoena L.). Anat. Rec. 292(6): 902-920
- ↑ 19.0 19.1 Koopman, H.N. (1998). Topographical distribution of the blubber of harbor porpoises (Phocoena phocoena). J. Mammal. 79(1): 260-270.
- ↑ 20.0 20.1 20.2 Perrin, W.F.; Würsig, B.; Thewissen, J.G.M. (Ed.) (2009). The encyclopedia of marine mammals. Second edition. Academic Press: London. ISBN 978-0-12-373553-9. xxix, 1316 pp.
- ↑ 21.0 21.1 21.2 Kastelein, R.A.; Bunskoek, P.; Hagedoorn, M.; Au, W.W.L.; de Haan, D. (2002). Audiogram of a harbor porpoise (Phocoena phocoena) measured with narrow-band frequency-modulated signals. J. Acoust. Soc. Am. 112(1): 334-344.
- ↑ Verfuß, U.K.; Miller, L.A.; Pilz, P.K.D.; Schnitzler, H.-U. (2009). Echolocation by two foraging harbour porpoises (Phocoena phocoena). J. Exp. Biol. 212(6): 823-834.
- ↑ 23.0 23.1 Kastelein, R.A.; Nieuwstraten, S.H.; Staal, C.; van Ligtenberg, C.L.; Versteegh, D. (1997). Low-frequency aerial hearing of a harbour porpoise (Phocoena phocoena), in: Read, A.J. et al. The biology of the harbour porpoise. pp. 295-312.
- ↑ Evans, W.E.; Prescott, J.H. (1962). Observations of the sound production capabilities of the bottlenose porpoise: a study of whistles and clicks. Zoologica 47(11): 121-128.
- ↑ Lescrauwaet, A.-C. (1986). Discriminatie in echolocatiegedrag bij Tursiops truncatus (Montagu,1821). MSc Thesis. Rijksuniversiteit Gent, Faculteit der Wetenschappen, Laboratorium voor Zoofysiologie: Gent. 107 pp.
- ↑ Au, W.W.L. (1993). The sonar of dolphins. Springer Verlag: Berlin. ISBN 3-540-97835-6. XI, 277 pp.
- ↑ Kastelein, R.A.; van der Kaay, L.S.P.; Staal, C.; Schooneman, N.M.; van Ligtenberg, C.L. (1997). Detection of bone conductor signals by a harbour porpoise (Phocoena phocoena), in: Read, A.J. et al. The biology of the harbour porpoise. pp. 313-327.
- ↑ 28.0 28.1 Cranford, T.W.; Amundin, M.; Norris, K.S. (1996). Functional morphology and homology in the odontocete nasal complex: Implications for sound generation. J. Morphol. (1931) 228(3): 223-285.
- ↑ 29.0 29.1 Verboom, W.C. (1995). Acoustic signals by Harbour porpoises (Phocoena phocoena), in: Nachtigall, P.E. et al. (Ed.) Harbour porpoises: laboratory studies to reduce bycatch. pp. 1-39.
- ↑ 30.0 30.1 Verboom, W.C.; Kastelein, R.A. (1997). Structure of harbour porpoise (Phocoena phocoena) click train signals, in: Read, A.J. et al. The biology of the harbour porpoise. pp. 343-363.
- ↑ 31.0 31.1 31.2 31.3 31.4 31.5 31.6 31.7 31.8 Villadsgaard, A.; Wahlberg, M.; Tougaard, J. (2007). Echolocation signals of wild harbour porpoises, Phocoena phocoena. J. Exp. Biol. 210: 56-64.
- ↑ Dubrovskii, N.A.; Krasnov, P.S.; Titov, A.A. (1971). On the emission of echo-location signals by the Azov Sea harbor porpoise. Sov. Phys. Acous. 16: 444-447.
- ↑ [Møhl, B.; Andersen, S. (1973). Echolocation: high-frequency component in the click of the harbour porpoise (Phocoena ph. L.). J. Acoust. Soc. Am. 54(5): 1368-1372.
- ↑ Akamatsu, T.; Hatakeyama, Y.; Kojima, T.; Soeda, H. (1994). Echolocation rates of two harbor porpoises (Phocoena phocoena). Mar. Mamm. Sci. 10(4): 401-411.
- ↑ Teilmann, J.; Miller, L.A.; Kirketerp, T.; Kastelein, R.A.; Madsen, P.T.; Nielsen, B.K.; Au, W.W.L. (2002). Characteristics of echolocation signals used by a harbour porpoise (Phocoena phocoena) in a target detection experiment. Aquat. Mamm. 28(3): 275–284.
- ↑ Au, W.W.L.; Kastelein, R.A.; Rippe, T.; Schooneman, N.M. (1999). Transmission beam pattern and echolocation signals of a harbor porpoise (Phocoena phocoena). J. Acoust. Soc. Am. 106(6): 3699.
- ↑ 37.0 37.1 37.2 37.3 Gilles, A.; Viquerat, S.; Becker, E.A.; Forney, K.A.; Geelhoed, S.C.V.; Haelters, J.; Nabe-Nielsen, J.; Scheidat, M.; Siebert, U.; Sveegaard, S.; van Beest, F.M.; van Bemmelen, R.; Aarts, G. (2016). Seasonal habitat-based density models for a marine top predator, the harbor porpoise, in a dynamic environment. Ecosphere 7(6): e01367.
- ↑ 38.0 38.1 Edrén, S.M.; Wisz, M.S.; Teilmann, J.; Dietz, R.; Söderkvist, J. (2010). Modelling spatial patterns in harbour porpoise satellite telemetry data using maximum entropy. Ecography 33(4): 698-708.
- ↑ 39.0 39.1 Gilles, A.; Adler, S.; Kaschner, K.; Scheidat, M.; Siebert, U. (2011). Modelling harbour porpoise seasonal density as a function of the German Bight environment: implications for management. Endang. Species Res. 14(2): 157-169.
- ↑ 40.0 40.1 40.2 40.3 (2006). Small Cetaceans in the European Atlantic and North Sea (SCANS-II). Life Project Final Report. Covering the project activities from 01.04.2004 to 31.12.2006. Sea Mammal Research Unit, Gatty Marine Laboratory, University of St Andrews: Fife. 54 pp.
- ↑ 41.0 41.1 41.2 41.3 41.4 41.5 41.6 Hammond, P.S.; MacLeod, K.; Berggren, P.; Borchers, D.L.; Burt, L.; Cañadas, A.; Desportes, G.; Donovan, G.P.; Gilles, A.; Gillespie, D.; Gordon, J.; Hiby, L.; Kuklik, I.; Leaper, R.; Lehnert, K.; Leopold, M.; Lovell, P.; Øien, N.; Paxton, C.G.M.; Ridoux, V.; Rogan, E.; Samarra, F.; Scheidat, M.; Sequeira, M.; Siebert, U.; Skov, H.; Swift, R.; Tasker, M.L.; Teilmann, J.; Van Canneyt, O.; Vásquez, J.A. (2013). Cetacean abundance and distribution in European Atlantic shelf waters to inform conservation and management. Biol. Conserv. 164: 107-122.
- ↑ 42.0 42.1 42.2 42.3 42.4 42.5 Hammond, P.S.; Berggren, P.; Benke, H.; Borchers, D.L.; Collet, A.; Heide-Jørgensen, M.P.; Heimlich-Boran, S.; Hiby, A.R.; Leopold, M.F.; Øien, N. (2002). Abundance of harbour porpoise and other cetaceans in the North Sea and adjacent waters. J. Appl. Ecol. 39: 361-376.
- ↑ Hesse, E.; Leopold, M.; Mielke, L.; Meesters, E.; Keijl, G.O.; van der Hiele, J.; Begeman, L.; Hiemstra, S.; Jauniaux, T. (2014). Can the junk food hypothesis be applied to harbour porpoises (Phocoena phocoena) in Dutch waters?, in: Abstract book 28th Annual Conference of the European Cetacean Society: Marine mammals as sentinels of a changing environment, Liège, Belgium, 5-9th April 2014. pp. 36.
- ↑ Heath, M.R. (2005). Changes in the structure and function of the North Sea fish foodweb, 1973-2000, and the impacts of fishing and climate. ICES J. Mar. Sci./J. Cons. int. Explor. Mer 62(5): 847-868.
- ↑ 45.0 45.1 Christensen, J.T.; Richardson, K. (2008). Stable isotope evidence of long-term changes in the North Sea food web structure. Mar. Ecol. Prog. Ser. 368: 1-8.
- ↑ Marine Conservation Research International (2012). Final report for a survey for harbour porpoises (Phocoena phocoena) of the Dogger Bank and southern North Sea conducted from R/V Song of the Whale 7th-24th November 2011. MCR International/IFAW: Kelvedon. 19 pp.
- ↑ (2006). The MINOS project: ecological assessments of possible impacts of offshore wind energy projects, in: von Nordheim, H. et al. (Ed.) Progress in marine conservation in Europe: NATURA 2000 sites in German offshore waters. pp. 239-248]
- ↑ BioConsult SH. http://bioconsult-sh.de/en/projects/.
- ↑ SAMBAH. http://www.sambah.org/.
- ↑ [Blazon Wenduine. http://www.ngw.nl/heraldrywiki/index.php?title=Wenduine.
- ↑ Verhoeven, W.G.F. (1781). Gecroonde verhandelinge door de Keyzerlyke en Koninglyke Academie van Wetenschappen en Letter-kunde van Brussel ten jaere 1780 tot antwoord op de vraeg: Aen te wyzen de soorten van visschen die het gemeyn voorwerp zyn van de vangst, zoo op de kusten als in de rivieren van Vlaenderen, de misbruyken, die in die visscheryen in swang zyn, te kennen te geéven, met de middelen om de zelve te verbeéteren. Gedrukt by P.J. Hanicq, boek-verkooper: Tot Mechelen. 58 pp.
- ↑ Egmond, F.; Mason, P.; Lankester, K. (Ed.) (2003). Het walvisboek: walvissen en andere zeewezens beschreven door Adriaen Coenen in 1585. Walburg Pers: Zutphen. ISBN 90-5730-282-9. XVI, 208 pp.
- ↑ Lepeer, E. (1974). Vin Dune an de Zee. Gemeentebestuur van Wenduine: Wenduine. 325 pp.
- ↑ Haelters, J. (2007). Walvisachtigen in Belgische wateren: vreemde luizen of toch niet?, in: De Grote Rede 20. De Grote Rede: Nieuws over onze Kust en Zee, 20: pp. 2-7.
- ↑ Haelters, J.; Vigin, L.; Degraer, S. (2013). Attraction of harbour porpoises to offshore wind farms: what can be expected?, in: Degraer, S. et al. (Ed.) Environmental impacts of offshore wind farms in the Belgian part of the North Sea: Learning from the past to optimise future monitoring programmes. pp. 167-171.
- ↑ Haelters, J.; Jacques, T.G.; Kerckhof, F.; Degraer, S. (2010). Spatio-temporal patterns of the harbour porpoise Phocoena phocoena in the Belgian part of the North Sea, in: Degraer, S. et al. (Ed.) Offshore wind farms in the Belgian part of the North Sea: Early environmental impact assessment and spatio-temporal variability. pp. 153-164.
- ↑ 57.0 57.1 57.2 57.3 57.4 Haelters, J.; Kerckhof, F.; Jacques, T.G.; Degraer, S. (2011). The harbour porpoise Phocoena phocoena in the Belgian part of the North Sea: trends in abundance and distribution. Belg. J. Zool. 141(2): 75-84.
- ↑ 58.0 58.1 58.2 58.3 Degraer, S.; Brabant, R.; Rumes, B. (Ed.) (2013). Environmental impacts of offshore wind farms in the Belgian part of the North Sea: Learning from the past to optimise future monitoring programmes. Royal Belgian Institute of Natural Sciences (RBINS), Operational Directorate Natural Environment, Marine Ecology and Management Section: Brussels. ISBN 978-90-9027-928-2. 239 pp.
- ↑ 59.0 59.1 59.2 59.3 Lockyer, C. (2007). All creatures great and smaller: a study in cetacean life history energetics. J. Mar. Biol. Ass. U.K. 87(4): 1035-1045. Cite error: Invalid
<ref>tag; name "test" defined multiple times with different content Cite error: Invalid<ref>tag; name "test" defined multiple times with different content Cite error: Invalid<ref>tag; name "test" defined multiple times with different content - ↑ Dyndo, M.; Wisniewska, D.M.; Rojano-Doñate, L.; Madsen, P.T. (2015). Harbour porpoises react to low levels of high frequency vessel noise. NPG Scientific Reports 5(11083): 9 pp.
- ↑ Madsen, P.T.; Wahlberg, M.; Tougaard, J.; Lucke, K.; Tyack, P. (2006). Wind turbine underwater noise and marine mammals: implications of current knowledge and data needs. Mar. Ecol. Prog. Ser. 309: 279-295.
- ↑ Norro, A.; Haelters, J.; Rumes, B.; Degraer, S. (2010). Underwater noise produced by the piling activities during the construction of the Belwind offshore wind farm (Bligh Bank, Belgian marine waters), in: Degraer, S. et al. (Ed.) Offshore wind farms in the Belgian part of the North Sea: Early environmental impact assessment and spatio-temporal variability. pp. 37-52.
- ↑ 63.0 63.1 Norro, A.; Rumes, B.; Degraer, S. (2012). Differentiating between underwater construction noise of monopile and jacket foundation wind turbines: A case study from the Belgian part of the North Sea, in: Degraer, S. et al. (Ed.) Offshore wind farms in the Belgian part of the North Sea: Heading for an understanding of environmental impacts. pp. 145-155.
- ↑ 64.0 64.1 Haelters, J.; Van Roy, W.; Vigin, L.; Degraer, S. (2012). The effect of pile driving on harbour porpoises in Belgian waters, in: Degraer, S. et al. (Ed.) Offshore wind farms in the Belgian part of the North Sea: Heading for an understanding of environmental impacts. pp. 127-144.
- ↑ Haelters, J.; Dulière, V.; Vigin, L.; Degraer, S. (2015). Towards a numerical model to simulate the observed displacement of harbour porpoises Phocoena phocoena due to pile driving in Belgian waters. Hydrobiologia 756(1): 105-116.
- ↑ 66.0 66.1 Brandt, M.J.; Diederichs, A.; Betke, K.; Nehls, G. (2012). Effects of offshore pile driving on harbor porpoises (Phocoena phocoena), in: Popper, A.N. et al. (Ed.) The effects of noise on aquatic life. Advances in Experimental Medicine and Biology, 730: pp. 281-284.
- ↑ Vanermen, N.; Stienen, E.; Courtens, W.; Onkelinx, T.; Van de walle, M.; Verstraete, H. (2013). Bird monitoring at offshore wind farms in the Belgian part of the North Sea. Assessing seabird displacement effects. Errata published and added in 2014. Rapporten van het Instituut voor Natuur- en Bosonderzoek, INBO.R.2013.755887. Instituut voor Natuur- en Bosonderzoek (INBO): Brussel. 98 + annexes + errata pp.
- ↑ 68.0 68.1 68.2 Scheidat, M.; Tougaard, J.; Brasseur, S.; Carstensen, J.; van Polanen Petel, T.; Teilmann, J.; Reijnders, P. (2011). Harbour porpoises (Phocoena phocoena) and wind farms: a case study in the Dutch North Sea. Environ. Res. Lett. 6(2): 11 pp.
- ↑ Reubens, J.T.; Pasotti, F.; Degraer, S.; Vincx, M. (2013). Residency, site fidelity and habitat use of Atlantic cod (Gadus morhua) at an offshore wind farm using acoustic telemetry. Mar. Environ. Res. 90: 128–135.
- ↑ Debusschere, E.; Hostens, K.; Adriaens, D.; Ampe, B.; Botteldooren, D.; De Boeck, G.; De Muynck, A.; Sinha, A.K.; Vandendriessche, S.; Van Hoorebeke, L.; Vincx, M.; Degraer, S. (2016). Acoustic stress responses in juvenile sea bass Dicentrarchus labrax induced by offshore pile driving. Environ. Pollut. 208(Part B): 747-757.
- ↑ [http://www.marinespecies.org/aphia.php?p=image&pic=755.
- ↑ 72.0 72.1 72.2 72.3 Haelters, J.; Kerckhof, F.; Toussaint, E.; Jauniaux, T.; Degraer, S. (2012). The diet of harbour porpoises bycaught or washed ashore in Belgium, and relationship with relevant data from the strandings database. Royal Belgian Institute of Natural Sciences. Management Unit of the North Sea Mathematical Models. Marine Ecosystem Management Unit: Oostende. 46 pp.
- ↑ [MUMM. http://www.mumm.ac.be/EN/index.php.
- ↑ Marine Mammals Strandings Database. http://www.mumm.ac.be/EN/Management/Nature/search_strandings.php
- ↑ 75.0 75.1 75.2 75.3 75.4 Sveegaard, S.; Teilmann, J.; Berggren, P.; Mouritsen, K.N.; Gillespie, D.; Tougaard, J. (2011). Acoustic surveys confirm the high-density areas of harbour porpoises found by satellite tracking. ICES J. Mar. Sci./J. Cons. int. Explor. Mer 68(5): 929-936.
- ↑ Hastie, G.D.; Barton, T.R.; Grellier, K.; Hammond, P.S.; Swift, R.J.; Thompson, P.M.; Wilson, B. (2003). Distribution of small cetaceans within a candidate Special Area of Conservation; implications for management. J. Cetacean Res. Manage. 5(3): 261-266.
- ↑ Haelters, J. (2009). Monitoring of marine mammals in the framework of the construction and exploitation of offshore wind farms in Belgian marine water, in: Degraer, S. et al. Offshore wind farms in the Belgian part of the North Sea: State of the art after two years of environmental monitoring. pp. 237-266.
- ↑ Viquerat, S.; Herr, H.; Gilles, A.; Peschko, V.; Siebert, U.; Sveegaard, S.; Teilmann, J. (2014). Abundance of harbour porpoises (Phocoena phocoena) in the western Baltic, Belt Seas and Kattegat. Mar. Biol. (Berl.) 161(4): 745-754.
- ↑ Scheidat, M.; Gilles, A.; Kock, K.-H.; Siebert, U. (2008). Harbour porpoise Phocoena phocoena abundance in the southwestern Baltic Sea. Endang. Species Res. 5(2-3): 215-223.
- ↑ Geelhoed, S.C.V.; Scheidat, M.; van Bemmelen, R.S.A.; Aarts, G. (2013). Abundance of harbour porpoises (Phocoena phocoena) on the Dutch Continental Shelf, aerial surveys in July 2010-March 2011. Lutra 56(1): 45-57.
- ↑ Teilmann, J.; Larsen, F.; Desportes, G. (2007). Time allocation and diving behaviour of harbour porpoises (Phocoena phocoena) in Danish and adjacent waters. J. Cetacean Res. Manage. 9(3): 201-210.
- ↑ 82.0 82.1 Sveegaard, S.; Teilmann, J.; Tougaard, J.; Dietz, R.; Mouritsen, K.N.; Desportes, G.; Siebert, U. (2011). High-density areas for harbor porpoises (Phocoena phocoena) identified by satellite tracking. Mar. Mamm. Sci. 27(1): 230-246.
- ↑ Linnenschmidt, M.; Teilmann, J.; Akamatsu, T.; Dietz, R.; Miller, L.A. (2012). Biosonar, dive, and foraging activity of satellite tracked harbor porpoises (Phocoena phocoena). Mar. Mamm. Sci. 29(2): E77-E97.
- ↑ Mikkelsen, L.; Riget, F.F.; Kyhn, L.A.; Sveegaard, S.; Dietz, R.; Tougaard, J.; Carlström, J.A.K.; Carlén, I.; Koblitz, J.C. (2016). Comparing distribution of harbour porpoises (Phocoena phocoena) derived from satellite telemetry and passive acoustic monitoring. PLoS One 11(7): e0158788.
- ↑ Verfuß, U.K.; Honnef, C.G.; Meding, A.; Dähne, M.; Mundry, R.; Benke, H. (2007). Geographical and seasonal variation of harbour porpoise (Phocoena phocoena) presence in the German Baltic Sea revealed by passive acoustic monitoring. J. Mar. Biol. Ass. U.K. Spec. Issue 87(1): 165-176.
- ↑ Benke, H.; Bräger, S.; Dähne, M.; Gallus, A.; Hansen, S.; Honnef, C.G.; Jabbusch, M.; Koblitz, J.C.; Krügel, K.; Liebschner, A.; Naberhaus, I.; Verfuß, U.K. (2014). Baltic Sea harbour porpoise populations: status and conservation needs derived from recent survey results. Mar. Ecol. Prog. Ser. 495: 275-290.
- ↑ Todd, V.L.G.; Pearse, W.D.; Tregenza, N.C.; Lepper, P.A.; Todd, I.B. (2009). Diel echolocation activity of harbour porpoises (Phocoena phocoena) around North Sea offshore gas installations. ICES J. Mar. Sci./J. Cons. int. Explor. Mer 66(4): 734-745.
- ↑ Carstensen, J.; Henriksen, O.D.; Teilmann, J. (2006). Impacts of offshore wind farm construction on harbour porpoises: acoustic monitoring of echolocation activity using porpoise detectors (T-PoDs). Mar. Ecol. Prog. Ser. 321: 295-308.
- ↑ Gillespie, D.; Chappell, O. (2002). An automatic system for detecting and classifying the vocalisations of harbour porpoises. Bioacoustics 13(1): 37-61.
- ↑ Gillespie, D.; Berggren, P.; Brown, S.; Kuklik, I.; Lacey, C.; Lewis, T.; Matthews, J.; McLanaghan, R.; Moscrop, A.; Tregenza, N. (2005). Relative abundance of harbour porpoises (Phocoena phocoena) from acoustic and visual surveys of the Baltic Sea and adjacent waters during 2001 and 2002. J. Cetacean Res. Manage. 7(1): 51-57.
