Marine geo-information system for the North Sea seafloor
Contents
Introduction
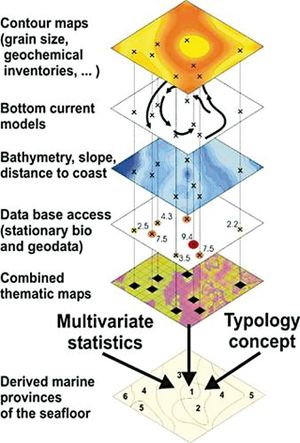
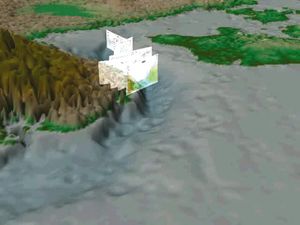
Geo-Information Systems (GIS) are designed for the management, visualisation and analysis of geodata. Geodata refers to all measurements and information which are intrinsically tied to their location (latitude, longitude, depth) of observation. It includes data obtained during scientific marine and landside research as well as geodata compiled for economic and socioeconomic needs. Data measured at distinct locations, thematic maps, georeferenced photographs, videos as well as other types of spatial information can be integrated and analysed by GIS. To facilitate such analysis, the geodata are structured in the form of information layers compiling one parameter set in one map (Fig. 1). *By overlaying information layers, including the attributes, frame, legend etc., the overall map is composed. This allows complex spatial analysis for research objectives such as identification of provinces of the seafloor (Jerosche et al., 2007[1]) or calculation of geochemical budgets (Schlüter et al., 2000[2]), as well as for applications like determination of location factors for the construction of e.g. offshore wind farms or areas suitable for sand and gravel recovery.
Motivation
Worldwide, the coastal zone has a dense population and coastal waters are often subject to different economic demands. Such activities as well as research objectives or issues like identification of natural conservation areas require detailed information and maps about the marine environment. Unfortunately, such maps are often unavailable, due to the lack or low accessibility of environmental data.
This is often a limiting factor, for example for identification of benthic habitats, e.g. according to the European Nature Information System (EUNIS) as well as for studies on submarine groundwater discharge, occurrence of methane in sediments or the release of nutrients from the seafloor. As a step towards the development of a digital information system we compiled an extensive dataset of bathymetric data, sediment maps, benthos biology, geochemical data, (e.g. concentrations of oxygen or nutrients in bottom waters and sediments), as well as about the use of the seafloor. The data compilation and analysis was part of the EC Project METROL and the BMBF/DFG funded project MarGIS.
Application of a spatial database
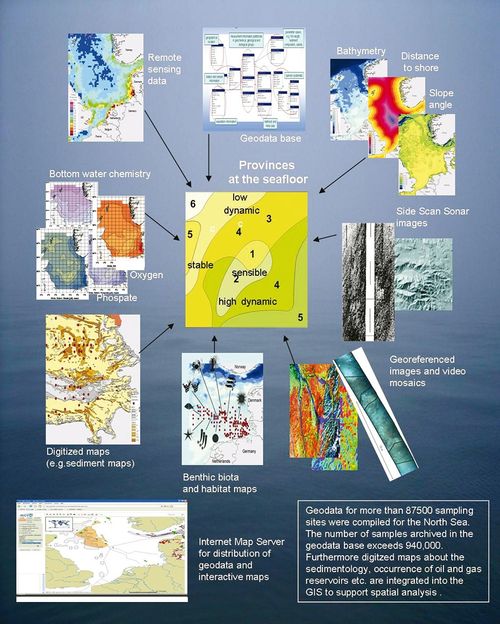
For the compilation of a large data set covering a multitude of parameters for the purpose of comparing geo information the careful description of meta- information is essential (Fig. 2). Regarding maps, such meta-information includes the geographic projection, the geodetic datum (e.g. WGS84), the source or the publication date. To cope with the large number of data sets, maps, and meta-information we developed a spatial database scheme. This scheme was implemented as a spatial database which is directly linked to the GIS and, in turn, supports the spatial analysis processes as well as visualisation of results. Combined with the Internet Map Server (IMS), it allows the interactive dissemination of geodata and maps to scientists and the general public.
Methane in sediments of the North Sea and Baltic Sea
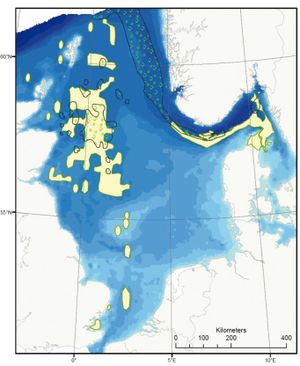
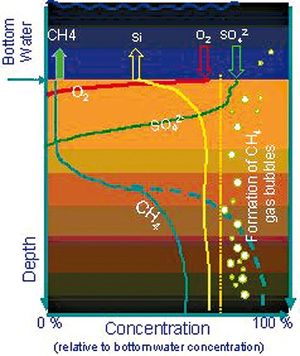
Methane is an important energy resource and greenhouse gas. Due to its relevance we are interested in identifying regions at the seafloor which are characterised by high methane (CH4) concentrations and locations where methane is transferred into the water column or atmosphere (Fig. 3).
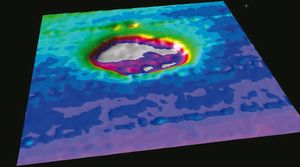
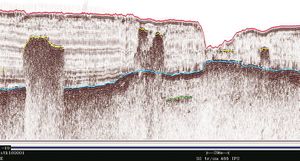
For the data management, visualisation of geodata and spatial analysis we applied a geo-information system. This allows computation of the areas at the sea- floor where high gas concentration in surface sediments is observed (Fig. 6, 7). Furthermore, GIS techniques allow to identify intersections of gas rich surface sediments with pockmark fields or fault zones. This provides information about pathways for fluids or gases. The spatial distribution, size and area of a pockmark field in the Eckernförde Bay were investigated by a survey with an Autonomous Underwater Vehicle (Schlüter et al., 2004[3]). Integration of the survey data and previously measured geochemical data into the geo- information system enabled a characterisation of sediment types within pockmarks as well as the distribution of free gas in the subsurface.
References
- ↑ Jerosch, K., Schlüter, M., Foucher, J.P., Allais, A.G., Klages, M. & Edy, C. (2007). Spatial distribution of benthic communities affecting the methane concentration at Håkon Mosby Mud Volcano. Marine Geology, 243, 1-17. doi:10.1016/j.margeo. 2007.03.010.
- ↑ Schlüter, M., Sauter, E. J., Schäfer, A. & Ritzau, W. (2000). Spatial budget of organic carbon flux to the seafloor of the northern North Atlantic (60°N - 80°N). Global Biogeochemical Cycles, 14 (1), 329- 340.
- ↑ Schlüter, M., Sauter, E. J., Andersen, C. E., Dahlgaard, H. & Dando, P. (2004). Spatial Distribution and Budget for Submarine Groundwater Discharge in Eckernförde Bay (W-Baltic Sea). Limnology and Oceanography, 49 (1), 157-167.
Please note that others may also have edited the contents of this article.
|
Please note that others may also have edited the contents of this article.
|
