Suspended particulate matter distribution in the North Sea
Contents
Introduction
| Suspended particulate matter in the coastal zones
Plumes of turbid water are a quite frequent phenomenon in coastal waters, in particular in shallow soft bottom coasts and at the mouths of rivers and estuaries. Turbidity is caused by all kinds of small particles in the water, some of mineralic composition, such as clay minerals, and others of organic origin. They are summarised under the term suspended particulate matter (SPM). The organic part, the detritus, is composed of decaying fragments of organisms or fecal material. The different particles form flakes of complex and undefined structure. These flakes are substrate for many microorganisms, which colonise the surface and holes in the flakes and which live from decomposing and mineralising the organic material. Due to the organic content, including their microbes, detritus is an important food for many benthic organisms. Furthermore, a number of different organic and inorganic trace substances, which are then transported by suspended matter, are adsorbed to the complex large surface of the flakes. Finally, SPM absorbs and backscatters light and thus reduces the available solar radiance for photosynthesis of phytoplankton and benthic algae and sea grass. |
Knowledge about the distribution of suspended particulate matter (SPM) is an important prerequisite for the description and prediction of the ecological conditions of the North Sea. The SPM concentration in the water column regulates the penetration depth of light and, therefore, it is an important parameter influencing the primary production of plankton. At GKSS a SPM module was developed which describes the exchange processes in the water column, in the sediment, and between the two compartments. These processes are controlled by currents, waves, and bioturbation and by the incorporation via filter and deposit feeders (Pleskachevsky et al., 2002[1], Gayer et al., 2006[2]).
By implementing this module in (operational) hydrodynamical models (e.g. the transport model of the Federal Maritime and Hydrographic Agency (Bundesanstalt für Seeschifffahrt und Hydrographie, BSH), the circulation model of the Danish Meteorological Institute (DMI), and the circulation model HAMSOM of ZMAW, Hamburg), and additionally providing sea state data, the transport and distribution of SPM can be calculated. The success of such a model depends on an adequate parameterisation of physical processes (partly derived in synergy with satellite data), as well as a careful preparation of maps of fine-grained sediment in the bottom and other sources of SPM (e.g. fluvial input and cliff erosion). Although much care was taken to accomplish this, simulations may result in (locally) incorrect SPM distributions, especially during long-term applications. Substantial progress could be made by assimilating surface SPM data derived from satellite.
Methodology & technique
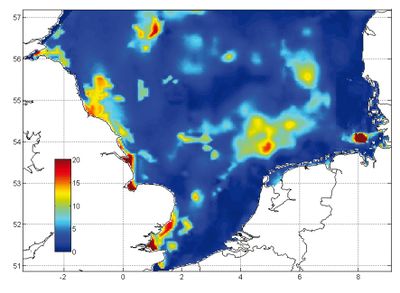
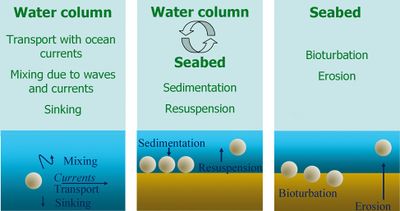
The calculation of SPM concentrations is performed for three representative particle fractions differing in their sinking velocities as well as in their initial distribution in the water column and in the bottom sediment. In addition to horizontal advection, the model takes into account vertical exchange processes due to currents and waves, the latter being an important new aspect. Data derived from satellite images during calm and stormy weather conditions enabled adequate model descriptions of these mixing processes during different conditions. Thresholds of the bottom shear stress velocity determine the beginning of the erosion (fine sediment is removed completely from the bottom sediment down to a certain erosion depth and brought into suspension instantaneously), re-suspension (erosion of the sedimentation layer), and sedimentation (particles sink to the sea floor and build a thin layer) processes (Fig. 1). With the help of SPM surface concentrations, which have been derived from the Modular Optoelectronic Scanner (MOS) satellite, a constant could be adjusted which determines the erosion depth. Processes of uptake and bioturbation in the upper part of the bottom are simulated as well. A distribution map initialises the content of fine sediment in the bottom (Fig. 2). SPM is prescribed at the English Channel boundary because a large amount of the SPM enters the southern North Sea via the Dover Strait. Sea-state dependent cliff erosion is simulated at the English cliffs of Suffolk, Norfolk, and Holderness. SPM contributions of major rivers add to the budget of SPM in the modeled area. To improve the model performance, “surface” SPM concentrations derived from satellite images (e.g. MERIS) can be assimilated during model execution by using an optimum interpolation method. Due to the additionally provided information of the satellite’s “measurement depth”, for the first time it is possible to redistribute the measured SPM concentrations over a certain water depth.
Data Assimilation
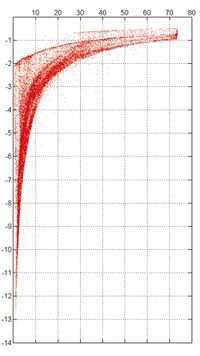
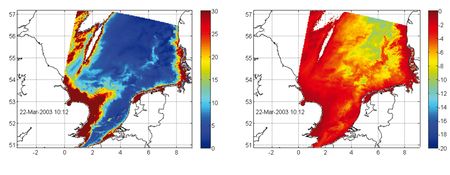
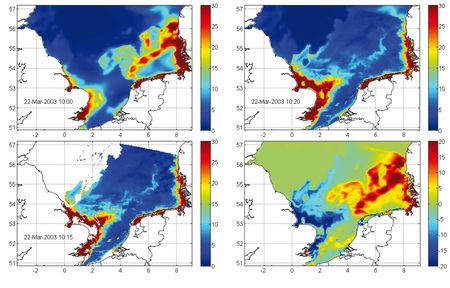
Especially for long-term calculations it may become necessary to update the model with the help of measure- ments, as is done for example during weather forecasts. Although the information retrieved from the optical sensors of satellites may not cover the whole North Sea due to cloud coverage, it is nevertheless regularly available. Actually, missing information can be filled by experience from what the numerical model would have predicted. The problem of how to determine the thickness of the surface layer, over which the “measured” SPM has to be assimilated into the model, can be solved with the additional information of the penetration depth of the satellite signal (how deep did the sensor measure). The higher the SPM concentrations are (which is equivalent to higher turbidity), the lower is the signal penetration depth (Fig. 3). A good example (only a small part of the area is obscured by clouds) is shown in Fig. 4. Clearly visible are coastal areas with high concentrations of about 30 mg/l. Accordingly, the signal depth is about 2 m (right panel). In Fig. 5 it is shown how such satellite data is assimilated into the numerical transport model. The upper left panel shows the model result at a certain time (March 22 nd 2003, 10:00), the upper right panel shows the improved model result 20 minutes later, after the satellite data (lower left panel) was assimilated into the model. The satellite data, even if available, is not accepted everywhere, depending on quality flags (e.g. see white spots near the English coast). Especially near clouds, the measurements are erroneous.
When the new SPM concentration data is assimilated, the modeled profile keeps its shape over the total water depth but is adjusted to the new surface value. To keep the overall balance, a gain or loss of SPM in the water column is compensated by a loss or gain of fine sediment at the bottom. The differences between the model results before and after the data assimilation are shown in the lower right panel Fig. 5.
Several simulations have been performed to find out the temporal and spatial impact of the assimilated data. If the additional mass of SPM, introduced into the model by assimilation, is not compensated by a loss of fine sediment at the bottom, the total budget is increased by a certain percentage. Observing the total mass of SPM (integrated over the whole model domain) over time, it can be shown that it takes more than a week to reach the old value (from just before the assimilation).
Other model runs have shown that assimilation may lead locally to the generation of new patterns of surface SPM. Continuing the simulation, these patterns change their shape and location due to tidal currents. Sinking of particles and mixing processes (due to waves and shear currents) will change the intensities (SPM concentrations). Most likely, these patterns will still exist one week later (in the model as well as in nature), and thus when comparing the model results with the data of an actual satellite scene, this leads to a much better agreement than would have been the case without data assimilation.
Outlook
Two simulations will be performed over a two-year period, one without data assimilation at all, the other with assimilation of all available satellite data. Although the number of scenes with lesser cloud coverage is limited, this will have a major impact on the quality of model simulations.
Related articles
References
- ↑ Pleskachevsky, A., Gayer, G., Horstmann, J. & Rosenthal, W. (2005). Synergy of satellite remote sensing and numerical modelling for monitoring of suspended particulate matter. Ocean Dynamics, 55 (1), 2-9.
- ↑ Gayer, G., Dick, S., Pleskachevsky, A. & Rosenthal, W. (2006). Numerical modeling of suspended matter transport in the North Sea. Ocean Dynamics, 56 (1), 62-77.
Please note that others may also have edited the contents of this article.
|
Please note that others may also have edited the contents of this article.
|
