Nearshore sandbars
It is recommended to read this article in conjunction with the article Shoreface profile.
Contents
Bar description
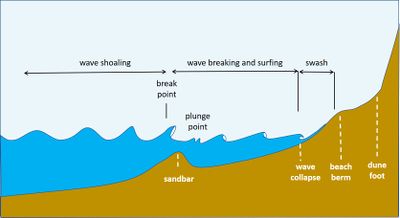
Nearshore sandbars, also called breaker bars, are a common feature of the surf zone of sandy coasts subject to energetic wave action. Their occurrence is related to the shoreface slope, which should be smaller than about 1/30[1]. They are the result of the dynamic interaction between the shape of the coastal profile and the transformation of waves as they propagate onshore; at the same time, they are an important agent in this interaction[2]. Their presence promotes the breaking of waves further away from the shoreline; they thus reduce the wave forces exerted directly on the shore[3]. The cartoon of Fig. 1 shows a typical example of the transformation and breaking of incident waves in the nearshore zone.
Under high-energy wave conditions, nearshore sandbars tend to be straight, with a parallel orientation to the coast, or at a small angle to the shoreline. Sandbars close to the shore can break up into smaller sandbars with crescentic shapes under less energetic wave conditions. This usually occurs in conjunction with the development of a rip cell system, as described in the articles Rip current and Rhythmic shoreline features.
Bar formation
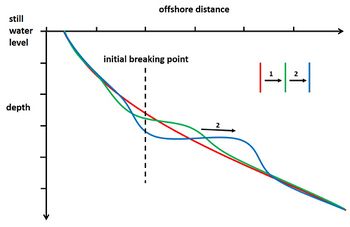
Understanding sandbar dynamics has greatly progressed thanks to the development of the Argus video monitoring system, which allows continuous observation of the presence and migration of sandbars under a wide variety of conditions. Nevertheless, the behavior of sandbars is not yet fully understood and subject of ongoing research. Laboratory experiments[5][6][7] and process-based morphodynamic modeling[8][9][10] show that nearshore sandbars can develop as a result of wave breaking on a non-barred shoreface. Onshore sand transport by incident waves is prevalent before breaking and offshore transport after breaking. Thus, an initial bar is formed by breaker-induced convergence of sediment transport just seaward of the breakpoint and an associated trough at the initial breakpoint. The initial bar will force the breakpoint further down the shoreface and the initial bar will follow until reaching a position where the breaker-induced offshore sand transport is weakened and in equilibrium with wave-induced onshore transport (Fig. 2). This mechanism illustrates that gently sloping shorefaces subject to vigorous wave breaking will usually exhibit a barred profile. Field and laboratory observations show that in the bar crest region the sediment grain size is greater than in the shoreward trough[11]. In the case of a stationary wave climate, the processes that initiate bar formation also contribute to bar growth. Over time, however, they are gradually overruled by other processes that limit bar growth, such as gravity-induced sediment transport down the bar slopes[12]. In situations of less intense wave breaking the bar will not grow high but take the form of a terrace[13][14].
Underlying processes
A variety of physical processes are involved in bar formation. The nonlinear interaction of the shoaling wave with the seabed prior to breaking generates higher velocities and stronger acceleration of onshore wave orbital motion compared to offshore wave orbital motion (so-called 'skewness' of wave orbital velocity and acceleration)[15]. The onshore wave orbital motion strongly accelerates when the wave boundary layer is still thin and so creates a strong bed shear stress that entrains seabed particles[16]. Seabed particles can also be set in onshore motion by the pressure gradient under the steep wave front[17]. These various processes generate net onshore bedload transport in the wave boundary layer[12] (Fig. 3). The skewness of the wave orbital velocity and acceleration is reduced after wave breaking and therefore contributes less to onshore sediment transport in the surf zone on the shoreward side of the breakpoint. Offshore sediment transport on the shoreward side of the breakpoint is mainly due to the undertow current (the net return flow in the water column compensating for the onshore mass transport in the upper part of the water column between wave trough and crest). The undertow induces strong offshore transport as it is loaded with sediment lifted from the seabed by the turbulence produced by wave breaking, especially for plunging breakers[18][19][20]. Seabed stirring and sediment resuspension landward of the breakpoint can be further enhanced by longshore currents induced by obliquely incident breaking waves[21]. Under energetic waves, suspended load transport dominates over bedload transport in the wave breaking zone and in the surf zone, whereas bedload transport dominates in the wave shoaling zone (Fig. 4). A more detailed description of sediment transport processes on the shoreface is given in the article Shoreface profile.
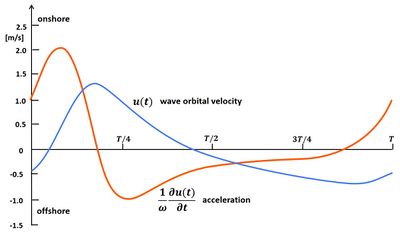 Fig. 3. Onshore-offshore asymmetry of the wave orbital velocity and acceleration in the shoaling zone. The acceleration of offshore to onshore wave orbital velocities is substantially larger than the acceleration in the opposite direction (sometimes called positive acceleration skewness or asymmetry). The maximum onshore orbital velocity in the wave crest phase is also substantially larger than the maximum offshore orbital velocity in the wave trough phase (sometimes called positive velocity skewness). In most cases this will induce net onshore sand transport, although in some cases the opposite may also happen (see Sediment transport formulas for the coastal environment). |
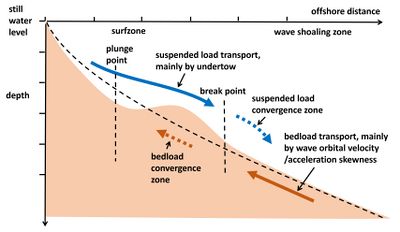 Fig. 4. Schematic of the major bar-building sediment transport processes. Adapted after [4]. |
Bar migration
Nearshore sandbars are not static features but move in onshore or offshore direction depending on the wave climate. Ruessink and Terwindt, 2000[24]) found that on the Dutch coast bars migrate offshore under energetic waves (storm periods), while under mild waves (long-period waves, swell, non-breaking onshore propagating surf bores) the migration direction is onshore. This study also showed that offshore migration dominates when [math]\Gamma \equiv (H_s/h)_{crest}[/math] (ratio of significant wave height [math]H_s[/math] to water-depth-above-barcrest [math]h[/math]) is larger than a critical value [math]\Gamma_c[/math] (about 0.6 for the Dutch coast) and onshore migration when [math]\Gamma[/math] is smaller than 0.3.
When wave heights increase after a long period of lower waves, the corresponding increase of the ratio [math]\Gamma[/math] will be offset by an offshore shift of the sandbar location to deeper water. Conversely, decreasing wave heights will shift the bar location onshore to shallower water. Sandbar migration in the non‐ to slightly‐breaking regime is always directed onshore, which eventually gives rise to a beach state without submerged sandbars. The existence of this feedback mechanism that forces nearshore bars to an equilibrium location depending on wave forcing is supported by observational evidence[25]. However, because the response time of cross‐shore bar motion is generally longer than the timescale of variability in the wave climate, sandbars hardly ever reach their equilibrium location. As such, sandbars spend most of their lifetime out‐of‐equilibrium with the wave forcing[26]. In situations where the bar has moved offshore to deeper water under energetic wave conditions, a subsequent period of low waves may not result in shoreward return of the bar, due to the absence of breaking wave conditions at this offshore location. In this case, the offshore bar will decay.
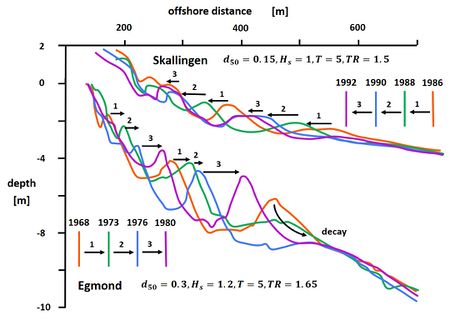
During storm periods, large offshore bar displacements can occur in a short time. Landward bar migration is much slower; long periods of onshore motion are required to offset the seaward migration of a single high-wave period[27]. Most observations indicate a long-term net offshore migration[28]. However, there are also coasts where nearshore bars migrate in a landward direction[22] (Fig. 5). This seems to be a feature of highly dissipative coasts, i.e., coasts with a fine-sandy gently sloping shoreface, where waves are breaking gradually without developing strong undertow currents[29]. Onshore bar migration generally occurs during long periods of swell-dominated conditions. In some cases the bar eventually welds to the shoreline, leaving a non-barred shoreface[30]. The process of onshore bar migration is often associated with the formation of bar-rip systems with a longshore rhythmic variation. This is described more in detail in the article Rhythmic shoreline features, where it is shown that longshore sand transport processes also play an important role in the generation and evolution of nearshore sandbars.
In situations where the net bar migration is directed offshore, the bar eventually decays when the water depth above the crest becomes too large to induce frequent wave breaking and associated convergence of sand transport[31][32]. When this outer bar decays, energetic incident waves reach more easily the intertidal beach and are capable of removing sand for the generation of a new bar that subsequently starts moving offshore. However, at some coasts, observations show the generation of an outer bar offshore at the location where energetic incident waves start breaking on the shoreface[25][22].
Offshore sandbar migration implies accretion at the outer (seaward) bar flank and erosion of the inner side. This does not necessarily proceed through sand transfer from the inner to the outer bar flank; the outer bar flank can accrete with sand imported from offshore. Offshore sandbar migration is thus not synonymous with sand loss to deeper water.
Research to capture all the relevant physical processes for bar migration in numerical models is still ongoing. The physical hydrodynamic and sediment transport processes are best represented in 3D-models that resolve wave dynamics on the intra-wave time scale. These models can reproduce the effects of nonlinear wave dynamics such as skewness of wave orbital velocity and acceleration, near-bed boundary layer streaming and Stokes drift, and near-bed sediment transport induced by breaking waves[9][33]. However, for simulating cycles of onshore-offshore bar migration, these models are computationally very demanding and not (yet) feasible in practice. Wave phase-averaged models are therefore used instead. However, these models rely on semi-empirical parameterizations for representing the effect of nonlinear intra-wave dynamics. In some models, the effect of skewness of wave orbital velocity and acceleration on bar migration is incorporated by using the bedload sediment transport formula of Dibajnia and Watanabe (see Sediment transport formulas for the coastal environment Eq. (17))[34]. Application of wave-averaged models in practice requires tuning of the various model parameters to observations at the same of a similar location[35].
Multiple bar system
Dissipative coasts with a wide surf zone usually have several (often 3 or 4) more or less parallel bars. The shoreface bathymetry of the Dutch coast at Katwijk is shown as an example in Fig. 6. When energetic waves break at a location relatively far offshore, waves can re-form after breaking and break a second time or even a third or fourth time before collapsing on the beach. These multiple breakpoints may give rise to a multiple bar system. Rozynski and Lin (2015[36]) described the nearshore bar system at the micro-tidal Baltic coast of Poland as follows: (1) when waves are mild, the surf zone is narrow, and they break only over the innermost bar; (2) higher waves begin to break over the second bar, the surf zone now includes two bars, and the breakers can include spilling or plunging modes or both; (3) during heavy storms, the outer bars contribute to wave-energy dissipation as well – the surf zone now includes four or more bars and is several hundred meters wide; various combinations of spilling and plunging modes are then possible, resulting in very complicated alongshore and cross-shore driven sediment patterns; (4) variations in wave set-up and wind-driven storm surges (in a range of 1 m) further modify the breaking regimes during the build-up, peak and recession of storms.
The dynamics of multiple bar systems is not fully understood, although some qualitative features are reproduced by semi-empirical models[37]. It has been suggested that Bragg scattering – the resonant reflection of low-frequent waves (infragravity waves) in a multiple bar system – plays a role in their formation[38]. Multiple bars can arise from various other mechanisms, such as sand bar splitting (which has been observed during low-energy conditions, several weeks after the incidence of high-energy waves[39]) and distinct wave breakpoints at high water and low water on the shoreface of tidal coasts. There is only limited sand exchange between multiple bars because of small sand transport capacity in the troughs between the bars[29].
An often-observed particularity of many nearshore bar systems is the orientation with respect to the shoreline. In many cases the bars make a small angle of 2-4 degrees, their distal end at the outer edge of the nearshore region pointing in the direction of the littoral drift[28]. When the distal part decays offshore, the most inner part separates from the shoreline and starts moving offshore. More generally, the behaviour and alongshore variability of inner bars and the shoreline is influenced by wave breaking patterns on the outer bars[40] and by the tide range[41].
While multiple bar systems are typical for wide dissipative high-energy beaches, there are situations where nearshore bars are absent from such beaches. For example, no bars were present in the nearshore zone of the coastal stretch between The Hague and Rotterdam (Netherlands). The groyne field along this coastal stretch was suggested as a possible reason, because a nearshore bar developed spontaneously after the groyne field was covered by a beach nourishment[42].
Related articles
- Shoreface profile
- Parametric equilibrium models
- Closure depth
- Rhythmic shoreline features
- Rip current
References
- ↑ Davidson-Arnott, R. 2022. Nearshore Bars. Treatise on Geomorphology, 2nd edition, Volume 8, Ch. 10. Elsevier
- ↑ Wright, L.D. and Short, A.D. 1984. Morphodynamic variability of surf zones and beaches – a synthesis. Mar. Geol. 56: 93–118
- ↑ Quartel, S., Kroon, A. and Ruessink, B.G. 2008. Seasonal accretion and erosion patterns of a microtidal sandy beach. Mar. Geol. 250: 19–33
- ↑ 4.0 4.1 García-Maribona, J., Lara, J.L., Maza, M. and Losada, I.J. 2022. Analysis of the mechanics of breaker bar generation in cross-shore beach profiles based on numerical modelling. Coastal Engineering 177, 104172
- ↑ Roelvink, D. and Stive, M.J.F., 1989. Bar-generating cross-shore flow mechanisms on a beach. J. of Geophys. Res. Oceans 94: 4785–4800
- ↑ Baldock, T.E., Alsina, J.A., Caceres, I., Vicinanza, D., Contestabile, P., Power, H. and Sanchez-Arcilla, A. 2011. Large-scale experiments on beach profile evolution and surf and swash zone sediment transport induced by long waves, wave groups and random waves. Coast. Eng. 58: 214–2
- ↑ Eichentopf, S., Van der Zanden, J., Cacere, I. and Alsina, J.M. 2019. Beach profile evolution towards equilibrium from varying initial morphologies. J. Mar. Sci. Eng. 7: 406
- ↑ Dally, W.R. and Dean, R.G. 1984. Suspended sediment transport and beach profile evolution. J. Waterw. Port Coast. Ocean Eng. ASCE 110: 15–33
- ↑ 9.0 9.1 Jacobsen, N.G., Fredsoe, J. and Jensen, J.H. 2014. Formation and development of a breaker bar under regular waves. Part 1: Model description and hydrodynamics. Coastal Eng. 88: 182-193
- ↑ Li, Y., Zhang, C., Chen, D., Zheng, J., SunJ. and Wang, P. 2021. Barred beach profile equilibrium investigated with a process-based numerical model. Continental Shelf Research 222: 104432
- ↑ van der Zanden, J., van der A, D.A., Hurther, D., Caceres, I., O'Donoghue and Ribberink, J.S. 2017. Bedload and suspended load contributions to breaker bar morphodynamics. Coastal Engineering 125: 51–69
- ↑ 12.0 12.1 van der Zanden, J., van der A, D.A., Hurther, D., Caceres, I., O'Donoghue, T., Hulscher, S.J.M.H. and Ribberink, J.S. 2017. Bedload and suspended load contributions to breaker bar morphodynamics. Coastal Engineering 129: 74–92 Cite error: Invalid
<ref>tag; name "ZA" defined multiple times with different content - ↑ Wright, L. D., Short, A. D. and Green, M. O. 1985. Short-term changes in the morphodynamic states of beaches and surf zones: An empirical predictive model Mar. Geol. 62: 339–364
- ↑ Scott, T., Masselink, G. and Russell, P. 2011. Morphodynamic characteristics and classification of beaches in England and Wales. Marine Geology 286: 1–20
- ↑ Elgar, S., Gallagher, E.L. and Guza, R.T. 2001. Nearshore sandbar migration. J. Geophys. Res. 106 (C6), 11623
- ↑ Nielsen, P., 1992. Coastal Bottom Boundary Layers and Sediment Transport. World Scientific, Singapore
- ↑ Foster, D. L., Bowen, A.J., Holman, R.A. and Natoo, P. 2006. Field evidence of pressure gradient induced incipient motion. J. Geophys. Res. 111: C05004
- ↑ Zhang, D.P. and Sunamura, T. 1994. Multiple bar formation by breaker-induced vortices: a laboratory approach. In: Proc. Intern. Conf. Coast. Eng., pp. 2856–2870
- ↑ Thornton, E. B., Humiston, R. T. and Birkemeier, W. 1996. Bar/trough generation on a natural beach. J. Geophys. Res. 101: 12,097–12,110
- ↑ Gallagher, E.L., Elgar, S.and Guza, R.T. 1998. Observations of sand bar evolution on a natural beach. J. Geophys. Res.: Oceans 103 (C2): 3203–3215
- ↑ Walstra, D. J. R., Reniers, A. J. H. M., Ranasinghe, R., Roelvink, J. A. and Ruessink, B. G. 2012. On bar growth and decay during interannual net offshore migration. Coastal Eng. 60: 190–200
- ↑ 22.0 22.1 22.2 Aagaard, T., Davidson-Arnott, R., Greenwood, B. and Nielsen, J. 2004. Sediment supply from shoreface to dunes: linking sediment transport measurements and long-term morphological evolution. Geomorphology 60: 205–224
- ↑ Van Rijn, L.C., Ruessink, B.G. and Mulder, J.P.M. 2002. Summary of project results. In: Coast3D-Egmond, The behaviour of a straight sandy coast on the time scale of storms and seasons. ISBN 90-800356-5-3-, Aqua Publ. Amsterdam
- ↑ Ruessink, B.G. and Terwindt, J.H.J. 2000. The behaviour of nearshore bars on the time scale of years: A conceptual model. Mar. Geol. 163: 289–302
- ↑ 25.0 25.1 Plant, N.G., Freilich, M.H. and Holman, R.A. 2001. Role of morphodynamic feedback in surf zone sandbar response. J. Geophys. Re. 106: 973-989
- ↑ Pape, L., Plant, N.G. and Ruessink, B.G. 2010. On cross-shore migration and equilibrium states of nearshore sandbars. J. Geophys. Res. 115, F03008
- ↑ Wijnberg, K.M. and Kroon, A. 2002. Barred beaches. Geomorphology 48: 103–120
- ↑ 28.0 28.1 Aleman, N., Certain, R., Robin, N. and Barusseau, J-P. 2017. Morphodynamics of slightly oblique nearshore bars and their relationship with the cycle of net offshore migration. Marine Geology 392: 41–52
- ↑ 29.0 29.1 Aagaard, T., Greenwood, B. and Hughes, M. 2013. Sand transport on dissipative, intermediate and reflective beaches. Earth Sci. Rev. 124: 32–50
- ↑ Shepard, F.P. 1950. Beach cycles in southern California. In: Beach Erosion Board (Technical Memo 20). US Army Corps of Engineering, Washington DC.
- ↑ Birkemeier, W.A. 1984. Time scales of nearshore profile changes. In: 19th International Conference on Coastal Engineering. American Society of Civil Engineers, New York, pp. 1507-1521
- ↑ Ruessink, B.G. and Kroon, A. 1994. The behaviour of a multiple bar system in the nearshore zone of Terschelling, The Netherlands. Marine Geology 121: 187–197
- ↑ Marchesiello, P., Chauchat, J., Shafiei, H., Almar, R., Benshila, R., Dumas, F. and Debreu, L. 2022. 3D wave-resolving simulation of sandbar migration. Ocean Modelling 180, 102127
- ↑ Shafiei, H., Chauchat, J., Bonamy, C. and Marchesiello, M. 2023. Adaptation of the SANTOSS transport formula for 3D nearshore models: Application to cross-shore sandbar migration. Ocean Modelling 181, 102138
- ↑ Dubarbier, B., Castelle, B., Marieu, V. and Ruessink, R. 2015. Process-based modeling of cross-shore sandbar behavior. Coastal Engineering 95, 35–50
- ↑ Rozynski, G. and Lin, J-G. 2015. Data-Driven and Theoretical Beach Equilibrium Profiles: Implications and Consequences. Journal of Waterway, Port, Coastal and Ocean Engineering 141(5): 04015002
- ↑ Splinter, K.D., Gonzalez, M.V.G., Oltman-Shay, J., Rutten, J. and Holman, R. 2018. Observations and modelling of shoreline and multiple sandbar behaviour on a high-energy meso-tidal beach. Continental Shelf Research 159: 33-45
- ↑ Elgar, S., Raubenheimer, B. and Herbers, T.H.C. 2003. Bragg reflection of ocean waves from sandbars. Geophysical Research Letters 30, 1016, doi:10.1029/2002GL016351, 2003
- ↑ Vidal-Ruiz, J.A. and Ruiz de Alegria-Arzaburu, A. 2020. Modes of onshore sandbar migration at a single-barred and swell-dominated beach. Marine Geology 426, 106222
- ↑ Ruessink, B.G., Pape, L. and Turner, I.L. 2009. Daily to interannual cross-shore sandbar migration: observations from a multiple sandbar system. Cont. Shelf Res. 29: 1663–1677
- ↑ Almar, R., Castelle, B., Ruessink, B.G., Senechal, N., Bonneton, P. and Marieu, V. 2010. Two- and three-dimensional double-sandbar system behaviour under intense wave forcing and a meso-macro tidal range. Cont. Shelf Res. 30: 781–792
- ↑ Radermacher, M., de Schipper, M.A., Price, T.D., Huisman, B.J.A., Aarninkhof, S.G.J. and Reniers, A.J.H.M. 2018. Behaviour of subtidal sandbars in response to nourishments. Geomorphology 313: 1–12
Please note that others may also have edited the contents of this article.
|
