Supply chain analysis
Supply chain analysis consists in a quantitative analysis of inputs and outputs between firms, prices and value added along a supply chain through agent accounts. These inputs and outputs can be expressed in physical flows of material and services needed to manufacture a final product as well as in their monetary equivalents.
Contents
Introduction

The term Supply Chain analysis is used to refer to the overall group of economic agents (a physical person such as a farmer, a trader or a consumer, as well as legal entities such as a business, an authority or a development organisation) that contribute directly to the determination of a final product. Thus the chain encompasses the complete sequence of operations which, starting from the raw material, or an intermediate product, finishes downstream, after several stages of transformation or increases in value, at one or several final products at the level of the consumer (FAO, 2005a [1]).
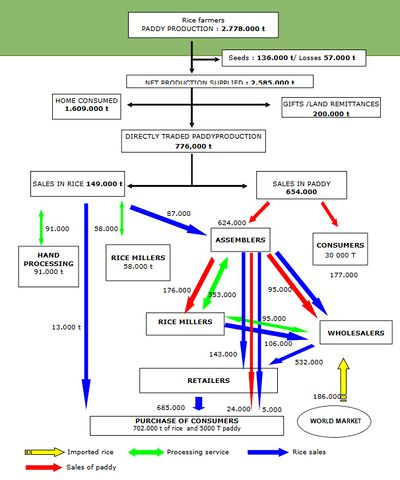
Building a supply chain analysis requires to spend time in the followings tasks (see example figure 1):
- Mapping the chain (through a flowchart) to obtain an overview of the chain, the product flows, the position of the chain actors and type of interaction between the actors.
- Developing the economic accounts corresponding to the activities of the agents involved in the chain. This consists in quantifying the activities observed and their flow of material both in physical and in monetary terms. This allows the analyst to assess the relative importance of the different segments or sub-chains of the chain, which in turn will allow an appropriate use of time and resources. For more details on how building economic accounts, read FAO (2013) [2].
Practical use of supply chain analysis
Supply chain analysis is a tool that allows us to assess the impact of an environmental policy through a simple Excel table with data on complete financial accounts of the various agents along the length of the chain. Then the impact of an environmental policy option on financial accounts and material flow of economic agents targeted by this policy is entered in the Excel table. This will automatically induce a change in the financial account of all other agents connected to him and directly or indirectly depending on his production to ensure their own production. Supply chain analysis offers an economic simulation model, not a model of optimization. This method can be used for assessment of policies targeting a whole sector, a sub-sector or a branch of economic activities (e.g. dairy quota limiting milk production, taxes on chemical nitrogen fertilizers) or for macroeconomic policies (e.g. aiming at unemployment decrease, inflation stabilization, keeping the balance of payment in equilibrium, achieving a higher economic growth…).
In that sense, supply chain analysis is relevant for the same cases as computable general equilibrium, input-output matrix and accounts environmentally adjusted, since this methodology is able to capture the impact of a policy scenario that cover a great number of economic activities (at least one sector, a sub-sector or a branch but not few economic agents).
It could also be used at lower economic level (a small number of economic agents) but in that case, national and regional data would be too aggregated and more detailed and disaggregated data should be found by surveys on field.
Limits of the method
- Capture fewer indirect impacts on other sectors than I-O. Indeed, supply Chain analysis is in a sense, quite similar to I-O analysis but deals with fewer sectors (only those linked to the analyzed product for which a supply chain is mapped) while I-O table deals with most of economic sectors (available in national or regional statistical offices).
- Supply chain analysis cover fewer sectors but goes more into details concerning data (on material flows between agents). However, this high level of details achievement is time consuming since most data are not published and require visiting national statistic offices, official institutions, and enterprises for collecting data.
Several limits are the same as for I-O analysis :
- The static aspects making difficult any projection possibilities
- Dependence on availability of regional data or data at watershed level (or any other environmental unit of the territory). When not available, need to go to industrial federations etc. for data collecting.
Other regional economic accounting methods
See also
- Multifunctionality and Valuation in coastal zones: concepts, approaches, tools and case studies
- Multifunctionality and Valuation in coastal zones: introduction
References
- ↑ 1.0 1.1 FAO (Food and Agriculture Organization of the United Nations) 2006. Commodity Chain Analysis. Constructing the Commodity Chain Functional Analysis and Flow Charts. EASYPol, On-line resource materials for policy marking, Module 043. Available on Internet : http://www.fao.org/docs/up/easypol/330/value_chain_analysis_functional_analysis_flows_charts_043en.pdf
- ↑ Bellu, L.G. 2013. Value Chain Analysis for Policy Making Methodological Guidelines and country cases for a Quantitative Approach. FAO EASYPol Series 129. http://www.fao.org/3/a-at511e.pdf. The EASYPol is available at: www.fao.org/easypol
Please note that others may also have edited the contents of this article.
|
