Use of X-band and HF radar in marine hydrography
This article explains the basics of remote sensing by ground based radar in hydrography. Examples are given of measurements by microwave (X-band) and High Frequency (HF) radar techniques.
Contents
Introduction
Radar remote sensing in Earth observation does not only cover the global and regional survey of geophysical parameters by satellite- or airborne radars, it also includes local observations by ground-based radar techniques. Due to their continuous measurement capabilities, the information provided by ground-based instruments installed at the coast or on offshore platforms does not suffer from the episodic character of the satellite- or airborne radar observations. The same holds for marine radars on board of ships. In contrast to the satellite systems, the incident angle of ground-based radars is only a few degrees and near to zero (grazing) at far ranges. In this case, the working range of the radar strongly depends on the operating frequency. In this article we distinguish between:
- Microwave radars, also called X-band radars, which are limited by line-of-sight propagation to the horizon. Due to the large available bandwidth in the microwave frequency range, the spatial resolution can be as fine as 5 m at 5 km working range. By installing a X-band radar on-board a ship, the observation area can be extended along the ship track to a regional scale.
- Decameter wave radars, also known as High Frequency (HF) radars, make use of ground wave propagation far beyond the horizon. HF radars provide about 1.5 km at up to 200 km working range.
The development of HF radars in hydrography started in 1955, when Crombie[1] discovered that electromagnetic waves in the HF band were interacting with the ocean surface due to Bragg resonant scattering. The first radar for mapping of ocean surface currents was described by Barrick et al. (1977[2]). Stewart and Joy (1974[3]) observed that there are often small frequency differences between the observed Doppler shift of the backscattered radio waves and the Doppler shift predicted from surface gravity waves moving over still water. They showed that the observed differences resulted from near-surface ocean currents and that current speeds toward or away from the radars could be estimated.
Marine microwave radar images were first used by Ijima et al. (1964[4]) and Wright (1965[5]) for imaging ocean waves. Ziemer et al. (1983[6]) showed that Fourier analysis of digitized radar images provided spectra similar to those obtained from wave buoys, from which the directional wave spectrum can be derived.
A comprehensive overview on the use of radar in general and in its use in geophysics is given by Skolnik, (1990[7]).
Principles of ground-based radar
X-band radar
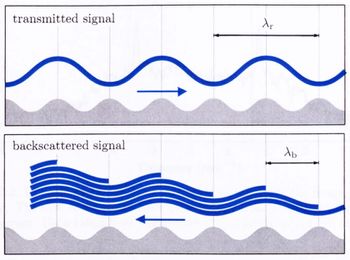
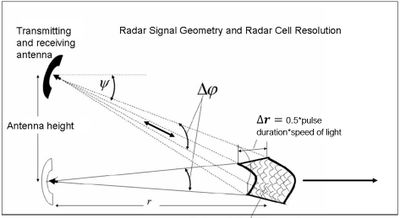
In general, radar remote sensing of the sea surface provides a broad variety of observations, which have been discussed intensively over the past decades. While single radar images give the intensity distribution of the backscattered radar power attained from a kind of instantaneously frozen surface, the surface dynamic can be observed by tracking features in subsequent radar measurements. The scattering mechanism is known as "Braggscatter" and interprets the back-scattered (reflected) signal induced by constructive interference of the electromagnetic radar wave with the sea surface of the radar footprint (see Fig. 1). X-band radars operate in the frequency band 8-12.5 GHz (wavelength 2.5-4 cm). The emitted radar signal is backscattered by sea surface ripples formed by wind-generated capillary waves, which are riding on and modulated by surface gravity waves and currents. The interaction of the sea surface with the spatially and temporally varying emitted radar signal therefore provides information on wind, waves, currents and the hydrosphere. This information can be retrieved by analyzing the modulation of intensity and frequency (Doppler shifts) of the back-scattered radar signal. Measurement principles of X-band radar are further explained in the article Waves and currents by X-band radar.
By acquiring radar intensity or radar Doppler shift, an image of the related processes may be composed on a regional to local scale. By knowing the physics behind these modulations, the steering hydrodynamic processes may be assessed. This means determining and interpreting the energy density spectrum [math]E[/math] of the backscattered signal as a function of the wave frequencies [math]\omega[/math] and the wave vector components [math]k_x, k_y[/math]. In this section we will focus on the use of ground based X-band radar as tool for hydrographic observations. In coastal management the regional and local survey by ground based radar provides a valuable addition to the in situ observations. Information on local wind, wave and current conditions as well as indirect parameters such as the local bathymetry, and even the coverage by ice, spills or slicks may be deduced routinely from radar products.
Although the microwave signal does not enter into the water, as almost 100% are reflected or scattered directly at the surface, it is possible to deduce additional information on the hydrodynamic from below the surface. For example, the propagation of waves in shallow water allows deducing the local water depths from the local wave propagation. Based on this relation it is possible to compose maps of the water depth (bathymetry), which can be used in monitoring the sand transport (see also section with "application and examples"). Another example is the extrapolation of surface features down to the seabed in the operational model by Vogelzang et al. (1997[9]).
Acquisition of radar backscatter
The radar signal intensity that is detected at the receiving antenna is called radar backscatter. The amplitude and phase of the backscatter are instantaneously and locally modulated in time and space by hydrodynamic effects. The most important influence to the radar backscatter of an ocean surface element is the mean amplitude of the surface roughness, which is instantaneously steered by the local wind impact. The radars under discussion here are operated synchronously with a precise navigation track record to compose the backscatter values into a geo-coded radar map. While a radar pulse sweeps along a radial line, the received radar backscatter is decomposed into a series of radial bins. The radar return is allocated to corresponding scattering surface elements by measuring the microwave runtime and the antenna azimuth. The focusing in azimuth depends on the length of the antenna and in range on the duration of the transmitted radar signal (see Fig. 2). Typical values for the range resolution are 5 m x 5 m or 10 m x 10 m and for the antenna opening angle about 1°. Whereas the return of each individual radial beam is acquired during nanoseconds the acquisition of the total image takes some seconds or even minutes depending on the acquisition mode. The image composition under the use of a rotating antenna takes about 2 seconds and the product is a matrix in polar coordinates (range and azimuth).
Acquisition of radar Doppler shift
For the detection of Doppler shifts incurred to the microwave signal by the motion of the surface elements an acquisition time of at least some 100 milliseconds is necessary. During that time the antenna must be kept directed towards the individual surface elements. The longer the Doppler frequency information is integrated the greater increases its significance. As the frequency shift is sensitive to instantaneous local wind friction, the knowledge on the wind impact is crucial. An application of the Doppler measurements is demonstrated in the section "application and examples".
High Frequency (HF) radar
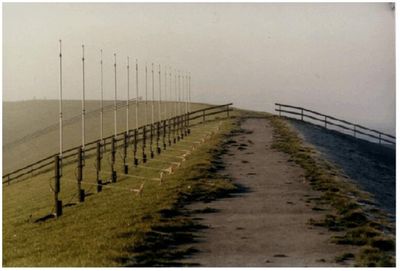
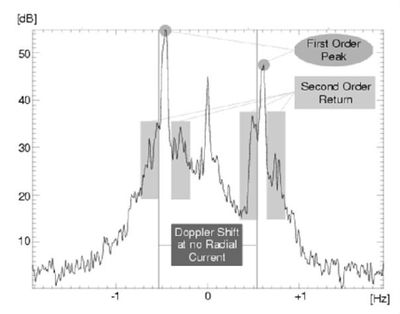
HF radars are operated in the 3-30 MHz frequency range, where the electromagnetic waves can travel far beyond the horizon by ground wave propagation along a good conducting layer (salty ocean water) or due to reflections by the ionoshpere (sky wave propagation). HF radars probe by Bragg scattering surface waves of relatively short length (a few tens of meters) which are travelling in the ocean as deep-water gravity waves. Ground wave radar systems are installed at the coast close to the water to ensure a good coupling to the ocean and achieve working ranges up to 200 nautical miles, while sky wave radars are normally installed far off the coast, e.g. the JINDALEE radar in the centre of Australia, and may reach thousands of nautical miles range. Only a few sky wave systems exist worldwide, and in most cases are not used for oceanographic applications. The University of Hamburg developed a ground wave HF radar for coastal applications called WEllen RAdar (WERA), Gurgel et al. (1999[10]). Fig. 3 shows a typical example of an antenna installation set up for a WERA radar. A typical backscatter spectrum from a selected patch of the ocean at a given range and angle is shown in Fig. 4: Two strong first-order Bragg peaks can be identified, which are generated by a resonant backscattering of the electromagnetic wave due to ocean waves of half the electromagnetic wavelength, e.g. 20 m long electromagnetic waves are scattered back by 10 m long ocean waves.
The angular frequency [math]\omega[/math] and the wave vector [math]\vec{k}[/math] (with components [math]k_x, k_y[/math]) of the resonant ocean gravity waves obey the dispersion relationship
[math]\omega = \vec{k}.\vec{u}+\sqrt{gk \tanh(kd)} , \qquad (1)[/math]
where [math]g[/math] is the acceleration due to gravity, [math]k=|\vec{k}|=2 \pi/ \lambda[/math] is the wave number, [math]\lambda[/math] is the wavelength and [math]d[/math] is the water depth. The shallow water term, [math]\tanh(kd)[/math] , approximates to 1 and can be neglected if the water depth is larger than the ocean wave length. This implies that the water depth can only be derived from the wave characteristics [math]\omega, k_x, k_y[/math] in shallow water, where [math]kd[/math] is of order 1 or smaller.
As there are ocean waves travelling towards and away from the radar, two strong first-order Bragg peaks can be observed. By changing the radar operating frequency, a specific ocean wavelength can be selected. Even in that case the backscatter signal consists of a spectrum because of the complex shape of the sea surface. Therefore second-order side bands can be observed around the two first-order peaks, which contain information on the ocean wave directional spectrum, see Fig. 4.
Applications and examples of X-band radar
This section describes two applications of X-band radar. The first application is bathymetric survey and current field observation using local gravity wave dispersion. The second application is mapping of sea-surface currents by Radar Doppler Current Profiler. A paragraph has been added with a few recent applications of X-band radar for bathymetry retrieval. Other applications are described in the articles Waves and currents by X-band radar and Bathymetry German Bight from X-band radar.
Bathymetric survey and current field observation
This microwave radar technique is based on local gravity wave dispersion.
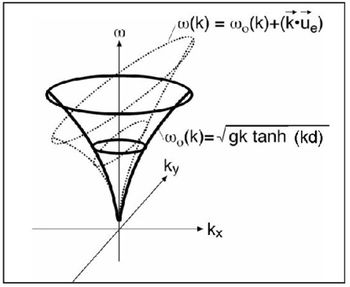 Figure 5: Gravity wave-dispersion shell in the wave vector-frequency domain [math]k_x, k_y, \omega[/math]. The isotropic shell (thick line) represents the dispersion as a function of the local water depth [math]d[/math]. The distorted shell (dashed line) represents the dispersion in the presence of a non-zero onshore current [math]\vec{u_e}[/math]. |
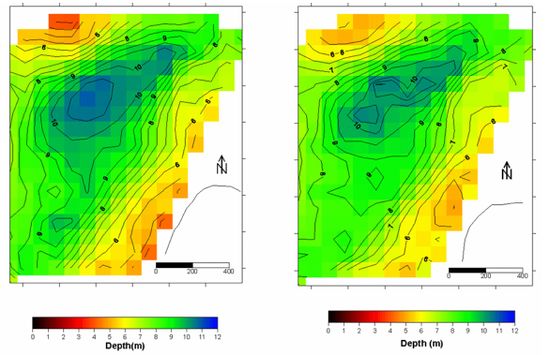 Figure 6: Bathymetries of List West (north end of the Island Sylt in the German bight) derived by DiSC for February 20 (left) and February 28 (right). The size of the grid mesh is 42 m. Each result is averaged over a full tidal cycle. In between the two measurements a storm took place that causes an import of 50,000 m3 sand into the area. Image from Flampouris 2006[11]. |
Special challenge in coastal protection management is provided by the management of sandy coastlines. Here humans interact with the dynamic processes of the ocean and undertake measures for stabilization of the shoreline such as beach nourishment. The supply of sand to the coastal system requires monitoring of the sand’s residence as well as monitoring processes of erosion, transport and deposition. For this it is not enough to survey physical parameters at single observation points. It requires area covering observations to identify the response of the system and the processes involved. In the following, radar hydrographic methods for area mapping and continuous survey of the bathymetry and relevant physical processes are discussed. The area of investigation is List West at the north end of the Island Sylt in the German bight.
Currents can be retrieved from time series of X-band radar images if it is assumed that the linear wave theory is valid and the surface wave dispersion relation (Eq. 1) holds. The inversion algorithm used for this purpose is known as “Dispersive Surface Classificator” (DiSC). The method has been developed at the Radar Hydrography Department of GKSS and is licensed as commercial product by Vision 2 Technology GmbH, partner of the Geesthachter Innovations- und Technologie-Zentrum (GITZ). The method is based on the linear wave theory that allows, by tracking wave crests in space and time, the determination of the parameters water depth and current vector. A detailed description of the method of is given in Senet et al. (2001[12]). The analysis of the image sequences of the inhomogeneous wave field provides a set of physical parameters on a local scale. The basic idea of the method is that, in shallow waters, the waves vary their propagation (phase speed and wave number) locally and thus impress the local bathymetry into the image series. The same mechanism acts via the local current that may be assessed by the DiSC as well.
The water depth and the current vector are free parameters influencing the shape of the dispersion shell in the wave-number frequency domain (see Fig. 5). An important characteristic of this application is that the radar needs no calibration, as the wave height is not influencing the wave dispersion. From the radar observation the 3D power spectra in frequency-wavenumber domain [math]\omega, k_x, k_y[/math] is calculated by Fourier Transformation. Next the shape of the actual effective dispersion is deduced by fitting the spectra to a plane approximating the dispersion relation. Deviations from the undisturbed (no current) dispersion relation provide information on the local water depth and current vector (Senet et al. 2007[13]). The full set of local results is compiled in spatial hydrographic-parameter maps, see Fig. 6.
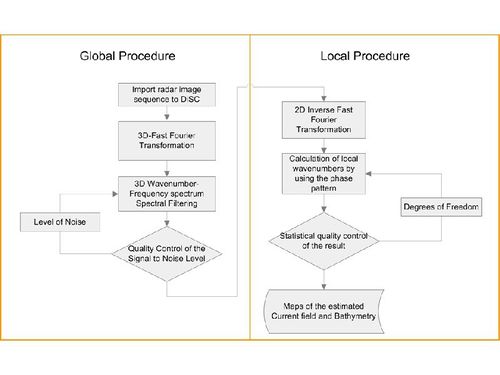
The method is illustrated in Fig. 7 and the main steps of analysis are the following:
- elaboration of the complex-valued 3D FFT image spectrum,
- filtering techniques of the complex spectrum to separate the wave signal from noise,
- directional and dispersion separation of the complex-valued spectrum into spectral bins at 2D wavenumber planes of constant frequency,
- 2D inverse Fast Fourier Transformation(2D FFT-1) of the spectral bins, yielding complex-valued, one-component spatial maps in the spatio-frequency domain,
- calculation of spatial maps of local wavenumbers from the one-component images of constant frequency,
- composition of the one-component local wavenumber maps of constant frequency to local 3D spectra and
- calculation of spatial hydrographic-parameter maps from the local 3Dspectra.
The result of the DiSC is the instantaneous local depth, the bathymetry, and an estimation of the current field. Fig. 6 illustrates the bathymetries averaged over a tidal cycle each before and after a storm (wind conditions 8-9 Bft.). The two maps have common reference, corrected by gauge measurements. The difference of the sediment volume between the beginning and end of the storm, which under the conditions could be considered as the sediment net increase of the area of investigation, is estimated in 50.000m3, with ±10% of accuracy for each grid cell, under the assertion that the accuracy of the method is higher than 90% per cell as given in Flampouris et al. (2007[14]).
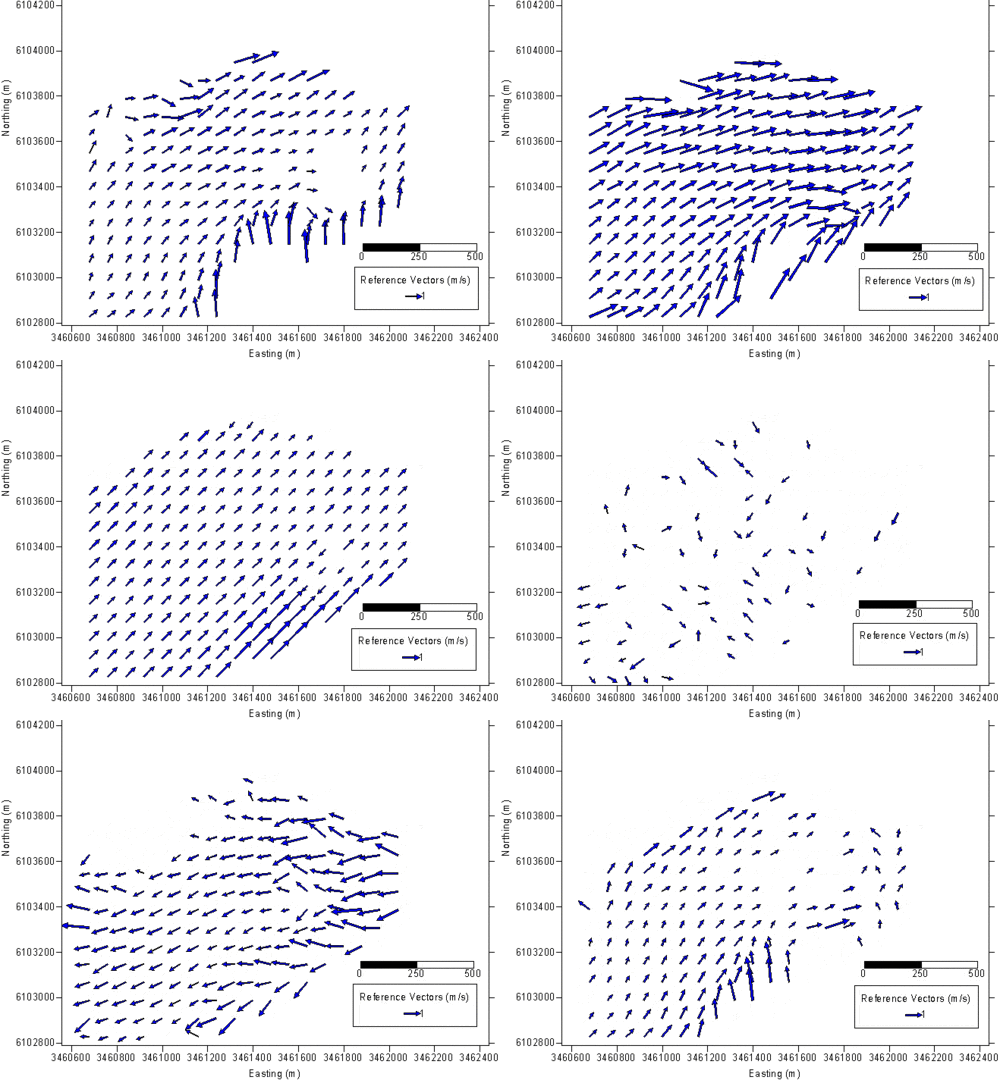
Fig. 8 illustrates an example of the current field in the same area as above. The wind conditions are approximately 5 Beaufort and the date of the data acquisition is the 12th July of 2001. The erroneous current values, which are too high close to the shore and over the shoal at the north west corner of the observation area, indicate grid cells for which the linear dispersion is not valid.
Surface currents by Radar Doppler Current Profiler (RDCP)
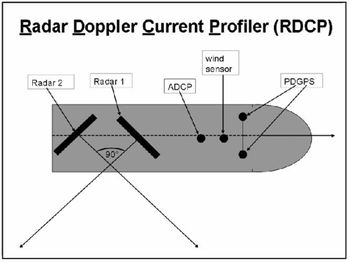
The radar Doppler shift from the sea surface is used for the detection of the sea surface currents. With a coherent radar system it is possible to measure the speed of the scatterers directly. The ground based coherent X-band radar system can be mounted either onshore or onboard a ship to observe sea surface scatterer velocities. The view direction of the azimuthal antenna and data acquisition are computer controlled and defined by the user. Three different operating modi are possible and necessary for different applications: rotating antenna (also with different rotating speeds), stepping (changing view directions by set observing time) and the third mode is to observe permanently a chosen direction. At a permanent radar station ashore, the stepping mode is used for measuring currents and small-scale features like convergences/divergences or small eddies. Using the fixed view direction and a second radar antenna a full current vector can be measured by moving the ship. This method of scanning the horizontal current profiles is called Radar Doppler Current Profile (RDCP). The transmitters are synchronized to acquire the two orthogonal components of the sea surface current during a single passage of the ship.
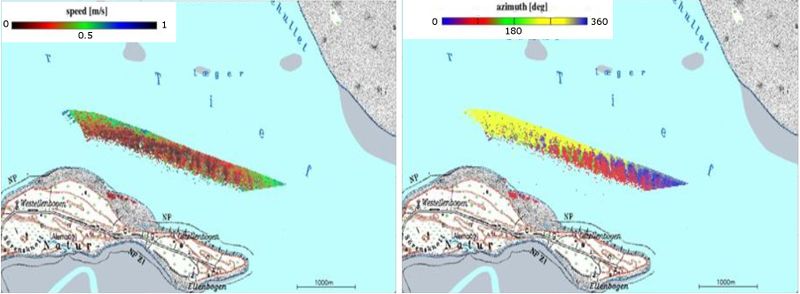
Figure 9 shows the plan view of a ship with a mounted RDCP. In addition to the radars a precise navigation is needed to track the accurate position and the instantaneous radar view directions. Acoustic Doppler Current Profile (ADCP) measurements are acquired to validate the surface current observations and to extrapolate the current field in the vertical direction (See also Currents and turbulence by acoustic methods). To avoid interferences, the alternating operation is controlled by the master radar (1) that interlaces every second pulse to the slave radar (2). Each radar transmits and receives 1000 coherent pulses per second. The scan angle between the two antenna directions is 90°, with one antenna direction 45° ahead and the second direction 45° after. Using the Doppler relation we calculate the radial velocities from the backscattered signal for each range bin (length order of 7.5m). Integrating the radar observations over a second, the radial speed results in an accuracy of 1.5 cm/s. These values have to be corrected by the local impact of the actual wind friction and ship movement. An automatic quality control rejects routinely faulty data. For offshore application a motion sensor has to be integrated into the system to correct the instantaneous antenna movements due to wave impact. The post processing procedure is to compose the full surface current vector by merging the two components into a geo-coded grid with the grid distance up to 10 m. Results for the Lister Tief are shown in Fig. 10.
Recent applications of X-band radar
Recent (2019,2020) studies of microwave radar applications in oceanography are aimed at investigating more performant methods for analyzing radar backscatter spectra, in order to provide more accurate bathymetric maps.
Chernyshov et al. (2020[15]) used X-band radar for establishing nearshore bathymetric maps of the coastal zone off the island of Sylt in the German Bight. They used traditional Fast Fourier Transform techniques for retrieving peak frequency maps and a localized 2D Continuous Wavelet Transform for retrieving the corresponding peak wavenumbers. The accuracy obtained was in the range 2.6–6.6% root-mean-square-error (RMSE) of the maximum water depth.
Honegger et al. (2019[16]) used X-band radar for obtaining high-resolution estimates of the shoreface bathymetry at two contrasting beaches (Duck, Atlantic coast and Benson beach, Pacific coast). The algorithm used for analyzing radar spectra is similar to the one previously developed for retrieving bathymetry from optical video observations. This algorithm uses frequency dependent empirical orthogonal functions (EOF) to extract coherent spatial structures at each frequency. The performance of X-band radar was found to be comparable to optical video (RMSE of 0.35-0.5 m for water depth greater than 2 m). Results were substantially improved by Kalman filtering.
The same authors used a similar method for determining the bathymetry of an ebb-tidal shoal (New River Inlet, NC) and an estuarine river mouth (Columbia River, OR/WA)[17]. Simultaneous estimation of depth and currents via inversion of the dispersion relation including Doppler shifts was required at the deep estuary mouth, where currents affect the incident wave field. In the estuary channel with locations as deep as 27 m, Kalman-filtered depths achieve 0.92 m RMSE and 0.38 m depth bias as compared to a concurrent sounding survey (95% of estimates are within 10% of those surveyed). Independent of the Doppler compensation technique, Kalman filtered depths can be used to more tightly constrain high-resolution current velocity estimates.
Gawehn et al (2020[18]) used X-band radar for monitoring near-shore sand nourishments on an open sandy coast (21 million m3) and an ebb-tidal delta (5 million m3). Morphologies were derived from analyzing the backscatter radar spectrum obtained by applying 3D Fast Fourier Transformation (FFT). In both cases large agreement with ground truth data was found. Depth biases were around -0.9 m (1.32 m RSME) at the open coast nourishment and fluctuated between approximately -2 – 0 m at the ebb-tidal delta nourishment (-0.7 m mean bias, 1.2 m RSME). By averaging and debiasing the radar-derived morphologies, it was possible to accurately quantify the growth of the ebb tidal delta nourishment during its placement in 2018 with a volumetric margin error of 7%. The combined effect of a Kalman filter and an analysis based on amplitude spectra was a reduction of the overall depth bias to -0.58 m and RMSE to 0.88 m at the open coast nourishment.
Applications and examples of High Frequency radar
This section describes how HF-radar is used for the measurement of maps of surface currents, ocean wave spectra and wind direction.
Measurement of surface current maps
If an ocean surface current is transporting the Bragg resonant waves (cf. the two first-order Bragg peaks in Fig. 4) the first-order Bragg peaks are shifted in frequency, as indicated in the dispersion relationship (Eq. 1). This shift moves both peaks by the same amount and to the same direction and its amount can be used to calculate the radial component of the surface current. The surface current value measured represents the average from the surface down to about 16% of the ocean wave length, which is e.g. the top 160 cm of the ocean at 15 MHz radar frequency.
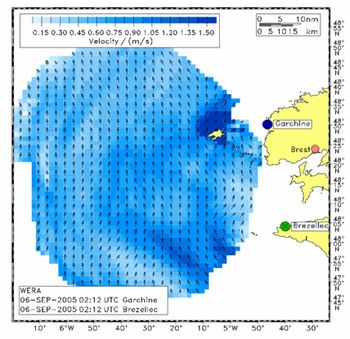
Because one HF radar measures the radial component of the current, a second HF radar some 10 km apart is required to calculate the 2-dimensional surface current from the two radial components. Generally two radials must have an angle greater than 30 degrees and less than 150 degrees to resolve the current vector. Fig. 11 shows an example of a surface velocity field measured off Brest, France.
As the surface current vector is calculated from two radial components, the resulting accuracy depends on the errors of the radial components itself and on the angle between them. An angle of 90° between the radial components leads to the lowest errors, while angles around 0° or 180° dramatically increase the error orthogonal to the radial components. This degrade of accuracy is also known from the Global Positioning System (GPS) and is called Geometrical Dillution Of Precision (GDOP). To measure the accuracy, several comparisons between currents measured by current meters or ADCPs and HF radar have been made. The total RMS difference between these instruments is in the range 5-15 cm/s (Essen et al. 2000[19], Graber et al. 1997[20]). Note that the two systems measure different things: The HF radar averages the current over an area of about 1 km2, while the in situ instruments always provide point measurements. Especially in areas with strong current shear due to topography or geostrophic effects, large deviations can be observed between the instruments.
It is important to keep in mind the following points about HF radar-derived currents: (1) the effective depth of the measurement depends on the depth of influence of the Bragg waves and is quite shallow (order of 1 m), (2) stable estimates require scattering from hundreds of wave crests plus ensemble averaging of the spectral returns, which sets the space-time resolution of the instruments, (3) the precision is limited by the frequency resolution of the Doppler spectrum and is typically 2-5 cm –1, and (4) the accuracy is controlled by numerous factors, such as signal-to-noise ratios, pointing errors, and geometry[21].
Measurement of ocean wave spectra maps
The second-order sidebands seen in Fig. 4 contain information about the ocean wave directional spectrum. Note that these sidebands may be hidden by stronger first-order Bragg peaks shifted by a different current velocity from other directions in case of non-directive receiving antennas.
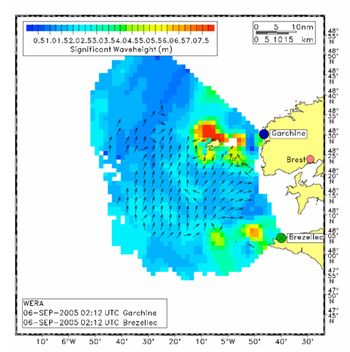
There are two kinds of algorithms to derive the ocean wave spectra from the second-order sidebands: Most are based on the inversion of the Barrick-Weber equations (Barrick et al. 1977[2]), for example the method developed by Wyatt (2000[22]) which allows resolving bi-modal sea states. This method reaches its limitations when the length of the Bragg-resonant ocean wave raises to the order of the significant wave height. The other kind of algorithms is based on an empirical approach, i.e. finding calibration factors by linear regression. The algorithm described by Gurgel et al. (2006[23]) falls into this category. Fig. 12 shows an example of a wave field off the coast of Brest, France, obtained with this method.
Due to problems associated with reliably identifying the first-order Bragg peaks when the significant wave height reaches the length of the Bragg-resonant ocean waves, both algorithms show saturation effects: At 27 MHz radar frequency, the wave measurement saturates at [math]H_s \sim [/math]7.5 m, at 12.5 MHz, the limit is at [math]H_s \sim[/math]16 m. During high sea state conditions, a lower radar frequency has some advantages, however, the lowest detectable sea state is higher in this case.
There are several papers discussing the accuracy of HF radar wave measurements. An extensive comparison has been published by Wyatt et al. (2003[24]) within the EuroROSE (European Radar Ocean Sensing, EU Mast-3, CT98-0168) project.
Measurement of wind direction maps
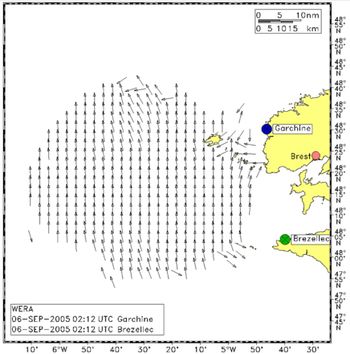
By exploiting the ratio of the two first-order Bragg peaks in the backscatter Doppler spectrum (cf. Fig. 4), the direction of the Bragg-resonant ocean waves can be calculated. As these are quite short and refer to the wind-induced part of the ocean wave spectrum, they give a good indication of the wind direction. The wind-induced ocean waves follow changes in the wind direction with some 10-15 min. delay. Fig. 13 shows an example of the wind direction measured off the coast of Brest, France.
The algorithm to calculate the wind direction consists of fitting the ratio of the amplitudes of the two first-order Bragg peaks to a [math]\large\cos^s(0.5 \theta)[/math] or [math]\large sech^s(\theta)[/math] angular distribution model (Gurgel et al. 2006[23]). As this distribution model has a symmetric shape, the solution is ambiguous if one Bragg line ratio is available. A second Bragg peak ratio from a different direction, provided by a second HF radar, solves this ambiguity. A second radar site is required to measure ocean currents, anyway.
Wind speed measurements by HF radar are still under investigation. The problem is, that with increasing winds the wave energy of the Bragg-scattering waves increases less and less and nearly reaches saturation. Instead of further increasing the wave height, the energy is transferred to longer ocean waves by nonlinear wave-wave interaction. Exploiting the level of the first-order Bragg peaks is not sufficient in this case, and the complete ocean wave spectrum must be considered.
See also
- Waves and currents by X-band radar
- Bathymetry German Bight from X-band radar
- Satellite-derived shoreline and nearshore bathymetry
- Bathymetry from remote sensing wave propagation
References
- ↑ Crombie, D.D. 1955. Doppler spectrum of sea echo at 13.56 Mc/s. Nature 175: 681--682
- ↑ 2.0 2.1 Barrick, D.E., Evans, M.W. and Weber, B.L. 1977. Ocean surface current mapped by radar. Science 198: 138--144
- ↑ Stewart, R.H and Joy, J.W. 1974. HF radar measurement of surface current. Deep-Sea Res. 21: 1039–49
- ↑ Ijima, T., Takahashi, T. and Sasaki, H. 1964. Application of radars to wave observations. Proc. 11th Int. Conf. Coastal Engineering 30(1): 10-22
- ↑ Wright, W.F. 1965. Wave observations by shipboard radar. Ocean Science and Ocean Engineering 1: 506-514
- ↑ Ziemer, F., Rosenthal, W. and Carlson, H. 1983. Measurements of directional wave spectra by ship radar. IAPSO Symposium, General Assembly, Int. Assoc. for Phys. Sci. of the Oceans, Hamburg
- ↑ Skolnik, M. (1990) Radar Handbook. McGraw-Hill Publishing Company. New York
- ↑ Middleditch, A. 2006. Spectral Analysis in High Frequency Radar Oceanography. PhD thesis, University of Sheffield
- ↑ Vogelzang, J., Wensink, G.J., Calkoen, C.J. and Van der Kooij, M.W.E. 1997. Mapping submarine sandwaves with multi-band imaging radar 2. Experimental results and model comparison. Source: Journal of Geophysical Research 102: 1183-1192
- ↑ Gurgel, K.-W., Antonischki, A., Essen, H.-H., Schlick,T . 1999. Wellen Radar (WERA), a new ground-wave based HF radar for ocean remote sensing. Coastal Engineering 37(3-4): 219—234
- ↑ Flampouris, S. 2006. Investigation of correlations between radar deduced bathymetries due to the outer impact of a storm in the area “Salzsand”. M.Sc. Thesis; GKSS 2006/16. Geesthacht.
- ↑ Senet, C.M., Seemann, J. and Ziemer, F. 2001. The Near-Surface Current Velocity Determined from Image Sequences of the Sea Surface. IEEE Transactions on Geoscience and Remote Sensing 39: 492-505.
- ↑ Senet, C.M., Seemann, J., Flampouris, S. and Ziemer, F. 2007. Determination of Bathymetric and Current Maps by the Method DiSC Based on the Analysis of Nautical X–Band Radar-Image Sequences of the Sea Surface. IEEE Transactions on Geoscience and Remote Sensing 46: 2267-2279.
- ↑ Flampouris, S., Ziemer, F. and Seemann, J. 2007. Survey of Bathymetry and Current Fields by Radar Image Series Acquired by Shore Based X-Band Radar. eProceeding IGARSS 2007, Barcelona 23-27 July 2007.
- ↑ Chernyshov, P., Vrecica, T., Stresser, M., Carrasco, R. and Toledo, Y. 2020. Rapid wavelet-based bathymetry inversion method for nearshore X-band radars. Remote Sensing of Environment 240, 111688
- ↑ Honegger, D.A., Haller, M.C. and Holman, R.A. 2019. High-resolution bathymetry estimates via X-band marine radar: 1. beaches. Coast. Eng. 149: 39–48
- ↑ Honegger, D.A., Haller, M.C. and Holman, R.A. 2020. High-resolution bathymetry estimates via X-band marine radar: 2. Effects of currents at tidal inlets. Coast. Eng. 156, 103626
- ↑ Gawehn, M., Van Dongeren, A., De Vries, S., Swinkels, C., Hoekstra, R., Aarninkhof, S. and Friedman, J. 2020. The application of a radar-based depth inversion method to monitor near-shore nourishments on an open sandy coast and an ebb-tidal delta. Coastal Engineering 159, 103716
- ↑ Essen,H.-H., Gurgel,K.-W., Schlick,T. 2000. On the accuracy of current measurements by means of HF radar. IEEE J. Oceanic Engineering 25(4): 472--480
- ↑ Graber, H.C., Haus, B.K., Chapman, R.D., Shay, L.K. 1997. HF radar comparisons with moored estimates of current speed and direction: Expected differences and implications. J. Geophys. Res. 102-C8: 18,749--18,766
- ↑ Paduan, J.D. and Graber, H.C. 1997. Introduction to high frequency radar: reality and myth. Oceanography 10 :36–39
- ↑ Wyatt,L.R. 2000. Limits to the inversion of HF radar backscatter for ocean wave measurement. Journal of Atmospheric and Oceanic Technology 17:1651--1665
- ↑ 23.0 23.1 Gurgel, K.-W. Essen, H. H. and Schlick, T. 2006. An Empirical Method to Derive Ocean Waves From Second-Order Bragg Scattering - Prospects and Limitations. IEEE Journal of Oceanic Engineering 31: 804-811.
- ↑ Wyatt, L. R., Green, J. J., Gurgel, K.-W., Nieto-Borge, J. C., Reichert, K., Hessner, K., Guenther, H., Rosenthal, W., Sætra, Ø. and Reistad, M. 2003. Validation and intercomparisons of wave measurements and models during the EuroROSE experiments. Coastal Engineering 48: 1-28
This article has been written by: Friedwart Ziemer, Klaus-Werner Gurgel, Marius Cysewski and Stylianos Flampouris
Please note that others may also have edited the contents of this article.
|
