Acoustic point sensors (ASTM, UHCM, ADV)
This article is a summary of sub-section 5.6.4.5 of the Manual Sediment Transport Measurements in Rivers, Estuaries and Coastal Seas [1]. The article describes how acoustic point sensors can be used to measure velocity and sand concentrations.
Instruments
Acoustic Sand Transport Meter (ASTM)
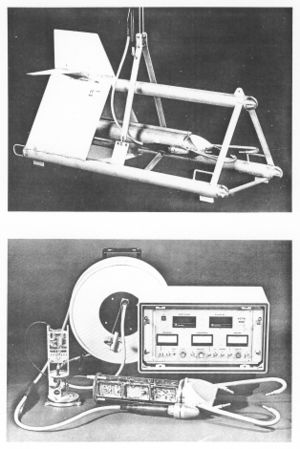
Delft Hydraulics (1994[2]) has developed an instrument (ASTM or USTM; Acoustic or Ultrasonic Sand Transport Meter; in Dutch: Acoustische Zand Transport Meter) for measuring the velocity and sand concentration in a point. The USTM or ASTM (Figures 1 and 2) is an acoustic instrument for measuring the flow velocity in 1 or 2 horizontal dimensions and the sand concentration [math]c[/math].
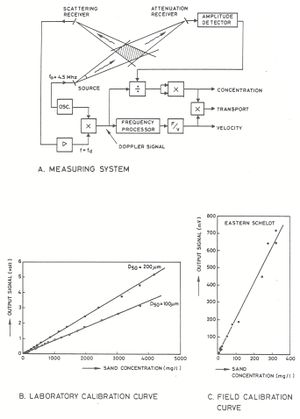
The Acoustic Sand Transport Monitor (ASTM) is based on the transmission and scattering of ultrasound waves by the suspended sand particles in the measuring volume, as shown schematically in Figure 1A. Using the amplitude and frequency shift of the scattered signal, the concentration and velocity and hence the transport of the sand particles can be determined simultaneously and continuously. The ASTM consists of a sensor with a pre-amplifier unit mounted on a submersible carrier and a separate converter with panel instruments and switches (Figure 2). The velocity measurement if mounted on a carrier is one-dimensional and related to the carrier orientation, which is measured by means of a magnetic compass. The vertical position is measured by a pressure gauge (height beneath water surface) and an echo-sounder (height above bed) mounted on the carrier. A transmitting frequency of 4.5 Mhz has been chosen to minimize the particle size dependency and to make the instrument insensitive to silt particles (< 50 um). The influence of temperature and salinity variations is also negligible.
Five-fold two-dimensional ASTM
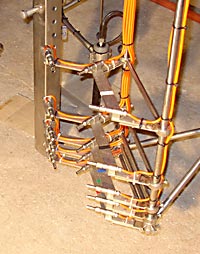
Delft Hydraulics has designed a five-fold two-dimensional ASTM consisting of five identical sensors (Figure 3) for use as stand-alone instrument mounted in a tripod. Each sensor consists of one transmitter and two receivers in a horizontal arrangement (measurement volume is about 0.2 m from transmitter). The transducer heads are connected by a cable of 5 m to the electronics container (diameter of 0.27 m and length of 0.6 m). The transmitter produces a 4.4 MHz signal, which is scattered by the sediment in suspension in front of the transmitter. This signal is subsequently sampled with a frequency of 2 Hz. The backscattered signals are analysed to obtain the signal intensity and the frequency shift (Doppler effect). The velocity of the sand particles can be derived (without calibration) from the frequency shift. The signal intensity is a measure of the sand concentration and also depends on local sediment characteristics such as the texture, the angularity and the density of the sediment (calibration curve). The measuring range for the sand concentration of the ASTM (linear response) is about 0.1 to 10 kg/m3. According to the manufacturer (Delft Hydraulics) the maximum error amounts to about 3% of the measured velocity value and 30% of the measured concentration value. The five-fold ASTM was successfully used during long-term field deployments in the North Sea to measure the sand transport process under combined current and wave conditions (Grasmeijer et al., 2005[3]).
UHCM-instrument
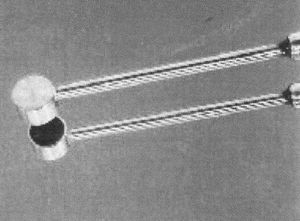
The UHCM-instrument (only concentration) is a small-sized instrument (Figure 4) which has been developed for the high concentration range of 1 to 100 kg/m3 near the bed. This instrument is based on the measurement of the attenuation of ultra-sound by the sediment particles. The transducer heads are close together at a distance of about 10 to 20 mm (depending on application; user-specified).
Point-measuring Acoustic Doppler Velocitymeter (ADV)
Rijkswaterstaat (2005[4]) has made an attempt to use the backscattered signal from the point-measuring Acoustic Doppler Velocitymeter (ADV-ocean) from SONTEK-instruments. This instrument was tested in a laboratory flume and in field conditions. The laboratory tests showed that there is a positive correlation between sediment concentration and backscattered signal. The field tests in the Western Scheldt estuary (near Hansweert) consisted of concentration-measurements using the point-measuring ADV and another point-measuring acoustic instrument (ASTM from Rijkswaterstaat). This latter instrument mounted in a streamlined body suspended at a cable from the survey boat measures velocity and concentration simultaneously in one point above the bed. The ADV was operated with a time-averaging interval of 0.5 s. The sampling frequency was in the range of 10 to 20 Hz. The measured concentrations were in the range of 0.1 to 4 gr/l. Analysis of the measured concentrations using both instruments shows that the ADV cannot measure concentrations larger than about 0.5 gr/l (500 mg/l) due to saturation effects. The concentrations show a weak non-linear behaviour in the lower range between 0.1 and 0.5 gr/l. The velocities of the ADV and ASTM show close agreement. The overall conclusion is that the ADV is potentially usable as sand concentration and transport meter, but its working range is insufficient at present (maximum concentration of about 0.5 gr/l) to cover the near-bed region of the water column where the concentrations are largest and most of the sand transport takes place.
Acoustic Doppler Velocitymeter (ADV) backscattered signal
Fugate and Friedrichs (2002[5]) have successfully used the ADV backscattered signal (Sontek ADV) to determine the concentrations [math]c[/math] in the range of 20 to 100 mg/l at a site in Chesapeake bay (USA). The ADV proved to be a versatile instrument for characterizing the suspended sediment dynamics. Acoustic backscatter from the ADV was relatively insensitive to grain size differences, thus producing good estimates of mass concentrations. In addition, the ability of the ADV to measure Reynolds bed stresses ([math]u'w'[/math]) and vertical Reynolds fluxes ([math]w'c'[/math]) of sediment allows estimation of the critical shear velocities and the indirect analytical estimation of settling velocity of the sediments involved. See also Currents and turbulence by acoustic methods.
Calibration curve
The ASTM has been calibrated using pump sampling concentrations obtained during experiments in the Deltaflume (Chung and Grasmeijer, 1999[6]). The five intake openings of the pump sampling equipment were positioned close to the acoustic sensors. The time-averaged sand concentrations measured by the five intake tubes of the pump sampler near the acoustic sensors have been used to determine the calibration curve of the ASTM. The time-averaged (over about 15 min) sand concentrations are between 0 and 3.7 kg/m3 for the coarse sediment (0.33 mm sand) and between 0 and 2.7 kg/m3 for the finer sediment (0.16 mm sand). For concentrations larger than * 0.05 g/l the output of the ASTM varies linearly with the sediment concentration. For smaller concentrations (<0.05 g/l) the ASTM output is larger than may be expected for a linear relationship. This is in agreement with the measuring range of the ASTM according to technical specifications ([math]0.1\lt c \lt 10 [/math]kg/m3). The calibration curve can be represented by: Concentration ASTM = 0.257*Output ASTM. The effects of particle size in sand size range of 0.16 to 0.33 mm (d50= 0.16 mm and d50= 0.33 mm) is negligibly small.
The relationship between the output signal ([math]I[/math]) and the sand concentration ([math]c[/math]) is as follows:
[math]I\,=k\,c\,[/math]
in which: [math]k[/math] = calibration constant, depending on properties of the transducers and sand particles (size, shape).
The inaccuracy of the measured velocity is about 2% (of the full scale). The inaccuracy of the measured sand concentration follows from the inaccuracy (scatter) of the calibration curve. Figure 1 shows an example for field conditions (Eastern Scheldt, The Netherlands), where a pump filter sampler has been used for calibration. The overall accuracy is about 20%.
See also
Summaries of the manual
- Manual Sediment Transport Measurements in Rivers, Estuaries and Coastal Seas
- Chapter 1: Introduction, problems and approaches in sediment transport measurements
- Chapter 2: Definitions, processes and models in morphology
- Chapter 3: Principles, statistics and errors of measuring sediment transport
- Chapter 4: Computation of sediment transport and presentation of results
- Chapter 5: Measuring instruments for sediment transport
- Chapter 6: Measuring instruments for particle size and fall velocity
- Chapter 7: Measuring instruments for bed material sampling
- Chapter 8: Laboratory and in situ analysis of samples
- Chapter 9: In situ measurement of wet bulk density
- Chapter 10: Instruments for bed level detection
- Chapter 11: Argus video
- Chapter 12: Measuring instruments for fluid velocity, pressure and wave height
Other internal links
- Light fields and optics in coastal waters
- Acoustic backscatter profiling sensors (ABS)
- General principles of optical and acoustical instruments
Further reading
- Delft Hydraulics, 1980. Methods for measuring velocity and sediment concentrations in breaker zone (in Dutch). Report R971. Delft, The Netherlands
- Jansen, R.H.J., 1978. The in-situ Measurement of Sediment Transport by Means of Ultrasound Scattering. Delft Hydraulics Laboratory, Publication No. 203, Delft, The Netherlands
- Jansen, R.H.J., 1979. An Ultrasonic Doppler Scatterometer for Measuring Suspended Sand Transport. Ultrasonics Internal Conference, Graz, Austria
- Jansen, R.H.J., 1981. Combined Scattering and Attenuation of Ultrasound. IAHR-Workshop on Particle Motion and Sediment Transport, Rapperswil, Switzerland
- Schaafsma, A.S. and Der Kinderen, W., 1985. Ultrasonic Instruments for the Continuous Measurement of Suspended Sand Transport. IAHR-symposium Measuring Techniques, Delft, The Netherlands
- Van der Werf, J.J., 2006. Sand transport over rippled beds in oscillatory flow. Doctoral Thesis, Department of Civil Engineering, University of Twente, The Netherlands
References
- ↑ Rijn, L. C. van (1986). Manual sediment transport measurements. Delft, The Netherlands: Delft Hydraulics Laboratory
- ↑ Delft Hydraulics, 1994. Manual ASTM (in Dutch). Report B329, Delft. The Netherlands
- ↑ Grasmeijer, B.T. et al. 2005. Suspended sand concentrations and transports in tidal flow with and without waves (Paper U). In: Sand transport and morphology of offshore sand mining pits, edited by Van Rijn et al., ISBN90-800356-7-x. Aqua Publications, The Netherlands (www.aquapublications.nl)
- ↑ Rijkswaterstaat, 2005. Acoustic Doppler Velocitymeter as sand transportmeter (in Dutch). Document RIKZ/KW/2005.110W. RIKZ, The Haque, The Netherlands
- ↑ Fugate, D.C. and Friedrichs, C.T., 2002. Determining concentration and fall velocity of estuarine particle populations using ADV, OBS and LISST. Continental Shelf Research, Vol. 22, p. 1867-1886
- ↑ Chung, D.H. and Grasmeijer, B.T., 1999. Analysis of sand transport under regular and irregular waves in large-scale wave flume. Report R99-05, Department of Physical Geography, University of Utrecht.
Please note that others may also have edited the contents of this article.
|
Please note that others may also have edited the contents of this article.
|


