Flocculation cohesive sediments
Information on flocculation of cohesive sediments is dispersed over several Coastal Wiki articles. The most relevant sections, imported from the articles Dynamics of mud transport, Sediment deposition and erosion processes and Coastal and marine sediments, are brought together here.
Contents
Flocculation of cohesive sediments
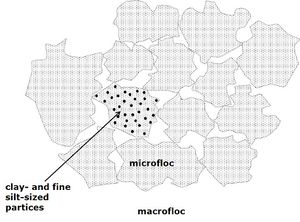
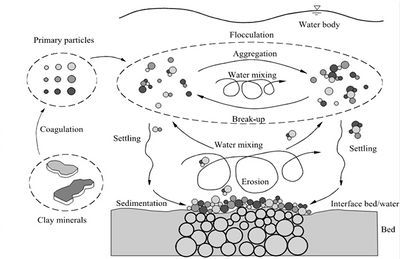
A key feature of mud particles is their cohesive nature that distinguishes them from non-cohesive solid particles such as sand. In soil, only clay minerals possess electrochemical cohesion. The median diameter of the size distribution of clay minerals is typically in the range of 1-2 μm and the spread is about 0.1 to 10 μm. Since clay minerals have a large surface area relative to their weight, the electrical surface charges ensure that they easily bind to one another (aggregate) and to other substances in an aquatic environment as the result of the electrochemical Van der Waals forces. This floc forming process is enhanced by slimes (EPS) and mucus produced by micro-benthos and bacteria (that feed on decaying organic matter). Clays are therefore classified as cohesive sediments. Mud floc dynamics are schematically illustrated in Fig. 1.
The mean threshold diameter (grainsize) [math]d_T[/math] of about 10 μm distinguishing the fractions cohesive particles and larger cohesionless particles has been deduced from the experiments of Migniot[2] on the settling of twenty-seven fine-grained sediments (natural and clay minerals) and a compilation of data by McCave et al.[3] on the erosion of beds of kaolinite flocs and fine-grained quartz (< 62.5 μm) particles.
The size, structure and density of flocs are determined by the forces experienced by the aggregate-particles. These forces comprise: hydrodynamic forces (especially shear), collisions between particles and electrochemical forces (determined by the composition of solid particles and dissolved ions in the ambient water). The latter explains also why mud particles in fresh and saline water have a different structure.
Flocs contain multiple mineral particles of generally much smaller diameters (van Olphen[4]), Fig. 2. They are watery with buoyant weights much lower than that of the mineral, which typically has a wet bulk density of around 2,650 kg m-3. Flocs of silt size (less than about 100 [math]\mu[/math]m) are often called microflocs and those larger macroflocs (e.g. Eisma[5]). An individual macrofloc may comprise up to a million individual particulates. Natural flocs almost always contain organic detritus in variable proportions from practically nil to 100% by weight. Organic-rich mega-flocs (typically 1000 [math]\mu[/math]m) are often linked to seasonal biological events, such as algae-blooms. Their light weight and the biochemical bonding they provide can substantially influence floc properties (e.g. Gerbersdorf et al.[6]). Instead of microflocs, the term aggregates is also used, while the term flocs designates macroflocs (Law et al.[7]). Microflocs (aggregates) typically have undergone frequent cycles of formation, breakup, deposition and suspension during which inter-particle strength has increased presumably as a result of compaction and/or bacterial activity. The settling velocity of microflocs is usually greater than macroflocs of equal size due to their higher density and tighter packaging. Macroflocs (flocs) are associations of fine particles including microflocs that have recently formed, typically on tidal time scales. They have a loose structure and low density which makes them more susceptible to break up under turbulent stress. Despite the trend to characterize the floc structure by a fractal number (Kranenburg[8]), the structure is not self-similar. In general, the fractal dimension decreases with increasing floc size, which implies that the floc structure becomes more and more open and its strength decreases. Investigation of floc structure with micro CT scanning suggests that floc settling velocities do not depend basically on floc size but that floc composition, porosity and pore morphology play an important role[9].
Settling Velocity
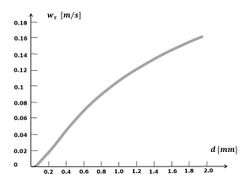
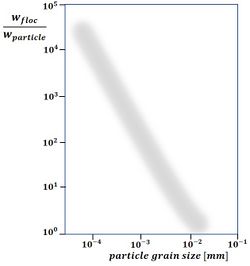
If the settling rate for very small particles, such as clay minerals, followed the curve for the settling rate of quartz spheres (see Figure 3), it would be so low that they almost never reach the seabed from suspension. The ubiquitous mud beds in coastal waters point to a different settling mechanism. This mechanism consists of flocculation, which incorporates these very small particles in flocs of much larger size and with aerodynamic shape. Macroflocs can typically reach 1-2 mm in diameter, but their effective densities (i.e. the floc bulk density less the water density) are generally less than 50 kg.m-3 [10]. Observations show that flocs settle much faster than the individual constituent particles - a factor of a thousand or more, see Fig. 4. A substance that serves as a powerful binder is so-called EPS, extracellular polymeric substances (Grabowski et al.[11]). These large organic molecules (polysaccharides, proteins, nucleic acids and lipids) are exuded by living organisms and therefore omnipresent in coastal waters. Flocs grow much faster in natural seawater than in salinized distilled water (Skinnebach et al.[12]). In addition to EPS, bacterial colonization also plays a role in flocculation (Linley and Field[13]). Flocculation is further influenced by factors such as salinity and pH of the water[14]. When flocs grow, they not only capture smaller flocs that settle more slowly, but also other suspended sediments, such as detritus, silt and fine sand. Frequent encounters between sediment particles are important for floc growth. Flocculation is thus enhanced with a high concentration of suspended material and with a certain (low) degree of turbulence (often expressed as the turbulent shear rate [math]G[/math]), dependent on the suspended sediment concentration (Mietta et al.[15]).
The process of flocculation occurs most often in a tidally dominated system during slack water, when the coincidence of elevated concentration and low-to-moderate turbulence allows flocs to grow. The time scale for floc formation depends on concentration squared (Hill et al.[16]). At high concentration, flocs form rapidly and settling begins almost immediately, but at low concentration there is a time lag before settling while particles form flocs. Disaggregation is the process of floc destruction and occurs under energetic conditions; marine flocs break up when turbulent stresses are around or above 0.1-0.5 Pa (the general case in estuaries, at least during part of the tidal cycle)[16][10]. Deposition occurs when stress is low enough for flocs to settle from the water column. It is associated with decreases in concentration and overall particle size. As a suspension settles, however, a temporary increase in concentration near the seabed can occur[7].
Settling velocity formulas
Using a special camera, Van Leussen (1994[17]) observed vertical particle motions in the Ems-Dollard estuary during different tidal phases. From these observations he deduced that the settling velocity of these particles critically depended on two variables: the volume concentration [math]\phi[/math] of the particles and the degree of turbulence, characterized by the turbulent velocity shear rate [math]G[/math]. He proposed for the dependence of the settling velocity on these variables the formula
[math]w_s = w_{sh}(G) \Large \Big( \frac{\phi}{\phi_h}\normalsize \Big)^n , \quad w_{sh}(G) = w_{s0} \Large\frac{1+\lambda_a G}{1+ \lambda_b G^2}\normalsize . \qquad (1)[/math]
The velocity shear rate with dimension [math][s^{-1}][/math] is given by [math]G = \sqrt{\Large\frac{\epsilon}{\nu}}\normalsize = \sqrt{\Large\frac{\tau}{\rho \nu}\frac{dU}{dz}}\normalsize . \qquad (2)[/math]
Symbols designate: [math]\epsilon=[/math] energy dissipation rate per unit mass, [math]\tau=[/math] shear stress, [math]\nu=[/math] kinematic viscosity, [math]\rho=[/math] water density, [math]U(z)=[/math] the current velocity as a function of depth [math]z[/math]. The volume fraction at the onset of hindered settling is [math]\phi_h[/math] and [math]w_{sh}(G)[/math] is the maximum settling velocity for this volume fraction. The constants [math]w_{s0}, \; \phi_h,\; n,\; \lambda_a, \; \lambda_b[/math] are supposed to be independent of [math]G[/math] but depend, inter alia, on local sediment characteristics and must be determined experimentally. For Ems-Dollard mud, Van Leussen found [math]\lambda_a \approx 0.3, \, \lambda_b \approx 0.09[/math]. Values of the exponent [math]n[/math] widely varied between 0.6 and 3.
Positive values of the parameters [math]n,\, \lambda_a, \, \lambda_b[/math] imply that the settling velocity increases with increasing volume concentration of the suspended particles and increases as the turbulence increases, as long as the shear rate is small. Above a critical value the settling velocity decreases, because turbulent shear destroys the flocs, the large ones first and the smaller ones as the turbulent shear increases further.
For fixed values of [math]G[/math] (from [math]1[/math] to [math]50[/math] s-1), the settling velocity [math]w_s[/math] characteristically increases with [math]\phi[/math] as collisions between flocs/particles increase with particle concentration. Experimental data of floc settling velocity from the Tamar estuary (UK) are shown in Figs. 5 and 6. These data suggest a value [math]n \approx 1/3[/math]. The value [math]n \approx 0.344[/math] was obtained from data on the settling of flocs of sediment from the San Francisco Bay in laboratory flumes, even though the hydraulic conditions were not entirely comparable with those in the bay (Mehta et al. [18]). The value [math]1/3[/math] is also supported by data from other estuaries (Winterwerp and van Kesteren[19]). However, a compilation of empirical settling velocity data from the literature reported values of [math]n[/math] between 0.4 and 2.5, with [math]n=0.55[/math] as best fit for the Gironde estuary[20].
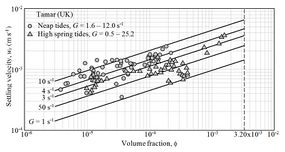 Figure 5. Variation of floc settling velocity with volume fraction and shear rate. Lines are from Eq. (1) with [math]n=1/3[/math]. Data are from Manning[21]. |
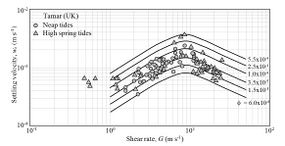 Figure 6. Variation of floc settling velocity with shear rate and volume fraction. Curves are calculated from Eq. (1) with [math]\lambda_a=10, \, \lambda_b=0.01[/math]. Data are from Manning[21]. |
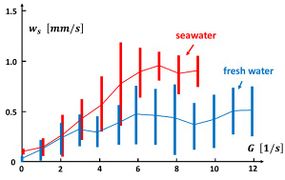 Fig. 7. Settling velocity as function of the velocity shear rate measured in Barataria basin (USA Gulf coast). Redrawn after McDonell et al. (2024[22]). |
According to field data from the Tamar estuary (Fig. 6) and Barataria lagoon (USA, Fig. 7), turbulent fluid motions promote floc formation and particle settling up to a value of [math]G \approx 10 \; [s^{-1}][/math]. The settling velocity in the absence of turbulence is very small ([math]w_s \lt 0.1 \; mm/s[/math]), which implies a value of [math] \lambda_b[/math] on the order of 0.01 [s2] and [math]\lambda_a^2 \gt \gt \lambda_b[/math]. The flocculation process is promoted by salt ions, leading to higher settling velocities in seawater compared to fresh water, as shown in Fig. 7.
From field observations in the Tamar and Gironde estuaries, Soulsby et al. (2013[23]) determined empirical formulas for the settling velocity of mud flocs distinguishing between microflocs and macroflocs. Macroflocs are mainly agglomerates of microflocs, but are less stable than the smaller microflocs. Macroflocs have a higher fall velocity than microflocs because of their much greater size. The various factors that determine the fall velocity are captured in the following formulas, for macroflocs [math] w_{M}[/math] and microflocs [math] w_{\mu}[/math], respectively:
[math] w_{M}=\Large\frac{g B_M}{G}\normalsize \left(\Large \frac{c}{ \rho}\normalsize \right)^k \left(\Large \frac{G d_\mu^2}{\nu}\normalsize \right)^{0.33} \exp \left[-\left( \Large \frac{u_{*M}}{\sqrt{\tau / \rho}}\normalsize \right)^{0.463} \right] , \qquad w_{ \mu}= \Large \frac{g B_\mu}{G}\normalsize \left(\Large \frac{Gd^2}{\nu}\normalsize \right)^{0.78} \exp \left[-\left(\Large \frac{u_{\mu}}{\sqrt{\tau / \rho}}\normalsize \right)^{0.66} \right] , \qquad (5)[/math]
where the index [math]M[/math] designates the macroflocs and the index [math]\mu[/math] the microflocs. The turbulent shear rate [math]G[/math] is given by Eq. (2). Other symbols stand for: [math]d[/math] the grainsize of the constituent primary particles and/or flocculi, [math]d_{\mu}[/math] the grainsize of the constituent microflocs, [math]\tau[/math] is the near-bed shear stress and [math]c [/math] the suspension concentration in [math] kg/l [/math]. For the Tamar and Gironde estuaries the following parameter values were established: [math] B_M = 0.13, \; B_{\mu} = 0.6, \; k = 0.22, \; u_{*M} = 0.067 m/s, \; u_{*\mu} = 0.025 m/s, \; d_\mu = 10^{-4} m, \; d = 10^{-5} m [/math]. The settling velocities observed in the Tamar and Gironde are 0.5-1 mm/s for microflocs and about 5 times larger for macroflocs. The formulas (5) are not simply applicable to every estuary; large differences may occur, for example due to differences in sediment type and composition and biotic processes (extracellular polymeric substances – EPS, and transparent exopolymeric particles – TEP) that promote flocculation[24][25]. In situ observations are necessary for parameter tuning.
The ratio of micro- to macro-flocs is not constant in tidal areas. However, the fluctuations are moderated by the antagonistic effects of coagulation and sedimentation. During periods of strong coagulation (slack tide), the largest flocs are removed from the suspension by settling to the bottom, while the opposite occurs during periods of floc breakup by strong currents[26].
Floc deposition
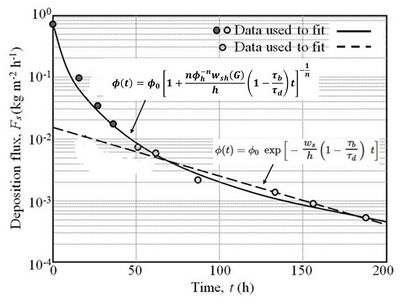
When sinking flocs reach the bottom, it is often assumed that settling on the sediment bed will only occur if the bed shear stress [math]\tau_b \approx \rho u_*^2[/math] is smaller than a critical shear stress for deposition [math]\tau_d[/math]. With this assumption, the volume deposition flux can be written, according to Eq. (1),
[math]F_s = w_s \phi \Big( 1 - \Large\frac{\tau_b }{\tau_d}\normalsize \Big) = w_{sh}(G) \phi_h^{-n} \Big( 1 - \Large\frac{\tau_b }{\tau_d}\normalsize \Big) \phi^{n+1} . \qquad (6)[/math]
In shallow estuaries, flocs are conveyed by current over the entire water depth [math]h[/math]. If we therefore assume for simplicity that the floc volume concentration [math]\phi[/math] and the settling velocity [math]w_s[/math] are uniform over the vertical, then the deposition of flocs in terms of time-rate of decrease of [math]\phi[/math] is given by
[math]h \Large \frac{d\phi }{dt} \normalsize = - F_s = - F_h \phi^{n+1} , \quad F_h = w_{sh}(G) \phi_h^{-n} \big( 1-\Large \frac{\tau_{b}} {\tau_{d}} \normalsize \big) , \qquad (7)[/math]
Solving for [math]\phi[/math] yields
[math]\phi (t)=\phi_0 \Big( 1+\Large \frac{n F_h}{h} \normalsize t \Big)^{-\Large\frac{1}{n}} \normalsize , \qquad (8)[/math]
where [math]\phi_0[/math] is the value of [math]\phi[/math] at the start of deposition (e.g. at the beginning of a time-step in a numerical model), which causes [math]\phi(t)[/math] to decrease (Mehta et al. [18]).
In the hypothetical case that [math]w_s[/math] does hardly depend on the floc volume concentration, the value of [math]n[/math] is small. The expression (8) can then be approximated by
[math]\phi (t) \approx \phi _0 \; \exp\Big[-\Large \frac{w_s}{h} \normalsize \left( 1-\Large \frac{\tau_b}{\tau_d} \normalsize \right) \; t \Big], \qquad (9)[/math]
which is known as the Krone equation.
In Fig. 8, the expression (8) and (9) are fitted to experimental data from a deposition test run in a flume ([math]h = 0.3 \;[/math] m, [math]\; \tau_b = 0.032 \;[/math] Pa, [math]\; \tau_d = 0.081 \;[/math] Pa) using sediment from Mare Island Strait in San Francisco Bay. The difference between the two curves is due to the inclusion of aggregation in Eq. (1). It is evident that, in general, floc aggregation cannot be ignored when modeling floc deposition.
Hindered settling
Hindered settling, which begins when [math]\phi[/math] exceeds [math]\phi_h[/math], is manifested as a decrease in the settling velocity with increasing [math]\phi[/math]. The particles are so close together that the rate at which they settle depends on the rate at which interstitial water can escape upward; this rate decreases as [math]\phi[/math] increases (and flow permeability decreases). A lutocline occurs at the depth of water at which hindered settling starts. According to Eq. (1) the maximum velocity achieved at the onset of hindered settling is dependent on the shear rate.
The simplest model for hindered settling is the Richardson and Zaki[27] equation
[math]w_s = w_{sh}(G) \Big[1-k\left( \Large \frac{\phi }{\phi_{h}} \normalsize -1 \right) \Big]^{5} \quad ; \Large \frac{\phi }{\phi_{h}} \normalsize \ge 1, \qquad (10)[/math]
in which [math]k[/math] depends on the sediment. The exponent 5 (rounded from the experimental 4.65) was shown by the investigators to be consistent with the correction to Stokes law derived by considering the forces on a free-falling particle due to neighboring particles in the viscous regime. As [math]w_{sh}(G)[/math] is not always known, it may be taken from Eq. (1) with [math]G=1[/math], the lowest value arising from shear-induced aggregation, i.e.
[math]w_{s1} = w_{sh}(1) \Large\frac{1+\lambda_a}{1+ \lambda_b}\normalsize . \qquad (11)[/math]
In Lake Apopka in central Florida settling velocities of organic-rich mud ([math]\rho_s = 1,873 \;[/math] kg m-3) were measured with LabSFLOC/INSSEV and also in a laboratory settling column. As shear rates in the lake were low, assuming [math]G = 1 \;[/math] s-1, Eqs. (1) and (10) are plotted in Fig. 9 along with the data.
Related articles
- Dynamics of mud transport
- Sediment deposition and erosion processes
- Coastal and marine sediments
- Mud
- Fluid mud
- Estuarine turbidity maximum
References
- ↑ Maggi, F. 2005. Flocculation dynamics of cohesive sediment. PhD dissertation, TU Delft.
- ↑ 2.0 2.1 Migniot, C. 1968. A study of the physical properties of different very fine sediments and their behavior under hydrodynamic action, La Houille Blanche 7: 591-620 (in French, with abstract in English).
- ↑ McCave, I.N., Manighetti, B. and Robinson, S.G. 1995. Sortable silt and fine sediment size/composition size slicing: parameters for palaeocurrent speed and palaeoceanography. Paleoceanography 10: 593-610.
- ↑ van Olphen, H. 1977. An Introduction to Clay Colloid Chemistry, 2nd ed., Wiley.
- ↑ Eisma, D. 1986. Flocculation and de-flocculation of suspended matter in estuaries, Netherlands Journal of Sea Research 20(2/3): 183-199.
- ↑ Gerbersdorf, S.U., Bittner, R., Lubarsky, H., Manz, W. and Paterson, D.M. 2009. Microbial assemblages as ecosystem engineers of sediment stability, Journal of Soils and Sediments 9: 640-652
- ↑ 7.0 7.1 Law, B.A., Milligan, T.G., Hill, P.S. and Bugden, G.L. 2021. The effect of concentration on particle settling in the Minas Basin, Nova Scotia. Continental Shelf Research 223, 104448
- ↑ Kranenburg, C. 1994. On the fractal structure of cohesive sediment aggregates. Estuarine, Coastal and Shelf Science 39: 451-460
- ↑ Lawrence, T.J., Carr, S.J., Manning, A.J., Wheatland, J.A.T., Bushby, A.J. and Spencer, K.L. 2023. Functional behaviour of flocs explained by observed 3D structure and porosity. Front. Earth Sci. 11, 1264953
- ↑ 10.0 10.1 Manning, A. J., Friend, P. L., Prowse, N, and Amos, C. L. 2007. Estuarine mud flocculation properties determined using an annular mini-flume and the LabSFLOC system. Cont. Shelf Res. 27: 1080–1095
- ↑ Grabowski, R.C., Droppo, I.G. and Wharton, G. 2011. Erodibility of cohesive sediment: the importance of sediment properties. Earth Science Reviews 105 (3-4): 101-12
- ↑ Skinnebach, K.H., Fruergaard, M. and Andersen, T.J. 2019. Biological effects on flocculation of fine-grained suspended sediment in natural seawater. Estuarine, Coastal and Shelf Science 228, 106395
- ↑ Linley, E.A.S. and Field, J.G. 1982. The nature and significance of bacterial aggregation in a nearshore upwelling ecosystem. Estuarine, Coastal and Shelf Science 14: 1-11
- ↑ Abolfazli, E. and Strom, K. 2023. Salinity impacts on floc size and growth rate with and without natural organic matter. Journal of Geophysical Research: Oceans 128, e2022JC019255
- ↑ Mietta, F., Chassagne, C., Manning, A.J. and Winterwerp, J.C. 2009. Influence of shear rate, organic matter content, pH and salinity on mud flocculation. Ocean Dynamics 59: 751–763
- ↑ 16.0 16.1 Hill, P.S., Voulgaris, G. and Trowbridge, J.H. 2001. Controls on floc size in a continental shelf bottom boundary layer. J. Geophys. Res. 106: 9543–9549
- ↑ Van Leussen, W. 1994. Estuarine macroflocs and their role in fine‐grained sediment transport. PhD thesis Utrecht University
- ↑ 18.0 18.1 18.2 Mehta, A.J., Manning, A.J. and Khare, Y.P. 2014. A note of the Krone deposition equation and significance of floc aggregation, Marine Geology 354: 34-39.
- ↑ Winterwerp, J.C., van Kesteren, W.G.M. 2004. Introduction to the Physics of Cohesive Sediment in the Marine Environment. Elsevier.
- ↑ Defontaine, S., Jalón‐Rojas, I., Sottolichio, A., Gratiot, N., Legout, C. and Lienart, C. 2024. Factors controlling mud floc settling velocity in a highly turbid macrotidal fluvial‐estuarine system. Journal of Geophysical Research: Oceans 129, e2024JC021558
- ↑ 21.0 21.1 Manning, A.J. 2001. A study of the effects of turbulence on the properties of flocculated mud. Ph.D. Thesis, University of Plymouth, Plymouth, UK.
- ↑ McDonell, M., Strom, K., Nittrouer, J. and Mariotti, G. 2024. Quantifying mud settling velocity as a function of turbulence and salinity in a deltaic estuary. Continental Shelf Research 273, 105180
- ↑ Soulsby, R.L., Manning, A.J., Spearman J. and Whitehouse, R.J.S. 2013. Settling velocity and mass settling flux of flocculated estuarine sediments. Marine Geology 339: 1–12
- ↑ Maggi, F. 2009. Biological flocculation of suspended particles in nutrient rich aqueous ecosystems. J. Hydrol. 376: 116–125
- ↑ Fettweis, M. and Baeye, M. 2015. Seasonal variation in concentration, size, and settling velocity of muddy marine flocs in the benthic boundary layer: Seasonality of SPM Concentration. Journal of Geophysical Research: Oceans 120: 5648–5667
- ↑ Li, E. and Wirtz, K. 2025. Aggregation of suspended particles limited by preferential settling. Journal of Geophysical Research: Oceans 130, e2025JC022471
- ↑ Richardson, J.F. and Zaki, W.N. 1954. The sedimentation of a suspension of uniform spheres under conditions of viscous flow, Chemical Engineering Science 3: 65-73.
Please note that others may also have edited the contents of this article.
|
